
(T2108 measures the percentage of stocks trading above their respective 40-day moving averages [DMAs]. It helps to identify extremes in market sentiment that are likely to reverse. To learn more about it, see my T2108 Resource Page. You can follow real-time T2108 commentary on twitter using the #T2108 hashtag. T2108-related trades and other trades are occasionally posted on twitter using the #120trade hashtag. T2107 measures the percentage of stocks trading above their respective 200DMAs)
T2108 Status: 70.9% (first overbought day)
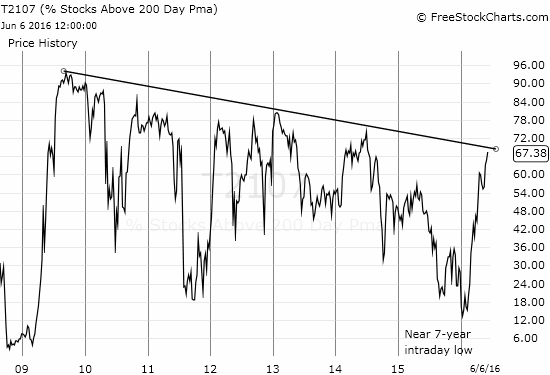
T2107 Status: 67.4%
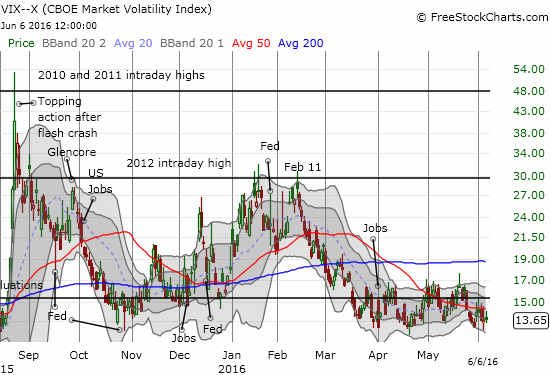
VIX Status: 13.7
General (Short-term) Trading Call: cautiously bullish
Active T2108 periods: Day #79 over 20%, Day #78 over 30%, Day #75 over 40%, Day #9 over 50%, Day #8 over 60%, Day #1 over 70% (ending 23 days under 73%) (day #1 of the overbought period)
Commentary
The stock market overcame the sudden uncertainty from last Friday. The S&P 500 (SPY) continued its quick recovery from Friday’s poor jobs report to hit a new 7-month high. It is still inching closer to a new all-time high.
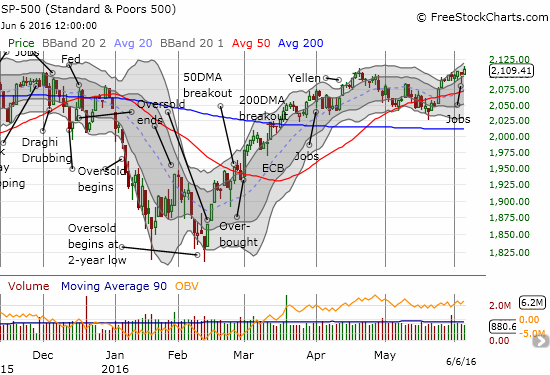
This gain was good enough to push T2108, the percentage of stocks trading above their respective 40DMAs, into overbought territory for the first time in 23 trading days. This achievement makes the stock market incrementally more bullish. However, my trading bias stays “cautious” given the all-time high looms directly overhead (set on May 21, 2015 at 2130.82 on the S&P 500). The index needs to clear that hurdle and demonstrate follow-through buying to get me fully on-board with the bullish camp.
Even MORE interesting is T2107, the percentage of stocks trading above their respective 200DMAs. T2107 closed at 67.4%. This is a new 22+ month high which takes T2107 to a LONG overdue retest of its enduring downtrend. This test of the downtrend may be the most important one of the post-recession period. The stock market is struggling to make a new all-time high. A failure at this resistance could coincide with a failure of the index to break out – and this during a period when the U.S. Federal Reserve is trying to start a normalization of interest rates. On the other hand, my confidence in a new bullrun will be greatly enhanced by a breakout for T2107.
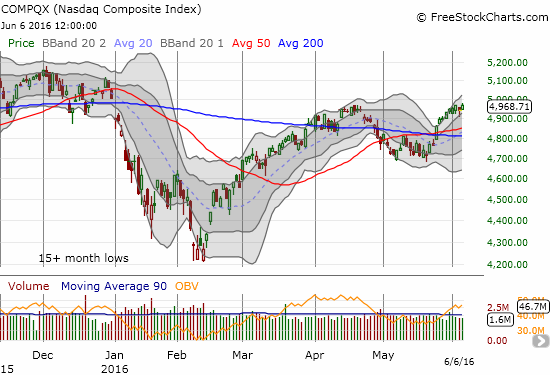
The NASDAQ (QQQ) is also doing well. Still, the tech-laden index has more room for catching up to the S&P 500 on a relative year-to-date basis.
Despite the gains on the day, the volatility index, the VIX, managed to eke out a gain. Per the strategy I outlined in the last T2108 Update, I bought a first tranche of ProShares Ultra VIX Short-Term Futures (UVXY) call options expiring in September. (I have duly noted that the VIX managed to plunge all the way to 12.1 when the S&P 500 achieved its last all-time high).
I finish here with three charts of note: Caterpillar (CAT), iShares Nasdaq Biotechnology ETF (IBB), Apple (AAPL).
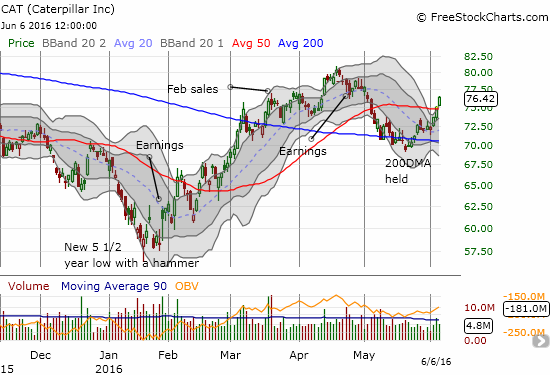
Caterpillar (CAT) rejoined the bullish crowd by printing an impressive 50DMA breakout which essentially confirms 200DMA support (admittedly a sloppy support). As long as the market doubts the Fed can hike rates anytime soon, CAT will likely stay aloft in this breakout. I was caught with put options that expire in August on CAT as part of a pro-dollar bet. The UVXY call options join my CAT puts as a hedge on all my bullish trades going forward.
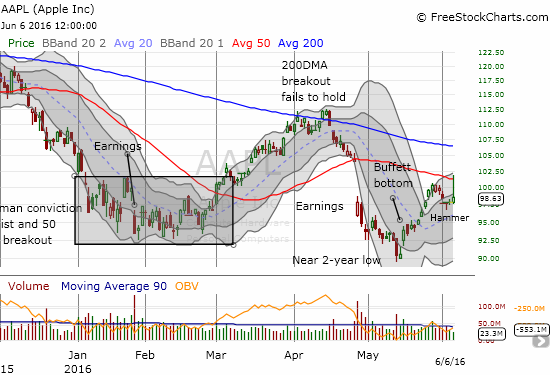
Apple (AAPL) is an interesting case. The Buffett bottom is still well-intact, but the stock slammed right into a brick wall at $100 at the end of May. The stock did not quite test 50DMA resistance. With the stock market turning incrementally more bullish, I think such a retest is still in play. My view is bolstered by last week’s hammer-like end to the pullback form the magic round number of $100. (Ignore that “wick” stretching to the 50DMA – that is an error from the price quoting system).
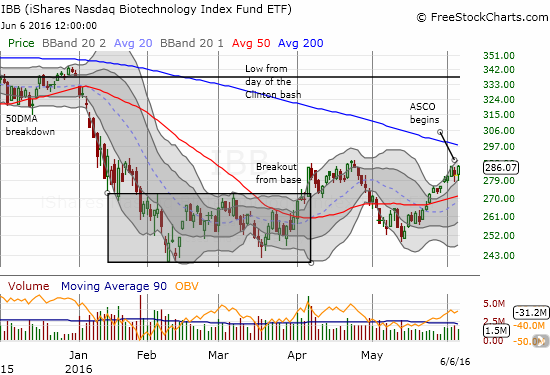
I have bounced between bullishness and bearishness on iShares Nasdaq Biotechnology ETF (IBB). In the middle of chart-reading, I completely neglected to keep an eye for near-term fundamental catalysts. IBB returned to a bullish posture just in time for the American Society of Clinical Oncology (ASCO) annual meeting from June 3 to 7, 2016. IBB has rallied nearly straight from its last low. With the last low remaining intact, the rally seems to confirm a sustainable bottom for IBB. The 50DMA breakout on May 24th was the first sign of that bottom. Now IBB is at a very critical juncture having rallied right to its last high just as ASCO launches. Will the “sell on the news” crowd rule the aftermath or will ASCO produce enough surprising catalysts that buyers will continue to this run? Note also a declining 200DMA looms directly overhead.
— – —
Reference Charts (click for view of last 6 months from Stockcharts.com):
S&P 500 or SPY
U.S. Dollar Index (U.S. dollar)
EEM (iShares MSCI Emerging Markets)
VIX (volatility index)
VXX (iPath S&P 500 VIX Short-Term Futures ETN)
EWG (iShares MSCI Germany Index Fund)
CAT (Caterpillar).
IBB (iShares Nasdaq Biotechnology).
Daily T2108 vs the S&P 500
")
Black line: T2108 (measured on the right); Green line: S&P 500 (for comparative purposes)
Red line: T2108 Overbought (70%); Blue line: T2108 Oversold (20%)
Weekly T2108

*All charts created using freestockcharts.com unless otherwise stated
The charts above are the my LATEST updates independent of the date of this given T2108 post. For my latest T2108 post click here.
Related links:
The T2108 Resource Page
Expanded daily chart of T2108 versus the S&P 500
Expanded weekly chart of T2108
Be careful out there!
Full disclosure: long CAT put options and put spread, long UVXY call options