
(T2108 measures the percentage of stocks trading above their respective 40-day moving averages [DMAs]. It helps to identify extremes in market sentiment that are likely to reverse. To learn more about it, see my T2108 Resource Page. You can follow real-time T2108 commentary on twitter using the #T2108 hashtag. T2108-related trades and other trades are occasionally posted on twitter using the #120trade hashtag. T2107 measures the percentage of stocks trading above their respective 200DMAs)
T2108 Status: 48.4%
T2107 Status: 55.8%
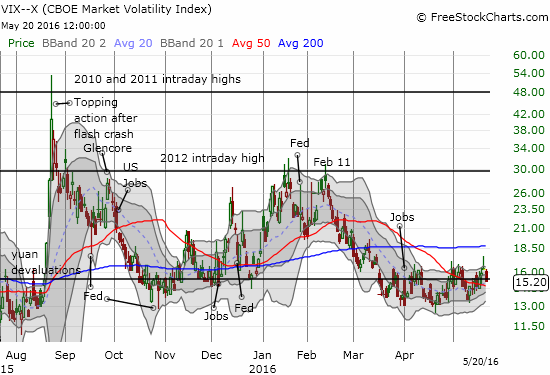
VIX Status: 15.2 (was as high as 17.6 the previous day)
General (Short-term) Trading Call: cautiously bearish
Active T2108 periods: Day #69 over 20%, Day #68 over 30%, Day #65 over 40% (dipped as low as 37.8% the previous day), Day #4 under 50% (underperiod – 58 days over 50% ended on May 16), Day #7 under 60%, Day #14 under 70%
Commentary
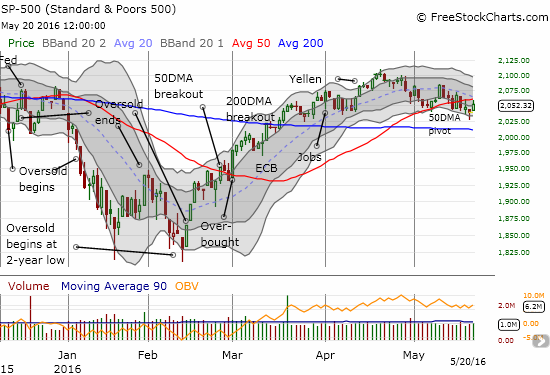
To start the last week of trading, I wrote “Another Buyer’s Surprise Signals Chop Ahead.” The week ended with buying as well, but it just barely kept change for the week in positive territory. The S&P 500 (SPY) gained 0.6% to finish 5 1/2 points higher than the previous Friday’s close. The chart below shows that the index has clearly broken down below support at its 50-day moving average (DMA). Yet, the buying to end the week printed important follow-through to a potential bottoming pattern on Thursday in the form of a “hammer.” I cannot get overly excited about the bottoming because the S&P 500 has been trapped in a chopfest for the last two months. This hammer likely marks the bottom of a range not the start of a big new rally.
The weekly chart reminds us how the S&P 500’s momentum came to a complete stop in late 2014. The subsequent chopfest has driven the index into the deep depths of selling and sent it soaring through breathtaking comebacks. IF the index cannot break through recent highs, we should expect the next sell-off to at least challenge recent lows, if not break them. Note even how volume has tended to dry up going into the peaks and surge going into the lows. For now, I continue to expect a lot of chop in the immediate area that will frustrate/excite bears and bulls alike.
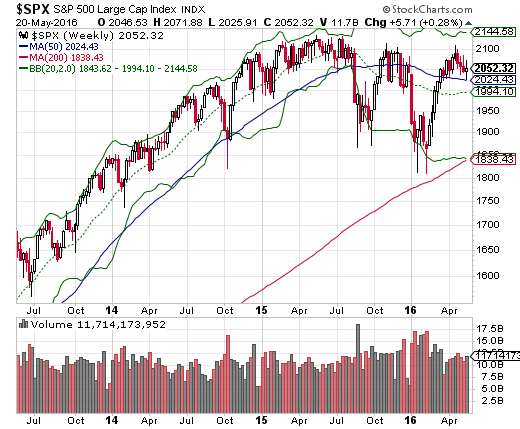
Source: StockCharts.com
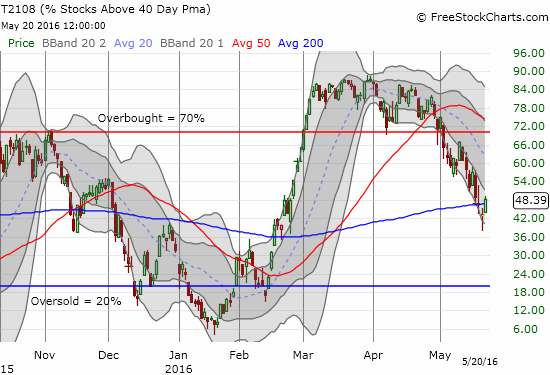
T2108, the percentage of stocks trading above their 40DMAs, is playing the role of bear while also supporting the potential for a bottom.
T2108 has slipped into a persistent downtrend which indicates that the underlying market is weakening a lot more than the major indices tell us. In other words, more and more stocks are dropping out of supportive near-term trends. That message comes from the bear.
The bulls can point to a brief dip below 40% as the first sign that the market’s latest breakdown could be ending. In years past, I noticed that T2108 in the 30s sufficiently flagged an end to a selling trend. Granted, this was during the long stretches of strength in the stock market where T2108 simply refused to drop into oversold territory. Still, I have to respect the quick bounce out of the 30s to upgrade my short-term trading bias from bearish back to “cautiously bearish.” I will not switch back to a bullish bias until the S&P 500 (SPY) breaks through resistance with convincing follow-through. That weekly chart simply appears too ominous to do otherwise.
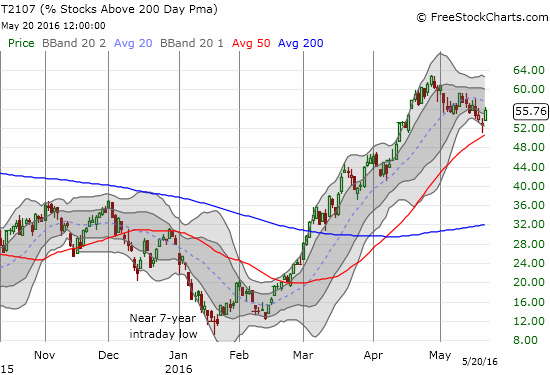
T2107, the percentage of stocks trading above their respective 200DMAs, has trended down in very small “baby steps.” The good news for bulls is that the longer-term health of the stock market still looks relatively healthy. I will worry a LOT more if this downtrend resumes from here.
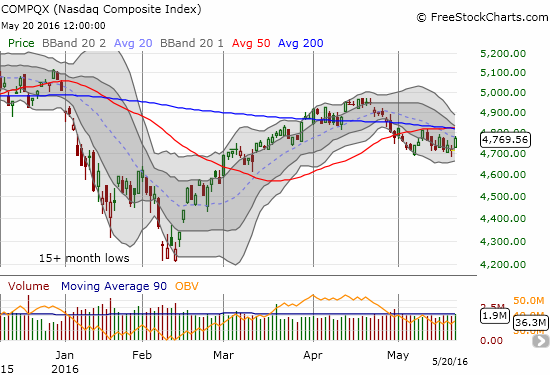
The NASDAQ (QQQ) broke down below its 50DMA support to start the month of May. Yet, sellers have yet to print significant follow-through. When I was bearish, I was convinced such follow-through was imminent. The longer the tech-laden index churns here, the more likely the NASDAQ builds a base of consolidation that will power a breakout from resistance.
The volatility index took a fresh plunge. The brief spurt above the pivot gave bears a little bit of excitement. The burden of proof shifts right back to them with the VIX swinging under the pivot again. Given Friday’s rally seemed just as out of place as the past two one-day wonders, I decided to go ahead and buy call options on ProShares Ultra VIX Short-Term Futures (UVXY) and put options on ProShares Ultra S&P500 (SSO). I chose expirations in two weeks with the expectation that somewhere along the way, the day’s rally, and perhaps more, will reverse enough to make these positions profitable.
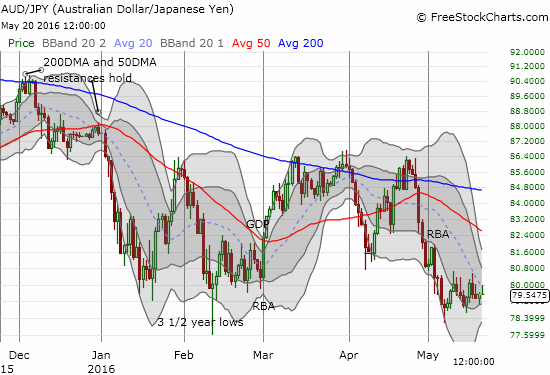
Around midday, the Australian dollar (FXA) stopped supporting the rally. Soon after that, the U.S. stock market topped out. Against the Japanese yen, the Australian dollar is still churning, much like the major indices. So, I am still waiting for the big move to reveal the market’s core sentiment.
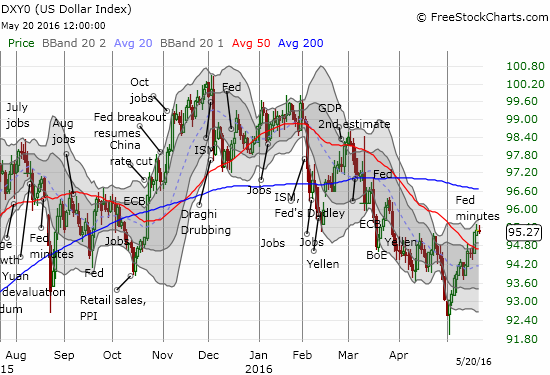
While the overall market continues to put up a fight, the rate sensitive trades are far from off the hook. Positions related to commodities and emerging markets should have a hard time keeping up with any market rally as long as the market buys into the Fed’s rate hike talk. For whatever reason, the odds for a June hike retreated from the 30s to 26.0%. Perhaps this move helped support the rally. However, the odds for the next rate hike remain firmly planted in July for now. Perhaps reflecting the small shift in futures, the U.S. dollar index stalled out on the day.
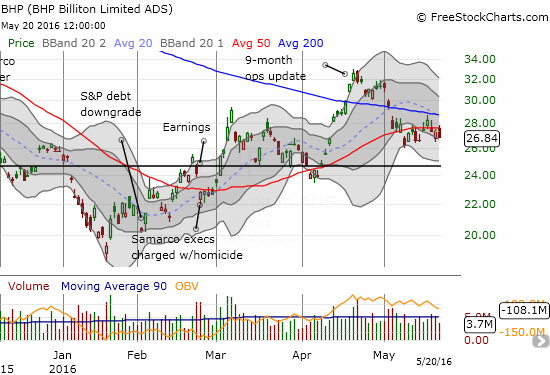
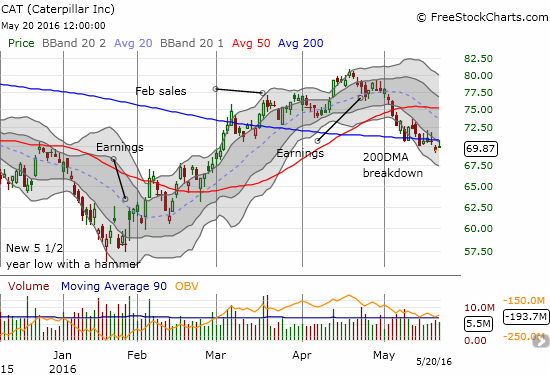
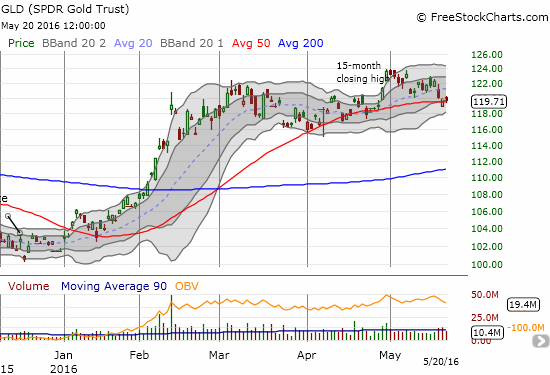
Still, stocks like Caterpillar (CAT), BHP Billiton Limited (BHP), SPDR Gold Shares (GLD), and iShares Silver Trust (SLV) all faded hard from their respective highs on the day. In the case of BHP, I just missed out a successful short as I was waiting for a slightly higher price. In the case of SLV, I am VERY tempted to make a play for a successful test of 50DMA support with call options. Such a trade could at least serve as a suitable hedge on shorts elsewhere in the commodity-related space.
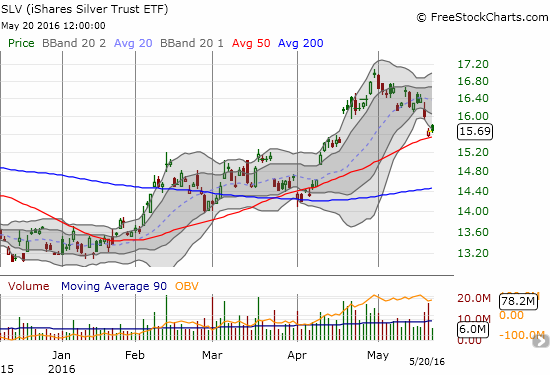
(Anyone else notice the prominence of the 50DMA here?)
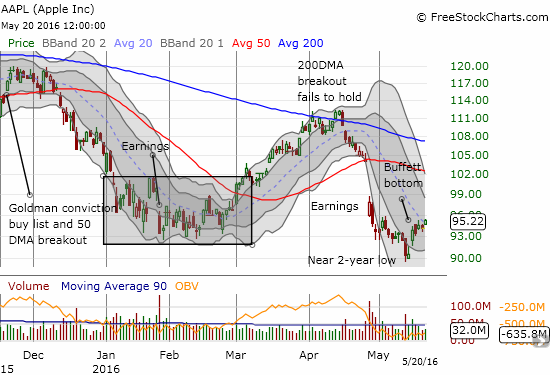
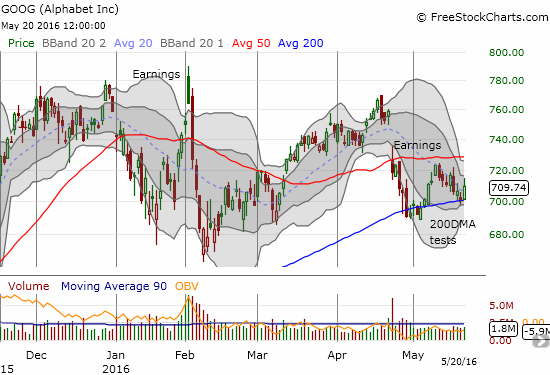
Tech stocks are at an interesting juncture here with the NASDAQ churning below its 50DMA. The big boys like Apple (AAPL), Netflix (NFLX), and Alphabet (GOOG) are not trading in unison even though each showed their own unique strength on Friday. I missed the trade on GOOG bouncing from its 200DMA since my trading bias was bearish. I opened up a speculative put position on NFLX given it traded to the top of the recent range.

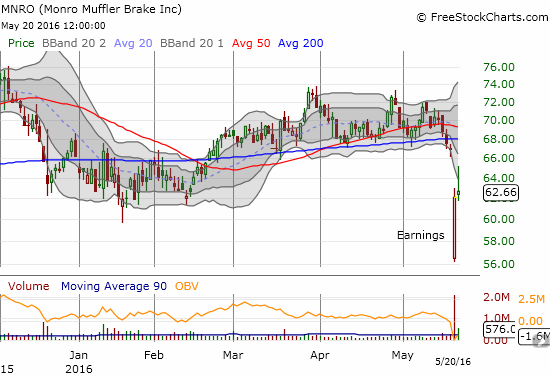
Now if there is anything that should give bulls and buyers cheer, vigorous buying off post-earning sell-offs should. That was the case for Monro Muffler Brake (MNRO). On Thursday, MNRO gapped down 16%, well below its lower-Bollinger Band (BB). Buyers almost immediately stepped in: another demonstration of how good market makers can be at pushing a stock’s open as far as possible after big market-moving news (bad or good). MNRO almost filled the entire gap the next day before fading hard and fast. Despite that setback, I think it is safe to say MNRO has bottomed at least until the next news catalyst.
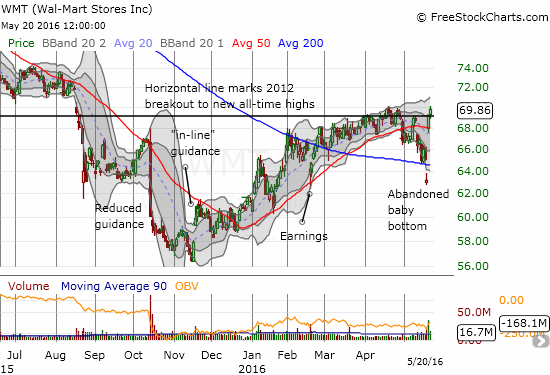
Retail was the punching bag in the previous week. This week ended with Wal-Mart Stores (WMT) providing some much needed relief that might also provide hope for buyers and bulls. I can only assume the tremendous gap up was supported by excessive negativity going into earnings. WMT gapped down on Wednesday going into earnings into what is now a very dramatic abandoned baby bottom. That gap down discouraged me from buying back into WMT even though it was right around the price I last found WMT attractive to trade. The gap down made me expect that I could snatch an even better steal of a position. Anyway, WMT closed the week with a tease. The buyers delivered important follow-through to the post-earnings buying, but the stock faded off a new 9-month high to close exactly even with the last high. Note that my buying interest in WMT is long-term and not subject to my short-term trading bias.
— – —
Reference Charts (click for view of last 6 months from Stockcharts.com):
S&P 500 or SPY
U.S. Dollar Index (U.S. dollar)
EEM (iShares MSCI Emerging Markets)
VIX (volatility index)
VXX (iPath S&P 500 VIX Short-Term Futures ETN)
EWG (iShares MSCI Germany Index Fund)
CAT (Caterpillar).
IBB (iShares Nasdaq Biotechnology).
(Reload page and/or click on the image, if it is not correct. At time of writing, server is having cache issues)
Daily T2108 vs the S&P 500
")
Black line: T2108 (measured on the right); Green line: S&P 500 (for comparative purposes)
Red line: T2108 Overbought (70%); Blue line: T2108 Oversold (20%)
Weekly T2108

*All charts created using freestockcharts.com unless otherwise stated
The charts above are the my LATEST updates independent of the date of this given T2108 post. For my latest T2108 post click here.
Related links:
The T2108 Resource Page
Expanded daily chart of T2108 versus the S&P 500
Expanded weekly chart of T2108
Be careful out there!
Full disclosure: long UVXY call options, long SSO put options, long GLD, long CAT put options and put spread, long SLV