
(T2108 measures the percentage of stocks trading above their respective 40-day moving averages [DMAs]. It helps to identify extremes in market sentiment that are likely to reverse. To learn more about it, see my T2108 Resource Page. You can follow real-time T2108 commentary on twitter using the #T2108 hashtag. T2108-related trades and other trades are occasionally posted on twitter using the #120trade hashtag. T2107 measures the percentage of stocks trading above their respective 200DMAs)
T2108 Status: 57.1%
T2107 Status: 56.8%
VIX Status: 14.7
General (Short-term) Trading Call: bearish
Active T2108 periods: Day #65 over 20%, Day #64 over 30%, Day #61 over 40%, Day #58 over 50% (overperiod), Day #3 under 60% (underperiod), Day #10 under 70%
Commentary
Today feels like last Tuesday with a rally "out of nowhere." Starting to wonder whether $SPY setting up for a long summer of chop.
— Dr. Duru (@DrDuru) May 16, 2016
In the last T2108 Update, I provided a list of reasons for getting more bearish on the market. So of course I was caught completely off guard by the strength of today’s rally. If anything, I would have expected a fade into the close that pulled the S&P 500 (SPY) just under its 50-day moving average (DMA). Instead, buyers stayed defiant and closed out the day near the highs.
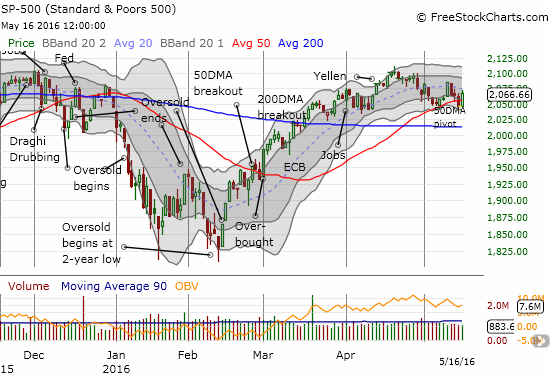
T2108, the percentage of stocks trading above their respective 40DMAs, closed at 57.1% and essentially erased Friday’s loss. T2107, the percentage of stocks trading above their respective 200DMAs, almost reversed Friday’s loss with a close at 56.8%. These moves are encouraging but not quite enough to whiplash me into reversing the change in my trading bias. I will stay unconditionally bearish unless (until?) T2108 gets back to overbought status.
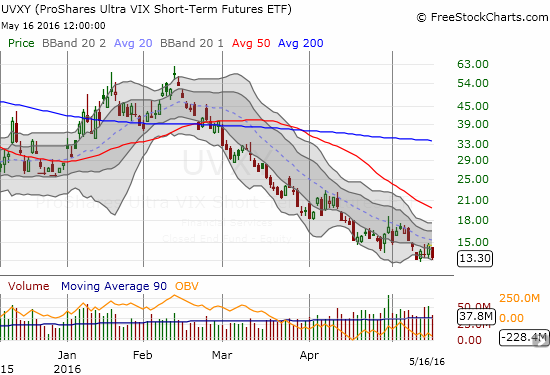
Today’s action did remind me of the benefits of staying patient with positioning. If indeed the market is embarking on an extended period of choppiness, then the market will provide more opportunities to fade rallies than to chase breakdowns. For the day, I proceeded with my action plan going into the morning by scaling into (two) tranches of call options in ProShares Ultra VIX Short-Term Futures (UVXY). The underlying VIX finished the day at 14.7 after failing to hold the 15.35 pivot.

After setting in motion my plan for UVXY, I looked around for fades. My first target was BHP Billiton Limited (BHP) which tried to punch through 50DMA resistance. This short restarts my dynamic pairs trade on iron ore. Next I targeted Baidu (BIDU) which soared an impressive 5.1% on no news (that I could find). My limit order to buy puts filled late in the day. In the last T2108 Update, I noted that U.S. Steel (X) was an excellent candidate to play a quick bounce, but my bearish trading bias prevented me from moving on the idea. As it turned out, X gapped up, soared as much as 9.4%, and ended with a nasty fade to a 1.4% gain on the day. Now if only BIDU had faded like THAT…
The big story of the day was of course Apple (AAPL) and its 3.7% pop. In the last T2108 Update, I wondered aloud when Tim Cook would apply the company’s billions to buy a lasting bottom for shareholders. It looks like Warren Buffett’s billions might be enough to do the trick. Investors reacted wildly on news that Berkshire Hathaway (BRKA)(BRKB) established a stake of 9.8M shares as of the end of Q1 2016. This timing means Buffett’s company was in the red on this position at least when AAPL hit a new 2-year low last week. Buffett is legendary for holding shares for the very, very long-term so no doubt Berkshire is barely noticing the loss.
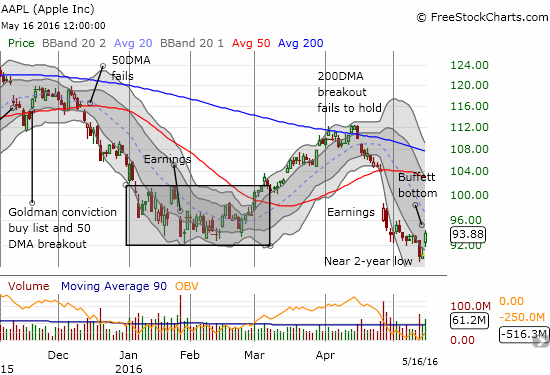
I am guessing Buffett could not care less that Icahn dumped his stake. I am even guessing that Buffett is ready to buy even more AAPL if this Buffett Bottom fails to hold. Given Buffett’s near cult-like status in the investing community, I almost called this T2108 Update “The Buffett Bottom” to pair it with the JP Morgan bottom that marked THE bottom for 2016 and the end of the last oversold period. Alas, I need more than Buffett’s billions to confirm a bottom. However, a breakout from 50/200DMA resistance for the NASDAQ (QQQ) could help push me over. (And yes, AAPL is at the TOP of my buy list whenever I get the bullish bug again).
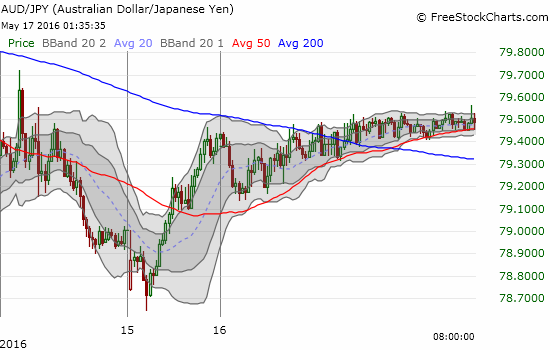
The strangest part of Monday’s rally “out of nowhere” was the complete lack of cooperation from the Australian dollar (FXA) versus the Japanese yen (JPY). AUD/JPY rallied during Asian trading but barely managed to reverse its last dip before U.S. trading. This lackluster trading made me doubt the rally in stocks all day. I use a time-shifted 15-minute chart to show this pattern because at the time of typing, the Australian dollar is experiencing a broad-based rally on the heels of the minutes of the Reserve Bank of Australia (talk about a fade-worthy rally!)
— – —
Reference Charts (click for view of last 6 months from Stockcharts.com):
S&P 500 or SPY
U.S. Dollar Index (U.S. dollar)
EEM (iShares MSCI Emerging Markets)
VIX (volatility index)
VXX (iPath S&P 500 VIX Short-Term Futures ETN)
EWG (iShares MSCI Germany Index Fund)
CAT (Caterpillar).
IBB (iShares Nasdaq Biotechnology).
(Reload page and/or click on the image, if it is not correct. At time of writing, server is having cache issues)
Daily T2108 vs the S&P 500
")
Black line: T2108 (measured on the right); Green line: S&P 500 (for comparative purposes)
Red line: T2108 Overbought (70%); Blue line: T2108 Oversold (20%)
Weekly T2108

*All charts created using freestockcharts.com unless otherwise stated
The charts above are the my LATEST updates independent of the date of this given T2108 post. For my latest T2108 post click here.
Related links:
The T2108 Resource Page
Expanded daily chart of T2108 versus the S&P 500
Expanded weekly chart of T2108
Be careful out there!
Full disclosure: long put options on BIDU, short BHP, long UVXY call options, net short the Australian dollar