
(T2108 measures the percentage of stocks trading above their respective 40-day moving averages [DMAs]. It helps to identify extremes in market sentiment that are likely to reverse. To learn more about it, see my T2108 Resource Page. You can follow real-time T2108 commentary on twitter using the #T2108 hashtag. T2108-related trades and other trades are occasionally posted on twitter using the #120trade hashtag. T2107 measures the percentage of stocks trading above their respective 200DMAs)
T2108 Status: 44.5%
T2107 Status: 48.7%
VIX Status: 15.8
General (Short-term) Trading Call: Neutral. Assuming market is back to chopping around.
Active T2108 periods: Day #109 over 20%, Day #68 above 30%, Day #12 above 40% (overperiod), Day #2 under 50% (underperiod), Day #15 under 60%, Day #179 under 70%
Reference Charts (click for view of last 6 months from Stockcharts.com):
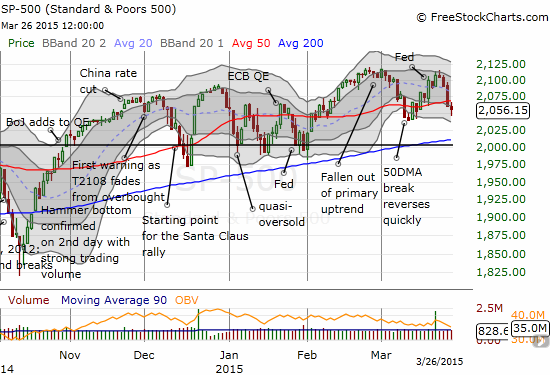
S&P 500 or SPY
SDS (ProShares UltraShort S&P500)
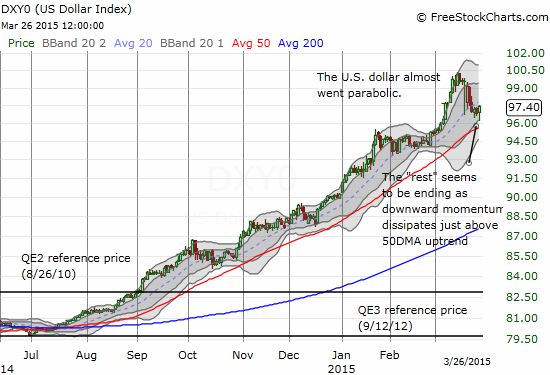
U.S. Dollar Index (volatility index)
EEM (iShares MSCI Emerging Markets)
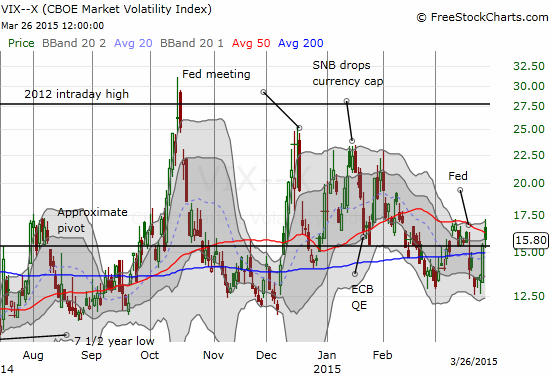
VIX (volatility index)
VXX (iPath S&P 500 VIX Short-Term Futures ETN)
EWG (iShares MSCI Germany Index Fund)
CAT (Caterpillar).
Commentary
It looks like the market is back to a chopfest.
The S&P 500 (SPY) reversed all its post-Fed gains yesterday (Wednesday, March 25). The selling on the index followed through on Thursday and confirmed another breakdown from the 50-day moving average (DMA). T2108 has plunged all the way from a countdown to overbought status to a convincing end of upward momentum. T2108 closed at 44.5%, down about 13 percentage points in just two days. The volatility index, the VIX, has surged right through the 15.35 pivot although today’s pop was almost entirely faded.
Given this setup looks like a return to a chopfest, my overall trading call remains neutral (of course I wish I had stayed firmly bearish ahead of the recent 2-day breakdown!). On Wednesday I successfully flipped call options on ProShares Ultra VIX Short-Term Futures (UVXY). I used the initial gap up on Thursday to close out my call options from last week that surprisingly went from the pits to a tremendous gain literally overnight. I bought right back in near the close in anticipation of more (rising) volatility in coming days. This ends my T2108/Fed related trades from last week as I rushed to salvage some value out of my losing put options on ProShares Ultra S&P500 (SSO) which expire on Friday.
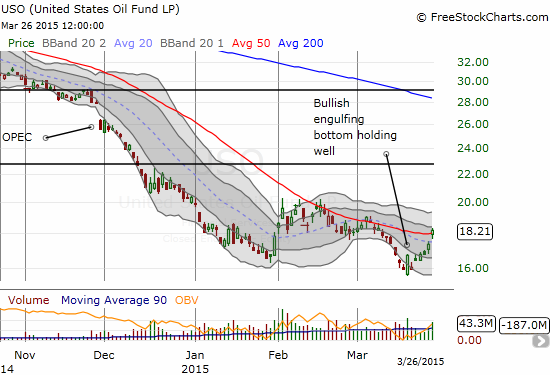
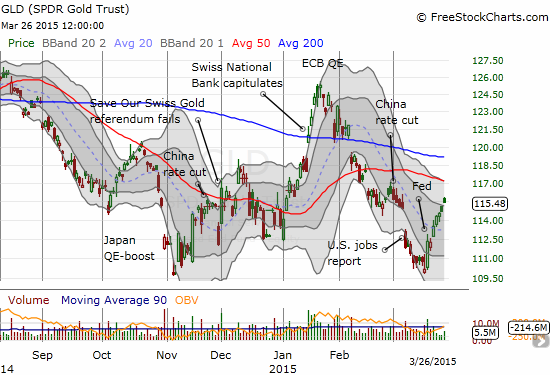
Now while the S&P 500 reversed its post-Fed gains and the VIX reversed its post-Fed losses, oil (USO) and gold (GLD) have maintained their post-Fed momentum. I think this divergence sets up an interesting tension that I think will get resolved with oil and gold reverting as well.
In particular, oil seems to be supported by recent weakness in the U.S. dollar (UUP) and fresh tensions in the Middle East, this time in Yemen. Anyone who even casually tracks the oil market knows that these conflagrations tend to have ephemeral impact on the oil market. Yet, traders can use the rapid rise in fear and tensions to whip the market around. Despite my skepticism, I think the recent bottoming action in USO that I pointed out last week will continue to hold. With a chopfest from and center in my brain, I used the run-in with the declining 50DMA, to sell my USO call options. I then took some of that profit to dive right into put options.
The U.S. dollar’s rest from near-parabolic trading conditions seems to be coming to an end. A bounce here will hurt oil and certainly pressure gold back down.
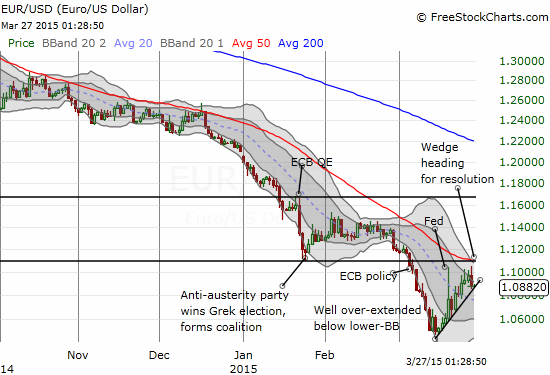
As the last chart above shows, the tension building on the U.S. dollar’s direction is enhanced by the euro reaching a critical technical juncture against the U.S. dollar. I think this wedging pattern will get resolved to the downside given the euro’s inability to break through overhead resistance after repeated attempts. Also see my description of the rapid dollar squeeze that happened post-Fed last week for closer evidence of resistance holding firm.
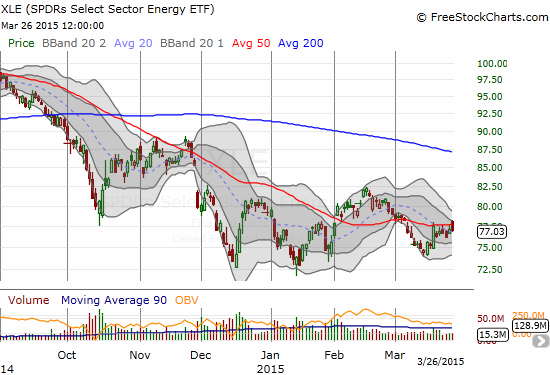
A reversal in oil should complete the failure of the Energy Select Sector SPDR ETF (XLE) to make a convincing breakout from 50DMA resistance. Even though Direxion Daily Energy Bear 3X ETF (ERY) continues to make lower highs, I nibbled on some shares to play XLE’s likely failure at resistance. I do not plan to hold this position for long.
The chopfest has made me take profits a little faster than usual on winning trades. I have learned the hard way as I assumed momentum had finally taken root only to find a reversal awaiting me instead in the blink of an eye. Keep that in mind when reviewing my remaining charts!
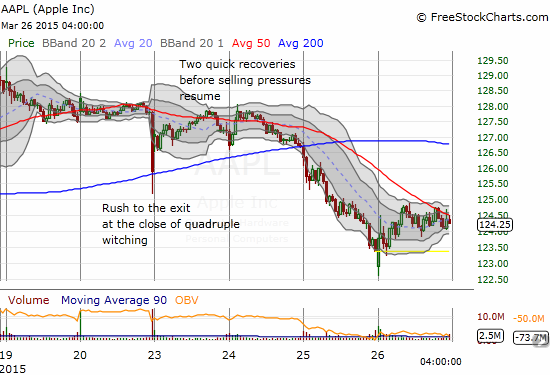
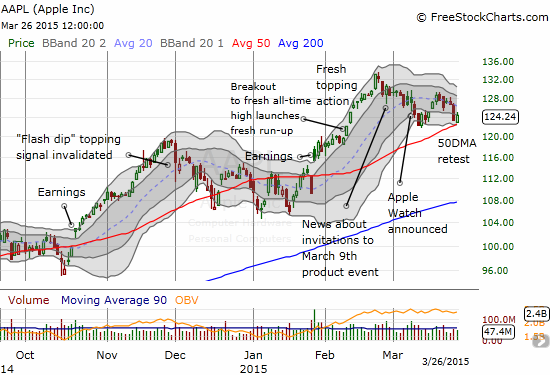
I have not looked at Apple (AAPL) in a while – the technicals are looking poorer and poorer (short-term of course). I appreciate the spirited and nearly predictable bounce from 50DMA support. However, downward momentum from all-time highs and the Apple Watch announcement are just too persistent overall. As an excellent example, I provide a 15-minute chart to show how buyers quickly carried AAPL into a complete recovery from last Friday’s quadruple-witching inspired take down…and then sellers quickly took over again to set-up the 50DMA test. A break of 50DMA support puts a near reversal of post-earnings gains into play.
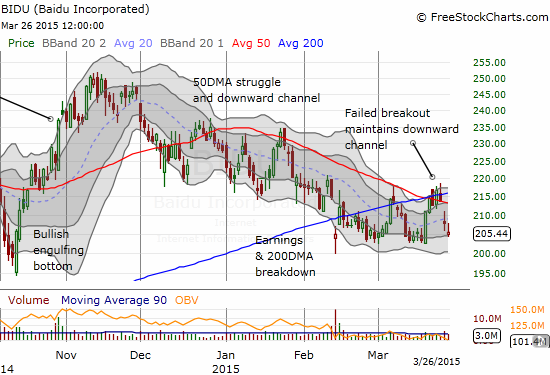
Baidu (BIDU) could not hold its breakout in this chopfest. It is right back to the bottom of its downward channel. I finally bought some call options on the assumption that the stock will eventually (and soon) find its way right back to the top of the channel.
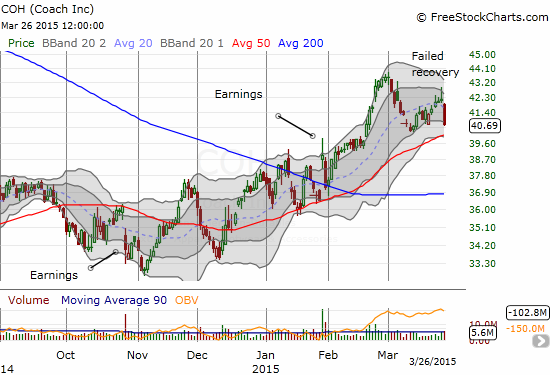
My trade on Coach (COH) was looking like genius until it all fell apart today. Now, COH looks like it has reached the end of its recovery momentum…leaving me high and dry.
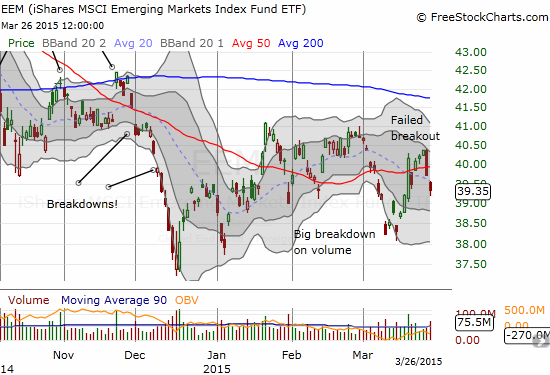
The iShares MSCI Emerging Markets (EEM) reversed so badly that my put options are back in play. Given the chopfest, I wasted no time in reloading on call options to re-establish my favorite hedged trade.
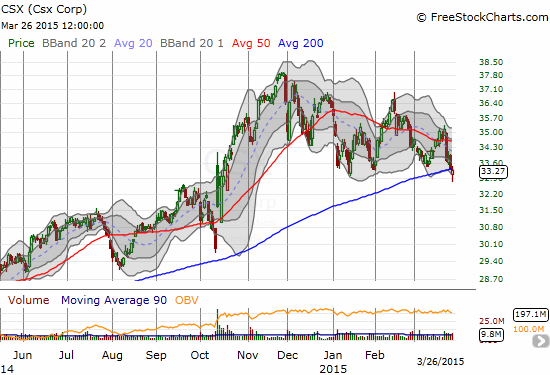
Transports are getting into trouble. CSX Corp. (CSX) is at a VERY critical juncture. I have played CSX long on dips, but this time I am going to be patient and wait for CSX’s next move. The current 200DMA breakdown looks ominous.
Daily T2108 vs the S&P 500
")
Black line: T2108 (measured on the right); Green line: S&P 500 (for comparative purposes)
Red line: T2108 Overbought (70%); Blue line: T2108 Oversold (20%)
Weekly T2108

*All charts created using freestockcharts.com unless otherwise stated
The T2108 Resource Page
Expanded daily chart of T2108 versus the S&P 500
Expanded weekly chart of T2108
Be careful out there!
Full disclosure: long AAPL call and put options, long COH calls, long EEM calls and puts, long GLD, long USO puts, long BIDU calls, net long the U.S. dollar, long ERY