
(T2108 measures the percentage of stocks trading above their respective 40-day moving averages [DMAs]. It helps to identify extremes in market sentiment that are likely to reverse. To learn more about it, see my T2108 Resource Page. You can follow real-time T2108 commentary on twitter using the #T2108 hashtag. T2108-related trades and other trades are sometimes posted on twitter using the #120trade hashtag. T2107 measures the percentage of stocks trading above their respective 200DMAs)
T2108 Status: 29.7%
T2107 Status: 39.6%
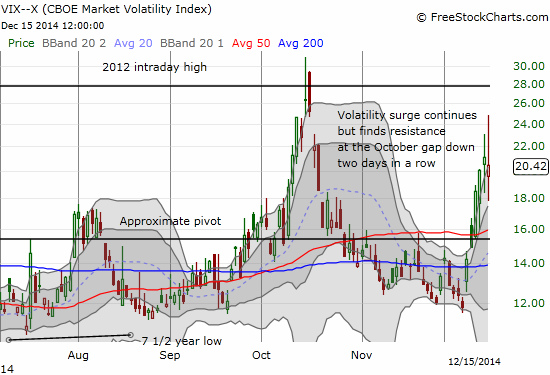
VIX Status: 20.4 (actually DROPPED 3.1%)
General (Short-term) Trading Call: Fresh buys only on close above 50DMA or oversold conditions
Active T2108 periods: Day #40 over 20%, Day #38 over 30%, Day #2 under 40% (underperiod), Day #4 under 50%, Day #8 under 60%, Day #110 under 70%
Reference Charts (click for view of last 6 months from Stockcharts.com):
S&P 500 or SPY
SDS (ProShares UltraShort S&P500)
U.S. Dollar Index (volatility index)
EEM (iShares MSCI Emerging Markets)
VIX (volatility index)
VXX (iPath S&P 500 VIX Short-Term Futures ETN)
EWG (iShares MSCI Germany Index Fund)
CAT (Caterpillar).
Commentary
The trading day had a promising start with the expected bounce coming right on schedule at the open. That push lasted all of five minutes or so before sellers went to work again.
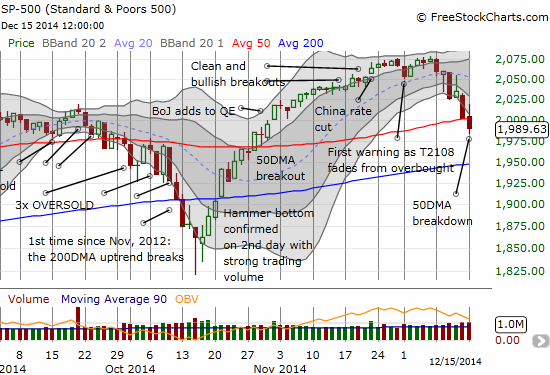
This breakdown is of course a bearish development and highlights the warnings that have preceded this point. However, it is not likely a time to chase the market lower. T2108 is now closing in on oversold conditions (less than 20%) with a close at 29.7%. Shorts should already know what positions they want to start closing and locking in some profits. For bulls, the trigger to buy does not come until the S&P 500 manages to close above the 50DMA and continues higher and/or T2108 hits oversold conditions below 20%. Overall, the trading rules are pretty simple here.
Volatility was NOT simple. Despite the continued sell-off and 50DMA breakdown on the S&P 500, volatility managed to close LOWER on the day. This combination seemed to provide a ringing endorsement of my positioning on Friday to fade volatility but NOT to buy the S&P 500 (SPY) on the assumption that the 50DMA would hold as support.
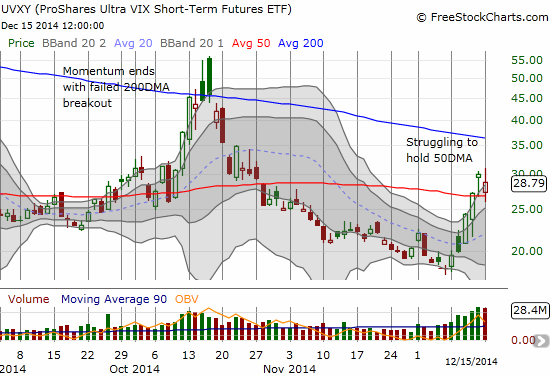
The swings in the volatility products gave me a rare double trading opportunity. As soon as I saw ProShares Short VIX Short-Term Futures (SVXY) falter at its highs on the day, I sold. I had no need to hang on given I already have put options in play on ProShares Ultra VIX Short-Term Futures (UVXY). I set a limit order to buy at lower prices ($60) and eventually it got filled. After watching SVXY continue as low as $58.10, I was very ready to sell again when SVXY quickly rushed back to $62 for a brief moment. I put in yet another limit order (at $59 this time), but it did not get filled. I am hoping for at least one more shot at lower prices for SVXY ahead of Wednesday’s Fed meeting. Otherwise, I just ride the UVXY puts.
Two quick trading updates before some the final set of trading charts. I did buy some Digital River (DRIV) but had to buy a small number shares as the options proved too expensive (huge bid/ask spreads) to get a fair price on call options. I decided to leave Conns (CONN) alone; sure enough, the hammer bottom has already been violated by a strong resumption of selling.
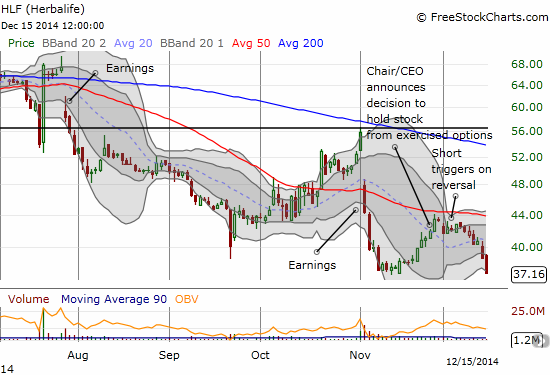
On November 27, I laid out a trading plan for Herbalife (HLF). I was mainly focused on the bearish trading opportunity. Sure enough, HLF triggered just days afterward with a complete reversal of the continuation rally catalyzed apparently by the CEO’s decision to hold stock granted through exercised options. The market rewarded his kindness with pain. After hanging in there for a few more days, HLF has dropped nearly in a straight line since December 5th. The selling has accelerated in percentages lost but volume has not increased. I was close to selling my put options at the close but decided to hang on at least one more day to see whether support at November’s (18-month) low holds. The puts expire on Friday, so I have almost no more wiggle room (no way I want to short shares in this volatile and controversial stock…even if shares are available for shorting).
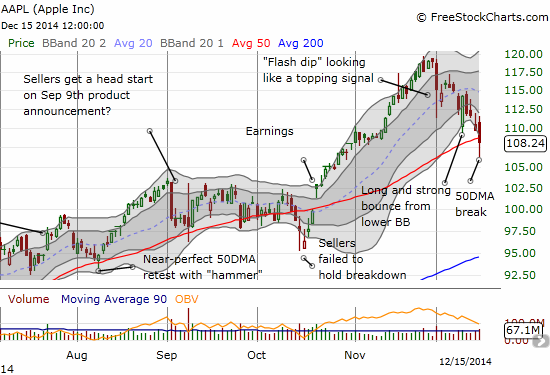
Apple (AAPL) made a critical breakdown today, joining the S&P 500 in a break of its 50DMA. Like the S&P 500, AAPL had a nice opening and my call options going into the typical Monday rally were looking good. In a blink, the tables were turned upside down, and I found myself with additional options a ta lower strike and lower price point. (Per the Apple Trading Model (ATM), I like buying positions at a discount to the projected close). My second tranche of call options were triggered as AAPL plunged as low as $106.35 and a 3.1% loss. AAPL now has a well-established downtrend from its last all-time high, and the break of the 50DMA confirms it. If buyers do not step up soon, I have to assume that Apple’s upward momentum has finally come to an end. For Tuesday’s trading, the ATM projects a gain from today’s close but a fade from the open. Recall that I put more weight on the projected move from the close. IF AAPL manages to gap up, I will certainly sell my call options, but I am not likely to execute the put option side of the trade given AAPL will have reclaimed the 50DMA.
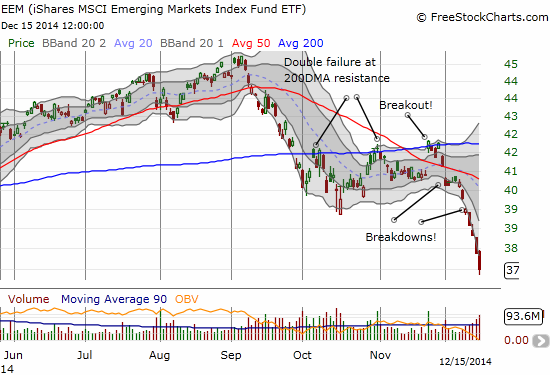
Finally, emerging markets are looking as ugly as ever. I sold my latest round of put options on iShares MSCI Emerging Markets (EEM) on Friday. I thought EEM was extended and decided to just take the profits. EEM lost another 1.4% today, leaving me with another set of call options that are likely to expire (next month) worthless as the momentum is clearly still pointed to the downside. At least I was correct that one way or another EEM was due for a big move, making a straddle or a strangle options play potentially very lucrative for low risk. Note in the chart below that EEM is accelerating to the downside with emphasis from the increasing trading volume. A washout is likely on the horizon, so I am watching more closely than ever.
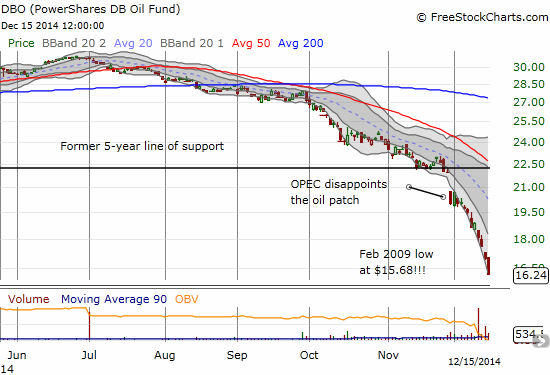
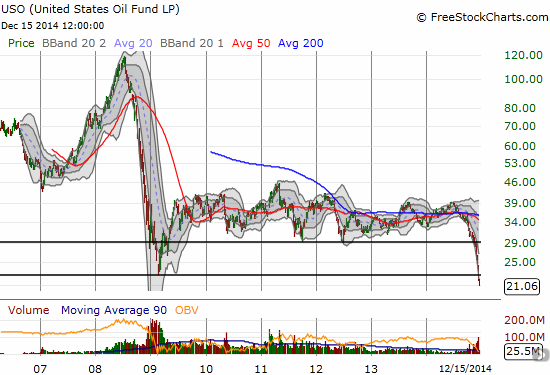
Finally, I feel compelled to post the latest chart on oil. This downward slide is historic. It continues to remind me of the dotcom bubble blow-up. Having lived through that as a relative new investor and even newer (meaning GREEN!) trader, I can be so thankful that I did not buy into the shale oil boom. These lessons get learned over and over again. Perhaps a little ironically, the OPEC decision is now turning into an obvious selling/shorting point. Oil has accelerated to the downside ever since then. DBO is now down 25% just in these last two weeks!
Daily T2108 vs the S&P 500
")
Black line: T2108 (measured on the right); Green line: S&P 500 (for comparative purposes)
Red line: T2108 Overbought (70%); Blue line: T2108 Oversold (20%)
Weekly T2108

*All charts created using freestockcharts.com unless otherwise stated
The T2108 Resource Page
Expanded daily chart of T2108 versus the S&P 500
Expanded weekly chart of T2108
Be careful out there!
Full disclosure: long UVXY put options, long AAPL call options, long HLF put options