
(T2108 measures the percentage of stocks trading above their respective 40-day moving averages [DMAs]. It helps to identify extremes in market sentiment that are likely to reverse. To learn more about it, see my T2108 Resource Page. You can follow real-time T2108 commentary on twitter using the #T2108 hashtag. T2108-related trades and other trades are sometimes posted on twitter using the #120trade hashtag. T2107 measures the percentage of stocks trading above their respective 200DMAs)
T2108 Status: 26.9%
T2107 Status: 38.3%
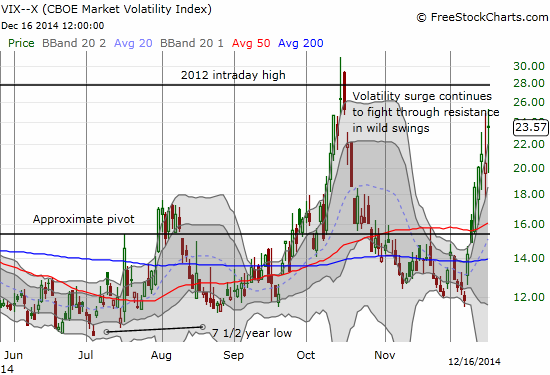
VIX Status: 23.6 (only THREE higher closes since summer, 2012 – the other three were of course at the mid-October bottom)
General (Short-term) Trading Call: Fresh buys only on close above 50DMA or oversold conditions
Active T2108 periods: Day #41 over 20%, Day #2 under 30% (underperiod), Day #3 under 40%, Day #5 under 50%, Day #9 under 60%, Day #111 under 70%
Reference Charts (click for view of last 6 months from Stockcharts.com):
S&P 500 or SPY
SDS (ProShares UltraShort S&P500)
U.S. Dollar Index (volatility index)
EEM (iShares MSCI Emerging Markets)
VIX (volatility index)
VXX (iPath S&P 500 VIX Short-Term Futures ETN)
EWG (iShares MSCI Germany Index Fund)
CAT (Caterpillar).
Commentary
If only today’s trading action were reversed.
The S&P 500 opened down with the selling lasting only 5 minutes – almost the exact opposite of the previous day where 5 minutes of buying was met by selling until lunchtime on the East Coast. This time around, buyers jumped right into the fray and managed to take the S&P 500 (SPY) above its 50DMA. The peak came right before lunch, and it was all downhill from there. The end result was a -0.9% price performance, an S&P 500 further below its lower-Bollinger Band and further below the 50DMA, and a T2108 closing at 26.9%…creeping ever closer to oversold conditions.
Reversal from lows took S&P 500 just over 50DMA. Not expecting sellers to give up THAT easily. Watching the close. $SPY $CAT on watch.
— Dr. Duru (@DrDuru) December 16, 2014
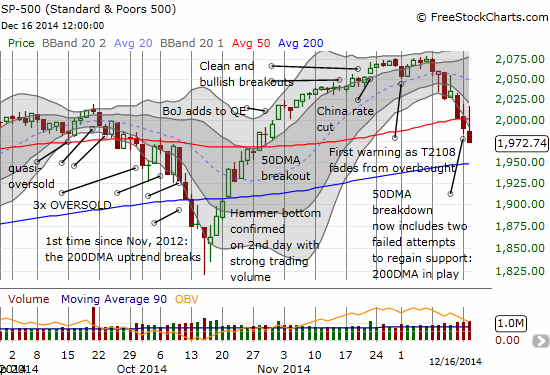
Without oversold conditions, I still refrained from buying call options on ProShares Ultra S&P500 (SSO). The lack of a close above the 50DMA means that I will not buy into any strength on Wednesday either. Even with a Fed meeting coming in the middle of what is supposed to be a seasonally strong period, the S&P 500 looks all set to retest its 200DMA. At the current rate, such a retest SHOULD occur with oversold conditions. Such a combination would mark a great buying opportunity.
The days gyrations also meant volatility was all over the place. Given I missed out on buying back into ProShares Short VIX Short-Term Futures (SVXY) yesterday, I immediately pounced at the open. The subsequent rise surprised me, and I locked in profits (fortuitously near the peak) – I already have puts options on ProShares Ultra VIX Short-Term Futures (UVXY) in play. Just like yesterday I set a lower limit order after the sale. This time, it was filled…and eventually I lost two more points on the position. (I had a VERY similar experience trading Apple (AAPL) options today but I simply do not have time to get into the details!) The volatility index, the VIX, is now putting on an impressive show of resilience ahead of the Fed meeting.
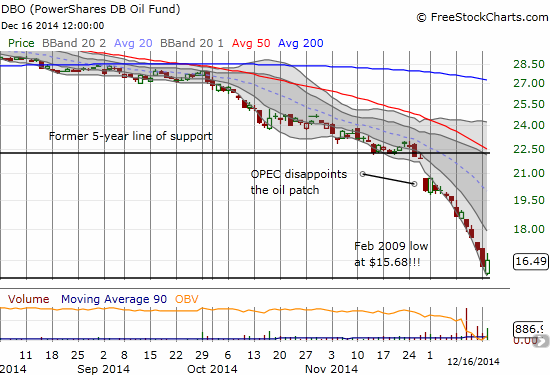
The narrative that has become embedded in media headlines is that the market is now declining because of or along with oil. Funny thing happened on the way down today…oil made a major reversal and closed UP in a rare display of strength.
The entire oil patch was hopping with large upward moves…of course just mirror images of prior large DOWNWARD moves. For example, here is Linn Energy, LLC (LINE), an oil company that I am watching closely only because an author on Seeking Alpha made a spirited defense of the company. Amazing how many articles I have seen throughout this sell-off arguing for bottoms and buys of a lifetime; it has made me think that a bottom is still very far off! For a great example, you can just check out the headlines for LINE articles.
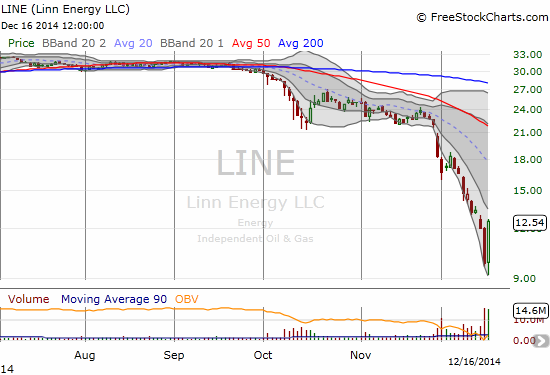
Nothing says “collapse” better than a chart like this!
While oil was finally getting some buyer interest, Google (GOOG) experienced a MAJOR exit. The stock sliced right through $500 and closed with a 3.6% loss…on no fresh headlines I could discern. So not only has GOOG completed a post-earnings roundtrip but also is at a fresh 52-week low. The stock even looks ready to fill its major gap up from October, 2013 earnings!!!
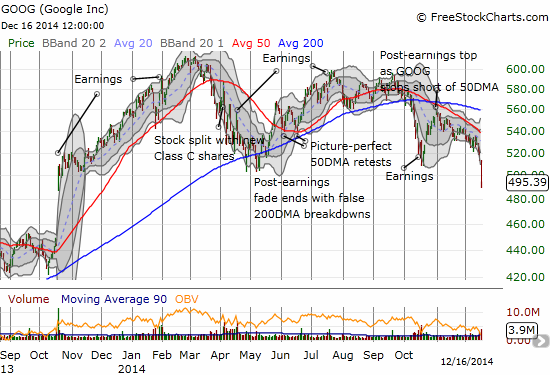
Of all the non-commodity related breakdowns I have seen, this one is perhaps one of the most troubling. It will be VERY hard for GOOG to recover from this. I bought some speculative calls just on the likelihood for a deadcat bounce back to the lower-Bollinger Band.
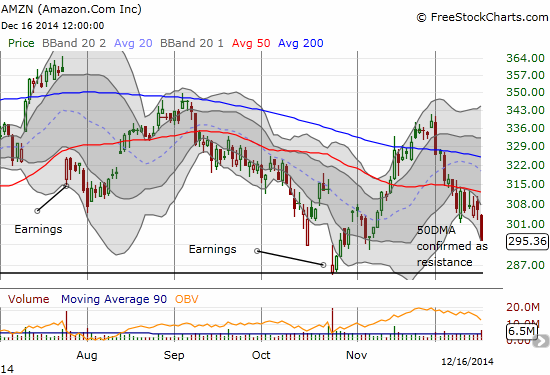
Amazon.com (AMZN) also suffered a similar loss that confirms 50DMA resistance with an exclamation mark. Given GOOG’s major breakdown, I am doubting AMZN will find much support at its post-earnings low. Given the bearish outlook I noted last week, I came into this continuation selling prepared with put options.
Of any and all charts I saw today, Russia’s drama was the most spectacular. It looks like the country is headed for a second economic collapse in less than 20 years.
Commented on StockTwits: So DESPITE the Russian rate hike to 17%, $USDRUB STILL gained as much as 25% from Mon c… http://t.co/GtaQwrSAZS
— Dr. Duru (@DrDuru) December 16, 2014
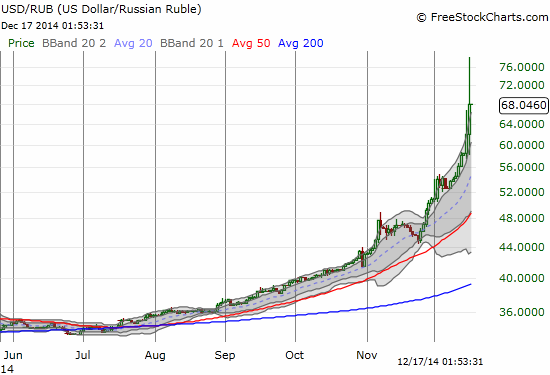
The Russian ruble lost as much as 25% against the dollar from Monday’s close of U.S. trading. This happened in the wake of a second massive rate hike that sent Russian rates to 17% from last week’s hike to 10.5%. The currency did eventually reverse off the extremes. The action was just as dramatic in Russian stock indices with Market Vectors Russia ETF (RSX) managing to cling to a rare gain on the day.
Manic turn-around for Russia: $RSX. But this is the stuff of which bottoms are made. On watch!
— Dr. Duru (@DrDuru) December 16, 2014
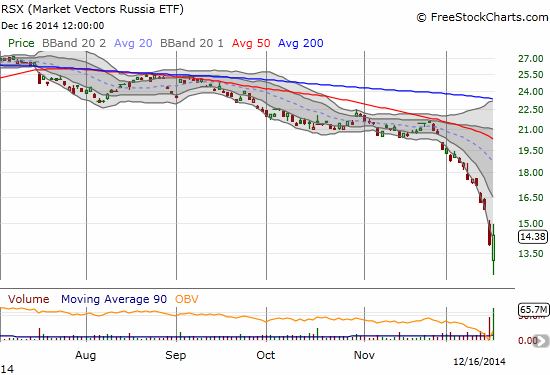
Talk about a panicked stampede from the exits!
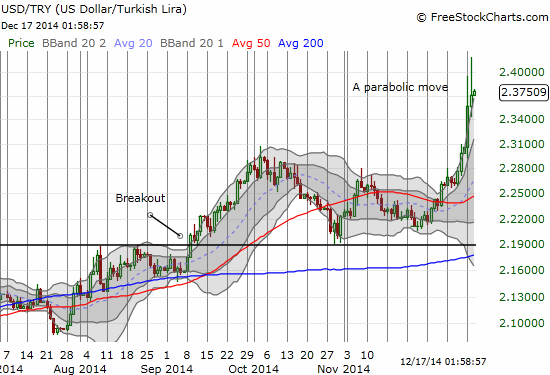
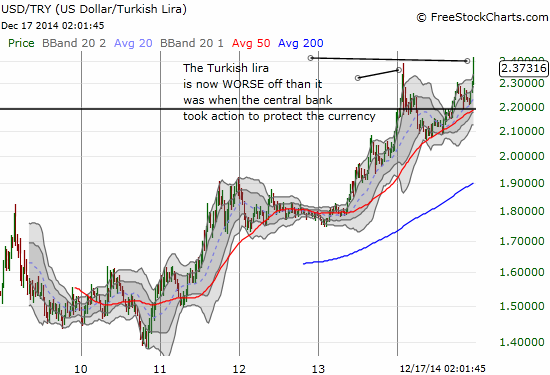
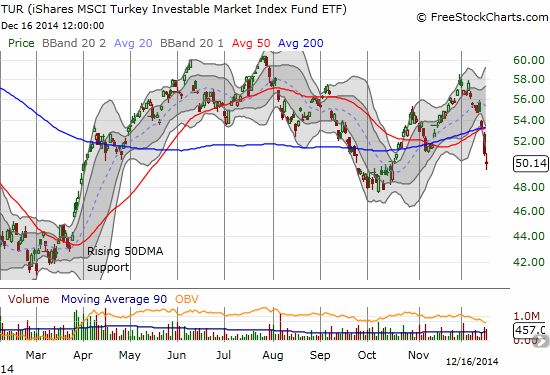
It seems the ruble’s rapid move disrupted currency trading in nearby Turkey as well. In fact, Russia’s desperate attempt to protect the value of its currency reminds me of how we started the year with the Turkish central bank moving aggressively with a rate hike to protect the Turkish Lira. The BIG difference is that the rate hike in Turkey immediately sent the currency into recovery. The difference now is that the index of Turkish stocks is not completely collapsing along with the parabolic weakness in the currency.
Putting all the pieces together, we should clearly understand that major risks abound, and they are making their voices heard in many places all at once. These kinds of extreme moves usually signal a run is closer to its end than its beginning. However, on the way to the end can still deliver some pain. Major trading models and investing plans are getting disrupted by these wild swings and extreme moves. Forced selling is going on. Stops are getting hit and causing trading whiplash. It is probably like near chaos at many trading desks as operations are holding on for dear life just to get through 2014.
For the little retail investor, you can be thankful that it is easy to simplify your routine and stick strictly to time-tested trading rules. More than ever, an indicator like T2108 is critical for navigating these choppy waters. My bottom-line remains that fresh buys on the S&P 500 should wait until 1) T2108 hits oversold, preferably on a retest of major support (like the 200DMA) and/or a large spike upward in volatility, and/or 2) the S&P 500 shows strength with a confirmed breakout above its 50DMA.
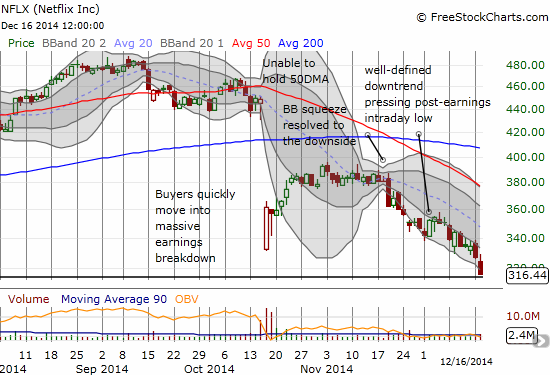
I conclude with the continued breakdown in Netflix (NFLX). Tuesday’s plunge close to the 2014 low closed out my latest short position on the stock (a put spread).
I also closed out of my Herbalife (HLF) puts as the stock failed to continue lower on the day.
Daily T2108 vs the S&P 500
")
Black line: T2108 (measured on the right); Green line: S&P 500 (for comparative purposes)
Red line: T2108 Overbought (70%); Blue line: T2108 Oversold (20%)
Weekly T2108

*All charts created using freestockcharts.com unless otherwise stated
The T2108 Resource Page
Expanded daily chart of T2108 versus the S&P 500
Expanded weekly chart of T2108
Be careful out there!
Full disclosure: long UVXY put options, long AAPL call options, long SVXY shares, long GOOG call options, long AMZN put options
I am a 75 year old trader. I only follow 10 people on Twitter and have never tweeted. I read your T2108 first thing every morning. Your work is terrific, thanks. Clem Gunn
Thanks for reading, Clem! And thanks for the kudos!