
(T2108 measures the percentage of stocks trading above their respective 40-day moving averages [DMAs]. It helps to identify extremes in market sentiment that are likely to reverse. To learn more about it, see my T2108 Resource Page. You can follow real-time T2108 commentary on twitter using the #T2108 hashtag. T2108-related trades and other trades are sometimes posted on twitter using the #120trade hashtag. T2107 measures the percentage of stocks trading above their respective 200DMAs)
T2108 Status: 35.8%
T2107 Status: 41.9%
VIX Status: 21.1 (5.0% increase after 8.4% and 24.5% increases on the previous two days)
General (Short-term) Trading Call: Hold. BIG caveats listed below.
Active T2108 periods: Day #39 over 20%, Day #37 over 30%, Day #1 under 40% (underperiod; ends 33 days over 40%), Day #3 under 50% (underperiod), Day #7 under 60%, Day #109 under 70%
Reference Charts (click for view of last 6 months from Stockcharts.com):
S&P 500 or SPY
SDS (ProShares UltraShort S&P500)
U.S. Dollar Index (volatility index)
EEM (iShares MSCI Emerging Markets)
VIX (volatility index)
VXX (iPath S&P 500 VIX Short-Term Futures ETN)
EWG (iShares MSCI Germany Index Fund)
CAT (Caterpillar).
Commentary
Thursday’s rare combination of a surging volatility index, the VIX, and a positive close for the S&P 500 (SPY) resolved into continuation selling on Friday. The 1.6% loss for the S&P 500 took the index right to its 50DMA. This plunge also happened to completely reverse the gains from the Oct 31st rally inspired by a QE-boost from the Bank of Japan.
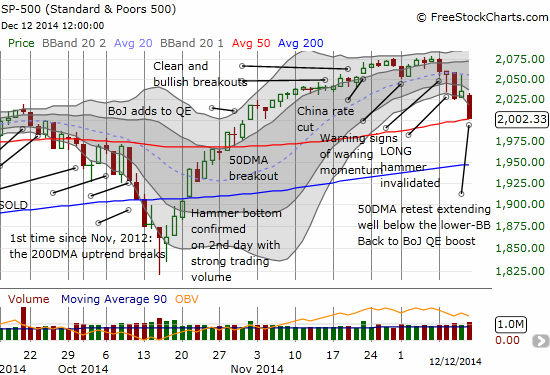
Anyone reading my warnings since T2108 pulled away from “almost overbought” should not be surprised by this retest of the 50DMA even though I could not definitively say the retest was in play until Wednesday’s selling.
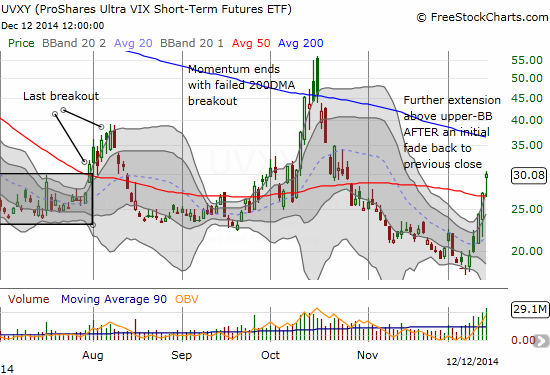
Now, we stay on the lookout for a bounce for several reasons. First of all, the S&P 500 is extended well below its lower-BB on the 50DMA retest. That alone produces a bounce candidate. Second, the VIX has surged again well above its upper-Bollinger Band (BB). As the VIX retested the bottom of the October gap, I immediately added to my latest put options on ProShares Ultra VIX Short-Term Futures (UVXY) and even added into the mix some shares in ProShares Short VIX Short-Term Futures (SVXY). I was encouraged to see the VIX pullback right on cue.
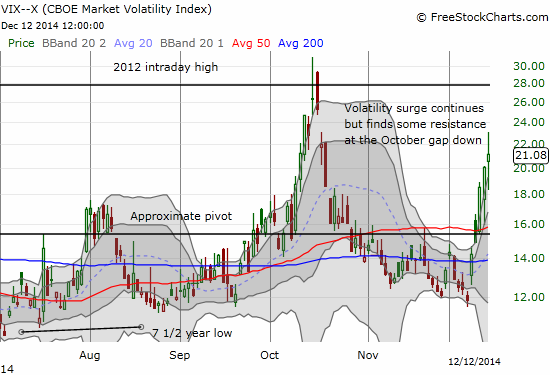
What I *cannot* project is a sustained bounce. I would do so if T2108 was deep in oversold territory (below 20%). Adding to the fireworks is the last Federal Reserve meeting of the year. Even if the S&P 500 does not put on an impressive bounce, I strongly expect volatility to implode (or at least decline significantly) as the Fed attempts to manage fear back down. And even if THAT is not enough, options expiration on Friday and the prospects of a Santa Claus rally still tip the balance toward a volatility implosion going into year-end.
While we wait for things to play out and the drama to unfold, there are of course plenty of charts offering interesting trades.
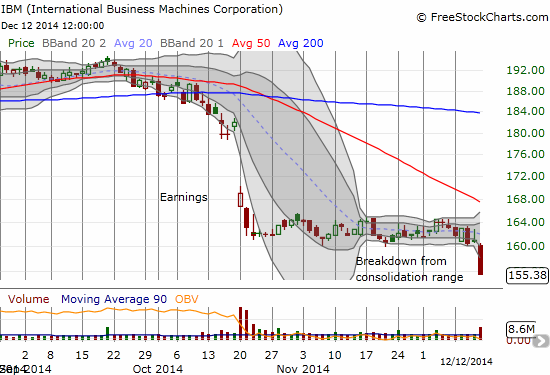
International Business Machines Corporation (IBM) has apparently started a fresh leg downward. This is VERY bearish and makes IBM a fade on rallies. It is of course dangerous to chase it downward while it is below the lower-BB. The plunge resolves the churn during the consolidation that followed an ugly post-earnings gap down. I have not written about IBM in a while; I should have officially taken it off the “buy list” after October’s monster post-earnings gap.
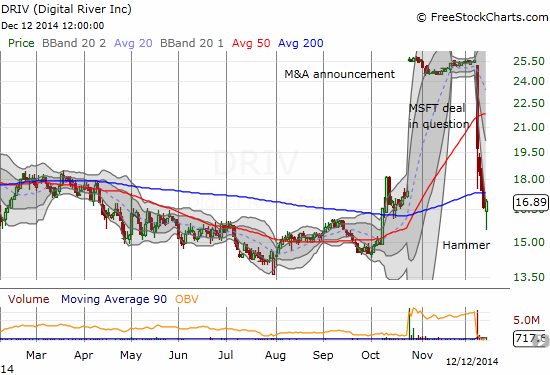
On October 23rd, Digital River (DRIV) announced a private investor group would acquire the company for $26/share. On December 8th, the company admitted in an SEC filling the following:
“Digital River, Inc. (the “Company”) today announced that it has granted Microsoft Corporation (“Microsoft”) an extension from December 1, 2014 to December 19, 2014 as the deadline by which Microsoft is required to provide prior notice to the Company of its decision as to whether to elect to extend the expiration date of the Microsoft Operations Digital Distribution Agreement between the Company and Microsoft, dated September 1, 2006, as amended to date.”
DRIV immediately fell 23% on the day. It managed to bounce off its 200DMA in a classic move with an over-extension below the lower-BB. The selling continued until a hammer pattern on Friday. This selling pushed the stock past the gap created by the M&A deal. I like this situation for a speculative buy, and I am hoping to get that opportunity on Monday. If DRIV resolves its issues with MSFT, suddenly, this should be a $26 stock again. If DRIV cannot resolve the issues, there must still be a chance that the investor group will still acquire DRIV. Perhaps the price of the deal drops to account for the loss of business, but that price should NOT be where the stock sat before the announcement. I like options for this trade of course so that losses are automatically capped.
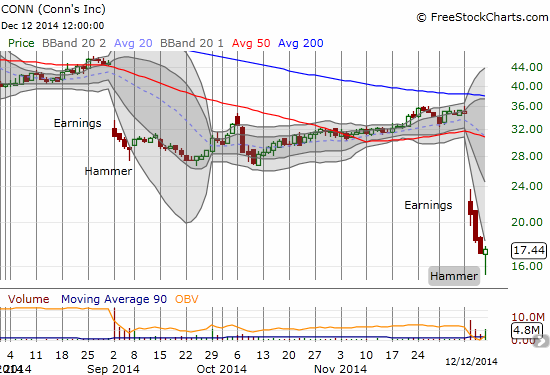
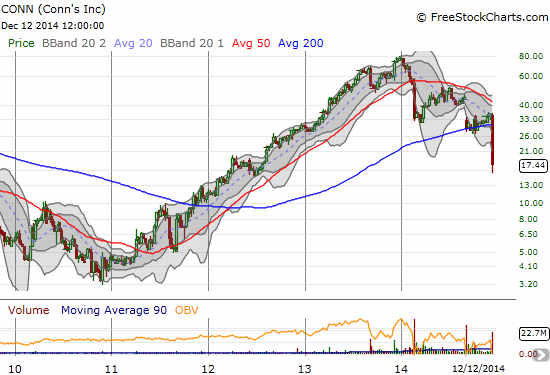
Electronics retailer Conns Inc. (CONN) was on an incredible 3-year run going into 2014. This year has provided the proverbial brick wall. Months ago, CONN finished reversing all its gains from 2013. It is now working on 2012’s gains. The catalyst last week was another disastrous earnings announcement. I like CONN here as a deadcat bounce from the hammer pattern that finally showed up on Friday. The tail of the hammer provides a definitive point for a stop-loss. I like the prospects of the dead-cat bounce not just because of the hammer but also because the two previous gaps down marked the coming (short-term) end of selling pressure. I am expecting this episode to be more of the same. (I have not yet decided whether to take on the risky trade yet though!)
Daily T2108 vs the S&P 500
")
Black line: T2108 (measured on the right); Green line: S&P 500 (for comparative purposes)
Red line: T2108 Overbought (70%); Blue line: T2108 Oversold (20%)
Weekly T2108

*All charts created using freestockcharts.com unless otherwise stated
The T2108 Resource Page
Expanded daily chart of T2108 versus the S&P 500
Expanded weekly chart of T2108
Be careful out there!
Full disclosure: long UVXY put options, long SVXY shares