
(T2108 measures the percentage of stocks trading above their respective 40-day moving averages [DMAs]. It helps to identify extremes in market sentiment that are likely to reverse. To learn more about it, see my T2108 Resource Page. You can follow real-time T2108 commentary on twitter using the #T2108 hashtag. T2108-related trades and other trades are posted on twitter using the #120trade hashtag)
T2108 Status: 60.3%
VIX Status: 13.6
General (Short-term) Trading Call: Hold (bullish bias)
Active T2108 periods: Day #123 over 20%, Day #3 over 60% (overperiod), Day #41 under 70%
Reference Charts (click for view of last 6 months from Stockcharts.com):
S&P 500 or SPY
SDS (ProShares UltraShort S&P500)
U.S. Dollar Index (volatility index)
EEM (iShares MSCI Emerging Markets)
VIX (volatility index)
VXX (iPath S&P 500 VIX Short-Term Futures ETN)
EWG (iShares MSCI Germany Index Fund)
CAT (Caterpillar)
Commentary
There are no major changes in the technical readings or outlook since the last T2108 Update where I described the potentially bullish parallels between this period and the last two years. I am whipping up this quick note to point out an interesting pop in the volatility index, do an overdue review of T2107, and to do some follow-up chart reviews.
The VIX surged today 8.8% even though the S&P 500 (SPY) went absolutely nowhere for the second day in a row.
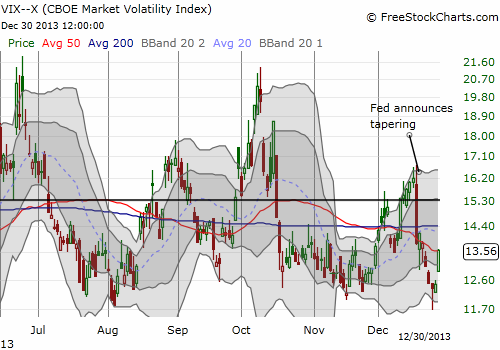
Given how strange this looks, I went to see what volatility and VIX expert Bill Luby had to say about this. Unfortunately, his last post was in early November discussing the holiday effect on the VIX. Interestingly, he observed at that time the VIX tends to decline during the first 17 days of December before hitting its low of the year. This year was MUCH different. The VIX rose for the first half of December in anticipation of wild trading around the Fed meeting where it finally launched bond tapering. As I had expected going into the meeting, the VIX collapsed post-Fed. And then, voila, in five more days, the VIX managed to trade close to its low for the year but never quite made it. There were no tweets from Luby today either.
So, I am left to speculate. My guess is that this is another very temporary rise in the VIX. I do not have a specific catalyst in mind for a reversal, but a strong open to 2014 could certainly do the trick.
In the meantime, T2108 is just as listless as the S&P 500. It closed at 60.3% and has not moved much for the fourth day in a row. If 2014 is going to burst onto the scene like the previous two New Year’s celebrations, then T2108 is a tightly wound spring. As we have seen before, T2108 could bumrush into overbought territory in just one day on a big flourish in the stock market. Until we get some kind of resolution, the bias remains bullish and to the upside for the market.
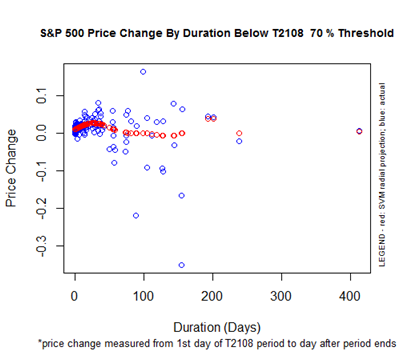
I have two caveats to stir up the pot a bit. First, note that T2108 has spent a LOT of time under the 70% threshold for overbought now. At day #41, it is just two trading weeks away from ending bearish territory. This is the time when the bias to the S&P 500’s performance at the end of this underperiod turns negative and the range of possible outcomes significantly widens (early next year I will need to update all these charts!).
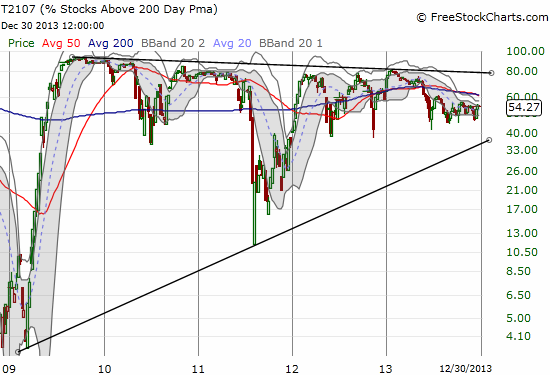
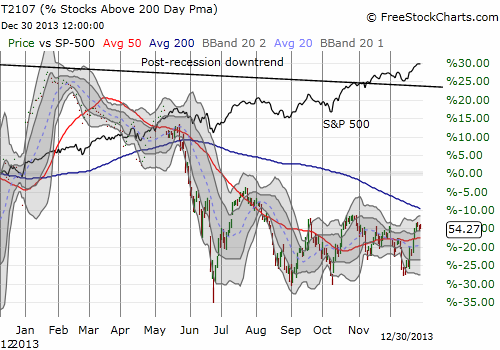
The next caveat is T2107, the percentage of stocks trading above their 200DMAs. I have been VERY remiss in not monitoring this indicator more closely in recent months. I was VERY surprised to find that T2107 has been languishing even as the S&P 500 has continued to print new highs. Ever since T2107 peaked with new all-time highs in July, it has struggled to break out of a narrow range. I am not ready to call this behavior outright bearish – especially since T2107 has been in decline since a major peak in 2009 after the historical March lows on the S&P 500. However, the current struggles certainly suggest that the participation in the rally is narrow or narrowing from the perspective of the longer-term uptrends (200DMA).
I have not developed any formal methods for trading on T2107 signals, so I have no immediate prescription in light of these data. I just strongly advise caution: I find it difficult to get exuberant with a rally that lacks wide enough participation.
I conclude with several chart reviews: Apple (AAPL), Twitter (TWTR), Intel (INTC), Caterpillar (CAT), and International Business Machines (IBM). The time is late, so I have to make this quick. Hopefully the charts largely speak for themselves…
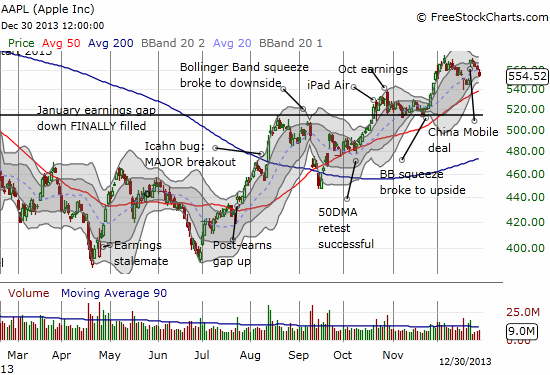
First, Apple (AAPL). Ever since the spectacular pop on the China Mobile (CHL) news, AAPL has been all downhill. Today, the stock almost reversed all its gains – a bearish development that could finally send AAPL to a retest of its 50DMA.
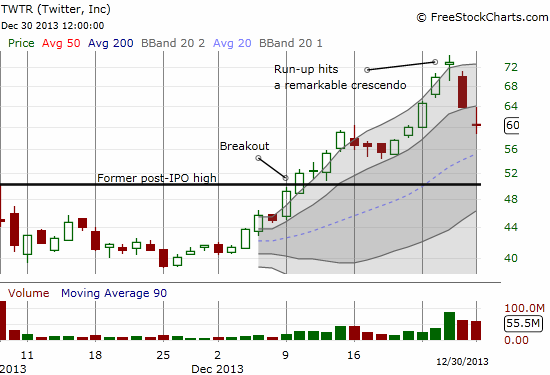
I covered Twitter (TWTR) in “Twitter’s Recent Run-Up Reaching A Likely Crescendo.” It turned out to be a very timely article. The next day, TWTR collapsed by 13.0% and the selling followed through with another 5.1% loss. TWTR has now reversed all its dot-com bubble-like gains from last week and sits at the first important level of support. Next important supports are at $55 (20DMA and last consolidation point) and $50 (the big breakout to the first post-IPO high). If (once?) $50 breaks, I am guessing TWTR will retest its lows before attracting a fresh set of recruits for bidding the stock back up.
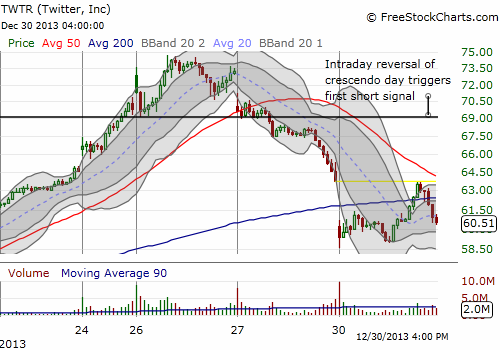
Note from the daily chart that TWTR has now formed a dreaded and very bearish “spinning top” that has selling confirmation. The pattern is VERY close to the even more dreaded abandoned baby top.
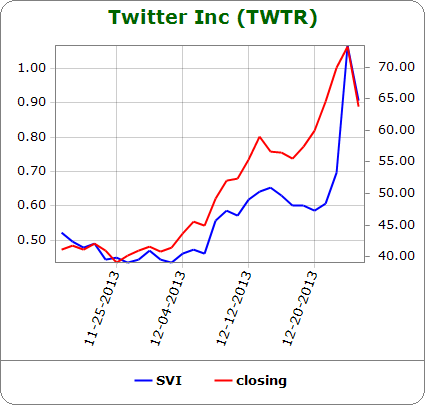
Source for implied volatility: Schaeffer’s Investment Research
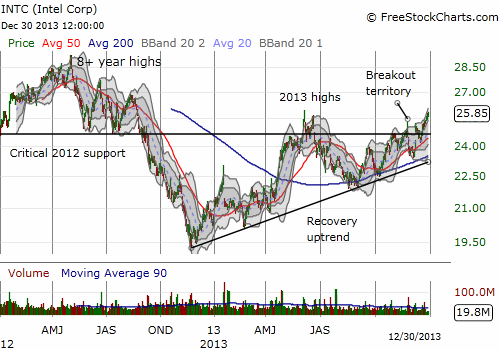
Intel (INTC) has had an amazingly volatile two months. The stock is on the mend but now faces the challenge of breaking above the 2013 high set in June. The stock remains well off 8+ year highs set in 2012.
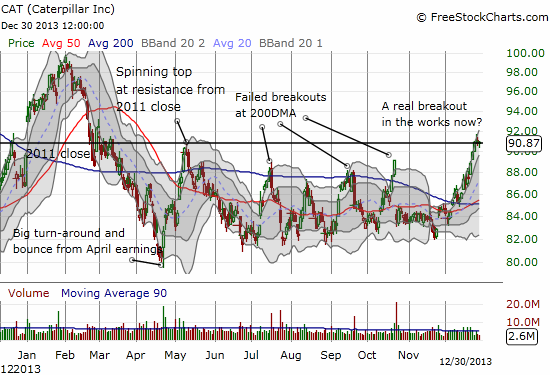
Caterpillar (CAT) has had a rough year – lagging the general market by a wide margin. The stock also suffered a string of false breakouts to add insult to injury. The stock seemed all but done in mid-July when Jim Chanos reminded the market he is short CAT. Now, frankly amazingly, CAT is breaking out above the very critical pivot around the 2011 close. The lingering is not good, but if the stock gets follow-through buying…look out!
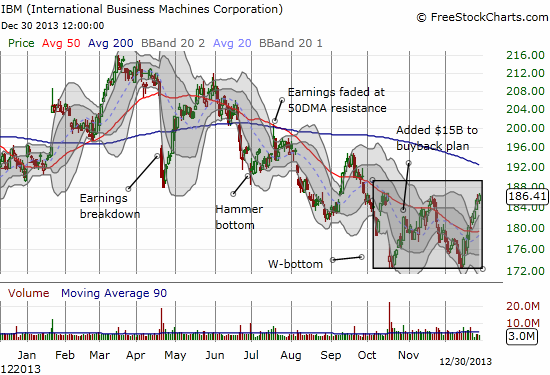
I covered the bullish case on International Business Machines in “Simple Reasons to Like IBM Despite the Headwinds” and I declared an entry point near the end of in late November in “Fresh Buying Entry for IBM As NASDAQ Flips On Overdrive.” I had to wait almost another three weeks before IBM found a true bottom and bounced sharply. I fortunately doubled down on call options at the potential W-bottom pattern and sold those last week. I remain bullish on IBM for dip-buying.
Daily T2108 vs the S&P 500
")
Black line: T2108 (measured on the right); Green line: S&P 500 (for comparative purposes)
Red line: T2108 Overbought (70%); Blue line: T2108 Oversold (20%)
Weekly T2108

*All charts created using freestockcharts.com unless otherwise stated
Related links:
The T2108 Resource Page
Expanded daily chart of T2108 versus the S&P 500
Expanded weekly chart of T2108
Be careful out there!
Full disclosure: long SPHB and SPLV and SSO puts (pairs trade); long AAPL shares, calls, and puts; long INTC calls; long CAT; long TWTR puts and calls