
(T2108 measures the percentage of stocks trading above their respective 40-day moving averages [DMAs]. It helps to identify extremes in market sentiment that are likely to reverse. To learn more about it, see my T2108 Resource Page. You can follow real-time T2108 commentary on twitter using the #T2108 hashtag. T2108-related trades and other trades are posted on twitter using the #120trade hashtag)
T2108 Status: 61.6%
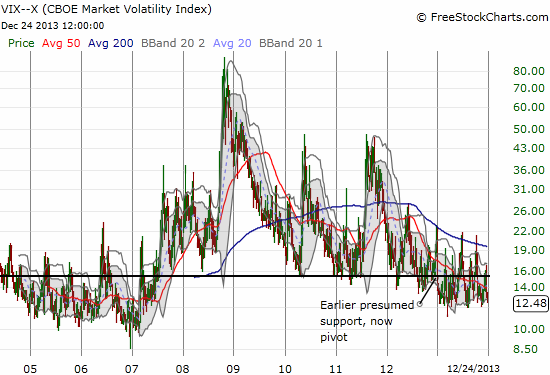
VIX Status: 12.5
General (Short-term) Trading Call: Hold (bullish bias)
Active T2108 periods: Day #120 over 20%, Day #1 over 60% (overperiod), Day #38 under 70%
Reference Charts (click for view of last 6 months from Stockcharts.com):
S&P 500 or SPY
SDS (ProShares UltraShort S&P500)
U.S. Dollar Index (volatility index)
EEM (iShares MSCI Emerging Markets)
VIX (volatility index)
VXX (iPath S&P 500 VIX Short-Term Futures ETN)
EWG (iShares MSCI Germany Index Fund)
CAT (Caterpillar)
Commentary
“Little has changed from the assessment from the last T1208 update on December 21st. Volatility is still trending downward, and T2108 is still trapped between extremes. The S&P 500 continues to creep upward as follow-through from the 3%+ surge on December 20th. The index is at a closing high for the month which matches its December intra-day high. At 1265, the S&P 500 is a few points above the converged resistance of former 2011 lows and the 200DMA.
So, the S&P 500 has a very interesting setup where low-volume, end-of-year trading could easily send the index into a breakout rally. T2108 also seems to be on target for overbought territory to start the new year. Stay tuned!”
This is a quote from my T2108 Update for December 23, 2011. Amazingly enough, this was about 50% ago on the S&P 500 (SPY). If only I had the foresight to load up then and stay put! I went back to this quote because it seems T2108 is on a runaway course to start 2014 overbought. If it does, the market could shoot like a rocket just as it did in 2012…and 2013. On the last trading day of 2011, T2108 closed at 56.4%. 2012 started with a bang with T2108 closing right at overbought at 70.7%. On the last trading day of 2012, T2108 closed at 64.3%. 2013 also started with a bang with T2108 closing into overbought territory at 78.9%. Here is what I said ahead of 2013:
“So much for the volatility index (VIX) getting stopped at resistance. After fading at the 21 resistance level on Thursday when good Fiscal Cliff news hit the wires, the markets were treated to the exact opposite on Friday. Bad Fiscal Cliff news hit the wires, and in the last 20 minutes of trade a mad scramble ensued. The VIX surged through resistance, and the S&P 500 tumbled back to the lows from Thursday. The daily charts now show clear and present danger. The VIX is showing rapidly growing (short-term) fear, and the S&P 500 closed firmly, well below its 50DMA…
…This is all a recipe to rush for shorts and puts, yet everything still hinges on headlines and political action. The S&P 500 has not even broken through its 200DMA yet. At 52%, T2108 is nowhere close to oversold, but given the growing tension shown in the charts above, T2108 could easily plunge to oversold territory in just a few days.”
This piece was written for December 29, 2012 and titled “VIX Breakout But Oversold Conditions Not Yet In Sight.” For those of you that remember, I was caught looking in the wrong direction because, like so many others, I was expecting the market to first swoon on “Fiscal Cliff” worries. The S&P 500 instead produced a major headfake, and I had to rapidly adjust to overbought conditions…this 180 degree turn was the genesis of my revamp of trading rules for overbought conditions.
Sentiment is downright placid compared to a year ago. The Federal government looks like it is going to “coast” into a budget deal this time around. Third quarter GDP was revised upward from 2.6% to 4.1%. There are no dire, looming headlines on geo-political risks or the like. The S&P500 just keeps plowing forward to fresh all-time highs. Accordingly, the VIX has plunged toward its lows for the year which in turn have not been matched since 2007.
I took this opportunity to sell my fistful of puts in ProShares Ultra VIX Short-Term Futures ETF (UVXY). While I was correct in my post-Fed assessment that UVXY would continue sinking, I got caught by a rapid decline in implied volatility for UVXY options. So, my profit was exactly the same as it was when volatility collapsed after the Fed’s tapering announcement. Consider this experience one more lesson learned! The good news for those of you late on the trade is that you had ample opportunity to profit from the continued decline in overall volatility.
So, it seems like 2011 and 2012 redux with T2108 setup to hit overbought levels to start another new year. I am hesitant to make this a prediction because the setup just seems “too perfect.” Regardless, the bias remains resolutely bullish. The overall bias will actually get even more bullish for a while if/once T2108 goes overbought.
There are many high-flying stocks taking off again, but adding to current optimism has to be news of Apple’s (AAPL) deal with China Mobile (CHL). Something about Monday’s for AAPL! The Apple Trading Model delivered bigtime on upside projections for Monday. The 3.8% surge to close out the post CHL news was a great reminder of why it pays to stick to the trading rules. (My call options soared 6x in value when I sold them shortly after the open).
Daily T2108 vs the S&P 500
")
Black line: T2108 (measured on the right); Green line: S&P 500 (for comparative purposes)
Red line: T2108 Overbought (70%); Blue line: T2108 Oversold (20%)
Weekly T2108

*All charts created using freestockcharts.com unless otherwise stated
Related links:
The T2108 Resource Page
Expanded daily chart of T2108 versus the S&P 500
Expanded weekly chart of T2108
Be careful out there!
Full disclosure: long SPHB and SPLV and SSO puts (pairs trade); long AAPL shares and calls