

Stock Market Commentary
Last week was billed as another marquee Fed week. While decision day brought a lot of intraday volatility, the churn became a mere speedbump as market breadth yawned and the stock market melt-up continued. The main message I heard from the Fed was an acknowledgement of an economy weak enough to warrant a rate cut, and an economic environment that presents an unusually wide range of potential near-term outcomes. Still, the stock market took the news in stride and quickly moved on.
Overlay the expanding complacency with a looming budget drama, and the October seasonal setup gets precariously interesting. A shutdown looms for October 1st. If this time is different, and the U.S. suffers an actual government shutdown, the stock market will start a third consecutive month with a sharp pullback. In this case will the buyers stay on automatic and jump right in just as they did in August and September? I have a hard time believing that same script will play out yet again. Be ready so you do not need to get ready. Note that the volatility index (VIX) has yet to make new lows even as the major indices melt-up. This pattern suggests the next spike higher is imminent.
The Stock Market Indices
S&P 500 (SPY)
The S&P 500 swung wildly after the release of the statement on monetary policy and swung wildly again as Powell covered his introductory remarks and answered questions during the press conference. The resulting 0.1% loss (essentially flat on the day) left the market’s verdict uncertain. The resumption of the melt-up over the subsequent two trading days settled matters. At new all-time highs, the S&P 500 looks as strong as ever and even looks to keep following the upper Bollinger Band (BB) (the black line) to further all-time highs.
")
NASDAQ (COMPQX)
The NASDAQ closely partnered with the S&P 500. After the shallow Fed dip, tech resumed its own melt-up.
")
iShares Russell 2000 ETF (IWM)
IWM managed its first closing all-time high since 2021 (the 2024 high missed the market by a hair) with a 2.5% post-Fed gain on Thursday. While Friday’s 0.8% pullback created fresh under-performance for IWM, the overall trend for IWM looks encouraging. A breakout and trend continuation from here could finally release a powerful and sustained rally. Thus, I am sticking with my core holding of shares and will continue to trade call options around this position. I took profits on the last tranche as IWM initially jumped in response to the Fed release on Wednesday. Small caps are very sensitive to interest rates so the initial surge made sense. Friday’s pullback aligned with a sustained post-Fed sell-off in bonds.
")
The Short-Term Trading Call After Market Breadth Yawned
- AT50 (MMFI) = 62.0% of stocks are trading above their respective 50-day moving averages
- AT200 (MMTH) = 60.7% of stocks are trading above their respective 200-day moving averages
- Short-term Trading Call: neutral
AT50 (MMFI), the percentage of stocks trading above their respective 50DMAs, closed the week at 62%. It has gone nowhere for about a month and essentially for four months, stuck under the 70% overbought line. By my AT50 trading rules, this extended inability to break into overbought territory is bearish trading behavior. However, the on-gong melt-up in the indices makes this bearish signal unactionable. Thus, I continue to hold the short-term trading call at neutral. I am not sure yet what could make me bullish again without some kind of pullback steep enough to send market breadth toward oversold levels.
AT200, the percentage of stocks trading above their respective 200DMAs, looks relatively healthy, holding above its level from the S&P 500’s first all-time highs earlier in the year. A breakout from AT200’s current trading range would take the edge off my cautious stance, perhaps even nudge me bullish. In the meantime, market breadth is just giving out an extended yawn.
The Equities: Market Breadth Yawns
iShares 20+ Year Treasury Bond ETF (TLT)
Description: TLT tracks long-term U.S. Treasuries over 20 years.
Technical status: A near bearish engulfing reversal after the Fed cut opened the door to two more days of losses.
Trade commentary: Thursday’s gap down and 1.0% loss in the wake of strong jobs data (initial unemployment claims plunged) served as a reminder of the on-going uncertainty in the economic environment. The stock market overall remained surprisingly calm about the volatility. I took a small profit on a holding of ProShares UltraShort 20+ Year Treasury (TBT) shares and am still holding my accumulated put options on TLT as I continue to fade TLT rallies.

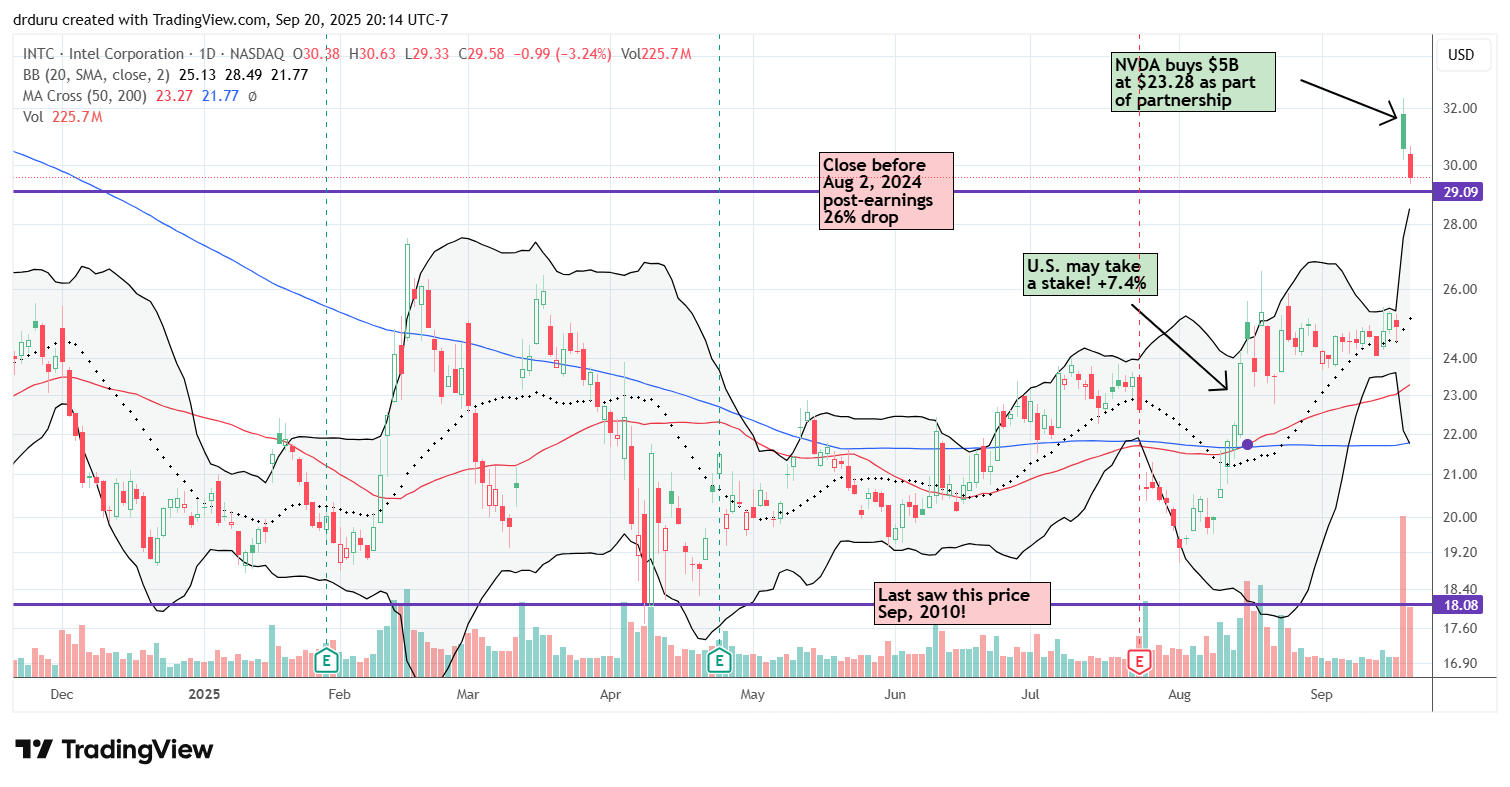
Intel (INTC)
Description: Intel (INTC) designs and manufactures semiconductor chips and computing platforms.
Technical status: The stock ripped higher on Nvidia’s $5 billion stake, snapping a 13-month trading rut. Support sits around $29, the August 2, 2024 close before the post-earnings collapse that sent INTC in to the last trading rut.
Trade commentary: I thanked NVDA and without hesitation took profits on my long-suffering INTC position right at the open. I had largely given up on INTC, especially after a CEO changed failed to change INTC’s dour technical outlook, but I resolved to hold my accumulated shares in the hope for an amazing turnaround. I was further dismayed after news of a U.S. government stake in INTC similarly filed to improve the stock’s technical outlook. The current bullish breakout makes me more interested in restarting my “between earnings” trade on INTC call options. First, can INTC hold the first line of support? If not, it could slowly but surely reverse the entire NVDA-inspired gain.
NVIDIA (NVDA)
Description: NVIDIA (NVDA) develops GPUs and AI platforms for computing and data centers.
Technical status: Shares flirted with a double top but reclaimed 50DMA support after faking out bears. The Intel stake added a 3.5% gain.
Trade commentary: NVDA scored a double bonus with instant gains on its INTC shares as well as gains in its own stock. I expect NVDA’s post-INTC gains to mostly fade before the stock makes another run at invalidating its double top. News that the Chinese government advised domestic companies to stop buying NVIDIA chips sent NVDA tumbling 2.6% on its last 50DMA breakdown. The INTC deal helped quickly reverse that loss.
Micron Technology (MU)
Description: Micron Technology (MU) produces memory and storage solutions.
Technical status: Shares hit a new all-time high with a 5.6% surge in the wake of the NVDA/INTC news. Presumably, a healthier INTC will boost demand for MU chips without cannibalizing INTC competitors who also use MU chips.
Trade commentary: Just ahead of the NVDA/INTC news, I happened to buy a call spread as a pre-earnings play. That trade hit its initial profit target right at Thursday’s open. I decided not to reopen the trade on Friday’s gap down and 3.7% loss. Such a swift reversal suddenly makes MU appear toppy. After earnings, I will reassess my MU trading strategy. Including tailwinds from Oracle’s earnings, MU looks more and more like a major beneficiary from the AI boom.
Amkor Technology (AMKR)
Description: Amkor Technology (AMKR) provides semiconductor packaging and testing services.
Technical status: AMKR first jumped 5.6% on Tuesday on news of a fresh deal with Apple (AAPL). The stock jumped an additional 9.5% in the wake of the NVDA/INTC announcement. AMKR cooled off a bit on Friday’s 2.9% pullback.
Trade commentary: In April, I lamented by commitment to AMKR. A mild reaction to subsequent earnings kept me in the stock. As promised, I added shares on a 50DMA breakout. So I felt quite relieved and vindicated when AMKR popped on the AAPL news, and I took profits. Given how well the stock responded to news last week, I am really wondering why the market got so discouraged with AMKR. The stock is a buy on the dips to 20DMA and/or 50DMA support.
ARM Holdings (ARM)
Description: ARM Holdings (ARM) licenses processor designs for chips across computing devices.
Technical status: ARM fell 4.5% in the wake of the NVDA/INTC news, slipping back under its 50DMA the next day. The stock remains stuck in a wide range dating back to February, 2024.
Trade commentary: Given the trading range, I try to buy ARM on sell-offs and sell on rallies.
Intuitive Surgical (ISRG)
Description: Intuitive Surgical (ISRG) develops robotic-assisted surgical systems.
Technical status: Shares slid to a 14-month low, extending a 3-month downtrend.
Trade commentary: I exited in early August and will only revisit once technicals stabilize.
")
Snowflake (SNOW)
Description: Snowflake (SNOW) offers a cloud-based data platform.
Technical status: Shares bounced from 20DMA support after drifting away from a 20.3% post-earnings jump to a 3 1/2 year high.
Trade commentary: I should have bought SNOW on Thursday on the first rise from 20DMA support. Now I am looking for any pullback to buy.
")
Wix.com (WIX)
Description: Wix.com (WIX) provides website creation and business tools.
Technical status: After a post-earnings setback in August, WIX has streaked above its 50DMA and 200DMA. The stock is now stalled at the last high set in May.
Trade commentary: Trading looks erratic, so I am staying cautious. A confirmed breakout over the last high will maintain the bullish posture for WIX.
")
CrowdStrike Holdings (CRWD)
Description: CrowdStrike (CRWD) provides cloud-native cybersecurity platforms.
Technical status: A perfect test of 200DMA support preceded a 50DMA breakout and 12.8% surge on news of AI cybersecurity features.
Trade commentary: I missed the entry at 200DMA support, but I will stalk the next dip.
")
Ramaco Resources (METC)
Description: Ramaco Resources (METC) mines metallurgical coal for steelmaking. (In the associated video, I mischaracterized METC as a rare earths company).
Technical status: Shares jumped 18.7% to new all-time highs.
Trade commentary: I should already own these shares based on the 200DMA breakout in June and the test of 200DMA support in July. I am now eyeing the next test of uptrending 20DMA support.
")
Ucore Rare Metals (UURAF)
Description: Ucore Rare Metals (UURAF) develops rare earth separation technologies.
Technical status: UURAF gained 19.4% on Friday and remains in an uptrend bouncing off 20DMA support.
Trade commentary: Since I lost patience and took profits on UURAF, the stock has delivered on several reentry opportunities. In particular, I should have reentered on July’s 50DMA breakout. Now, I need to get more aggressive with a reentry on the next test of 20DMA support.
")
Cracker Barrel Old Country Store, Inc (CBRL)
Description: Cracker Barrel (CBRL) operates full-service restaurants with retail shops.
Technical status: Earnings triggered a 7.6% loss with another 5% drop the next day, driving shares toward April lows.
Trade commentary: The bearish signals on CBRL played out with the post-earnings weakness. I have no interest in buying shares until the next 200DMA breakout. I also do not want to short shares given the heavy 24.3% short interest.
Darden Restaurants (DRI)
Description: Darden Restaurants (DRI) operates Olive Garden and other full-service chains.
Technical status: Shares tumbled 7.7% post-earnings and 4.2% more on Friday, breaking its 200DMA for the first time in almost a year.
Trade commentary: Weakness across casual dining keeps me wary of the sector. I happened to be short shares in Brinker International (EAT), owner of Chili’s, and took profits on the position on Thursday.
")
Jack in the Box (JACK)
Description: Jack in the Box (JACK) operates quick-service restaurants.
Technical status: JACK consolidated after a long decline and could be setting up for reversal.
Trade commentary: I only checked JACK’s chart to see another sign of weakness in the quick-service sector. I was pleasantly surprised to see the price consolidation. The stock is now on my buy list, but I am content to wait for a 50DMA breakout.
Upwork (UPWK)
Description: Upwork (UPWK) runs a freelance talent marketplace.
Technical status: UPWK strung together three strong gains after the Fed cut, forming higher highs and higher lows.
Trade commentary: I want back in on a dip; momentum looks promising.
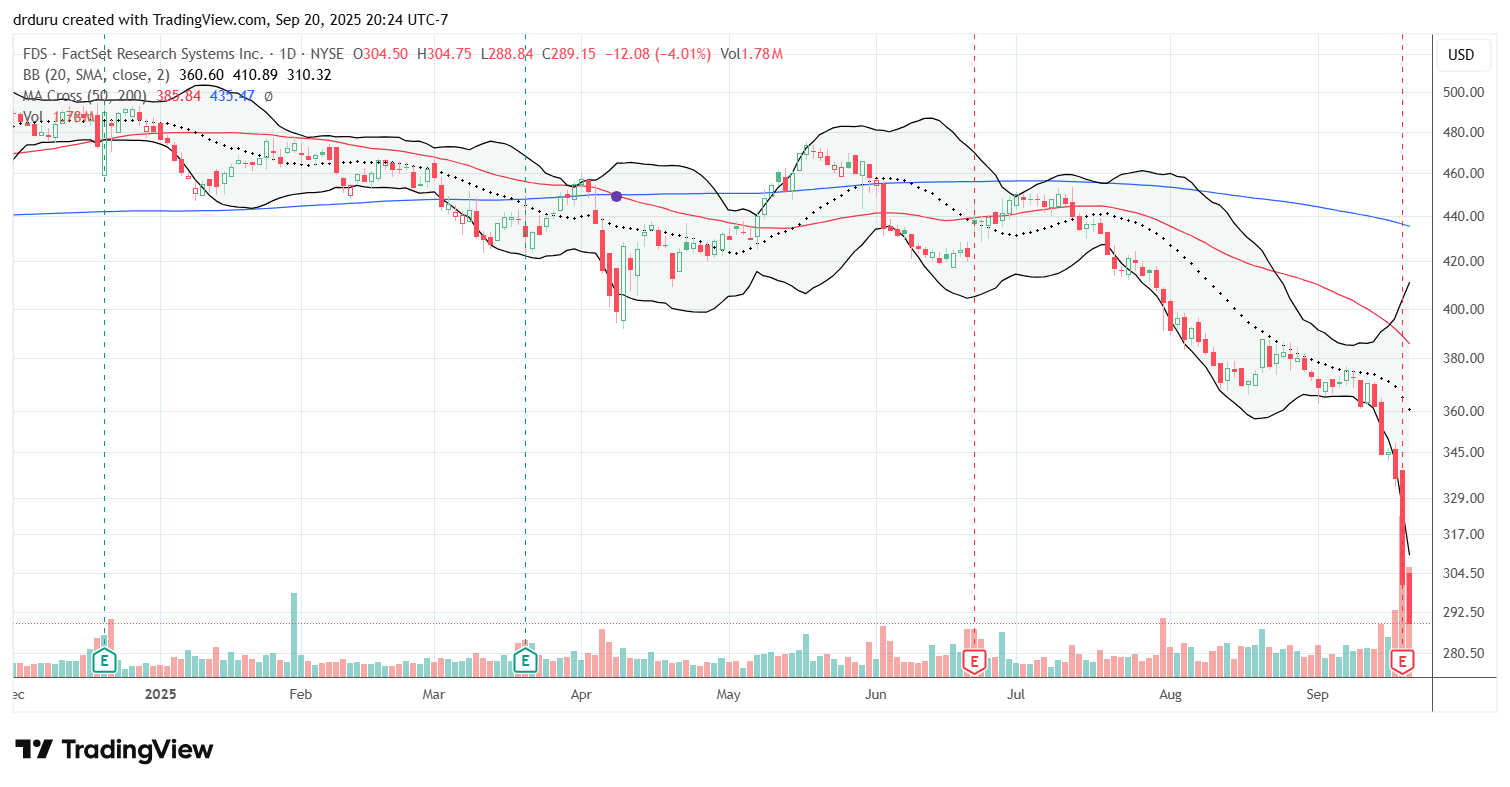
FactSet Research (FDS)
Description: FactSet Research (FDS) provides financial data and analytics.
Technical status: FDS collapsed 10.4% post-earnings and slid further, hitting 2020 levels.
Trade commentary: I sold a put, now underwater, on the belief the market overreacted. I plan to hold in the expectation some kind of rebound will unfold in coming months.
Gartner (IT)
Description: Gartner (IT) delivers IT research and advisory services.
Technical status: IT rebounded weakly but remain capped by resistance.
Trade commentary: I took small profits on my contrarian IT position to make room for the FDS position.
S&P Global (SPGI)
Description: S&P Global (SPGI) provides ratings, benchmarks, and analytics.
Technical status: SPGI dropped 6.7% in sympathy with FDS, slipping under its 200DMA.
Trade commentary: SPGI is still near its all-time high, so I have to assume the stock has significant downside risk if investors continue to associate the stock with the rest of the research sector. I will keep monitoring the stock, but I am avoiding it for now.
")
")
Be careful out there!
Footnotes
Subscribe for free to get email notifications of future posts!
“Above the 50” (AT50) uses the percentage of stocks trading above their respective 50-day moving averages (DMAs) to measure breadth in the stock market. Breadth defines the distribution of participation in a rally or sell-off. As a result, AT50 identifies extremes in market sentiment that are likely to reverse. Above the 50 is my alternative name for “MMFI” which is a symbol TradingView.com and other chart vendors use for this breadth indicator. Learn more about AT50 on my Market Breadth Resource Page. AT200, or MMTH, measures the percentage of stocks trading above their respective 200DMAs.
Active AT50 (MMFI) periods: Day #67 over 20%, Day #65 over 30%, Day #60 over 40%, Day #33 over 50%, Day #2 over 60% (overperiod), Day #40 under 70% (underperiod)
Source for charts unless otherwise noted: TradingView.com
Full disclosure: long IWM shares, long TLT puts, long SPY put spreads, short FDS put
FOLLOW Dr. Duru’s commentary on financial markets via StockTwits, BlueSky, and even Instagram!
*Charting notes: Stock prices are not adjusted for dividends. Candlestick charts use hollow bodies: open candles indicate a close higher than the open, filled candles indicate an open higher than the close.
* Blog notes: this blog was written based on the heavily edited transcript of the following video that includes a live review of the stock charts featured in this post. I used ChatGPT to process the transcript.