Stock Market Commentary
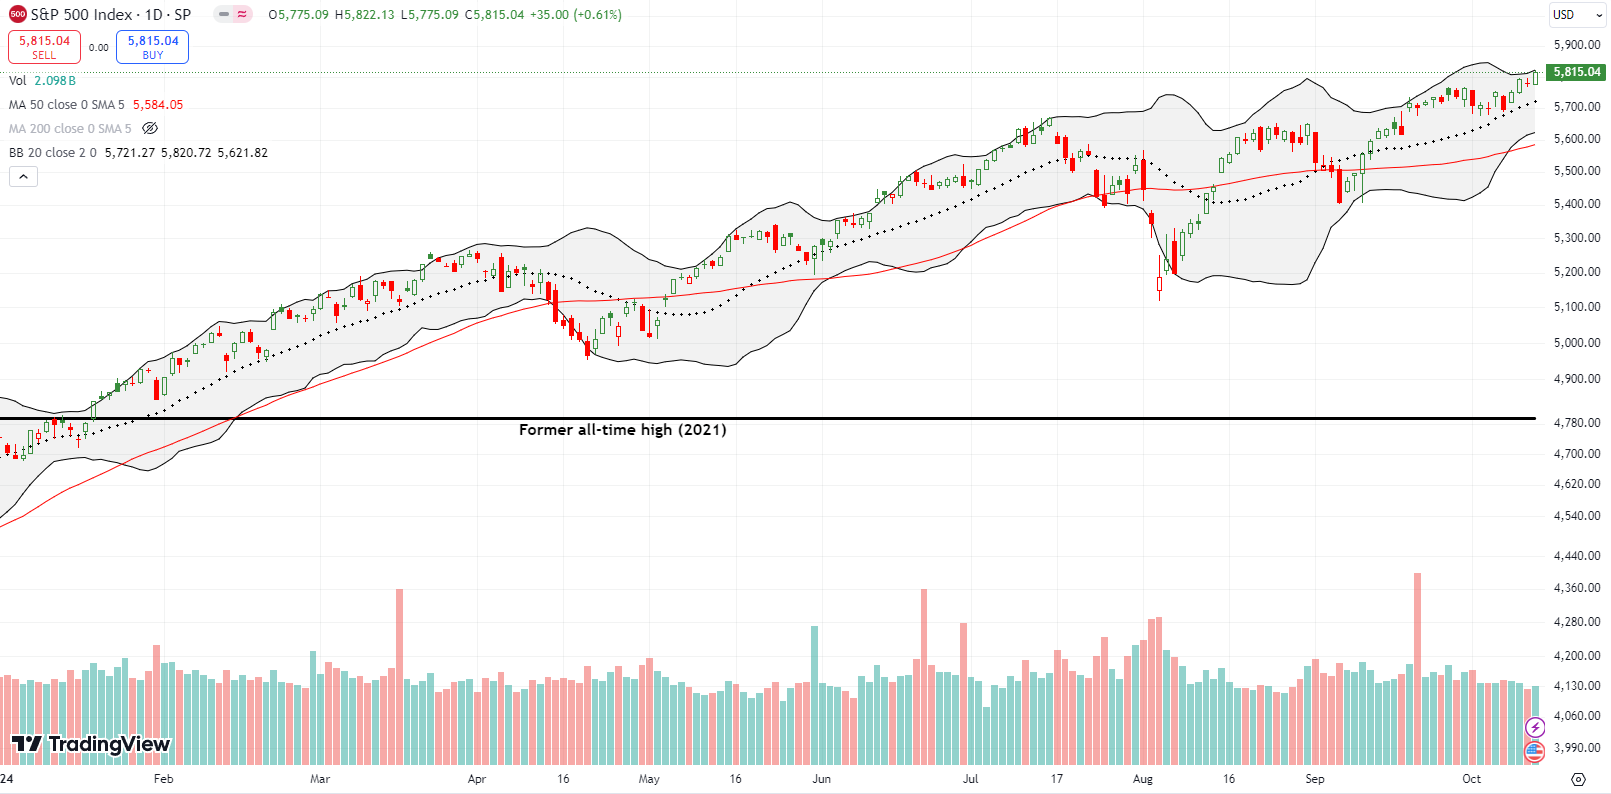
October is the third of the stock market’s three most dangerous months. October, 2024 started with a convergence of bad news tailor-made to fulfill October’s seasonal destiny: intensifying war and geo-political tensions, two intense hurricanes, the looming contentiousness of the U.S. presidential election, another failure from the overbought threshold (bearish according to the AT50 trading rules), even a strong September job’s report and what looks like stabilizing inflation that both promise to delay the rate cut goodies for the stock market. The market is not even fazed by a strengthening U.S. dollar and a resurgent volatility index (VIX). None of these signs mattered. After a maximum drawdown of 1.2%, the S&P 500 decided to defy all these October warnings and print all-time highs going into earnings season.
The Stock Market Indices
The S&P 500 (SPY) closed at two all-time highs last week. Overall, the index has carried a bullish uptrend with just brief interruptions from breakdowns below the 50-day moving average (DMA) (the red line below). This trading action is a quintessential example of defying gravity.
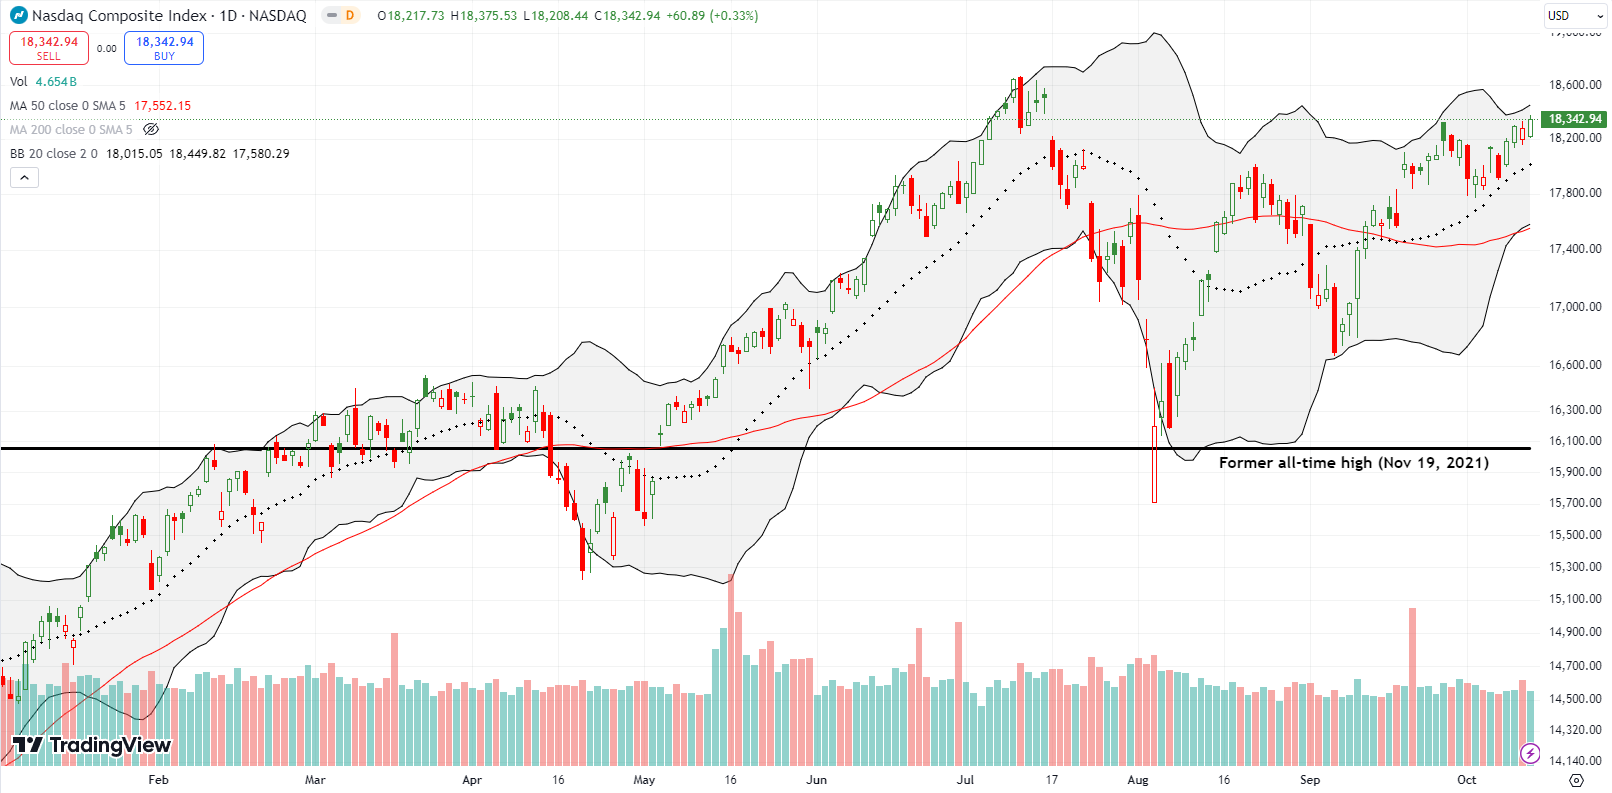
The NASDAQ is trying once again to fill the gap from July that marked the confirmation of a bearish engulfing top. With a close above the September high, the tech laden index is well-positioned to finally invalidate that bearish signal…and join the S&P 500 in an effort to deft October’s warnings.
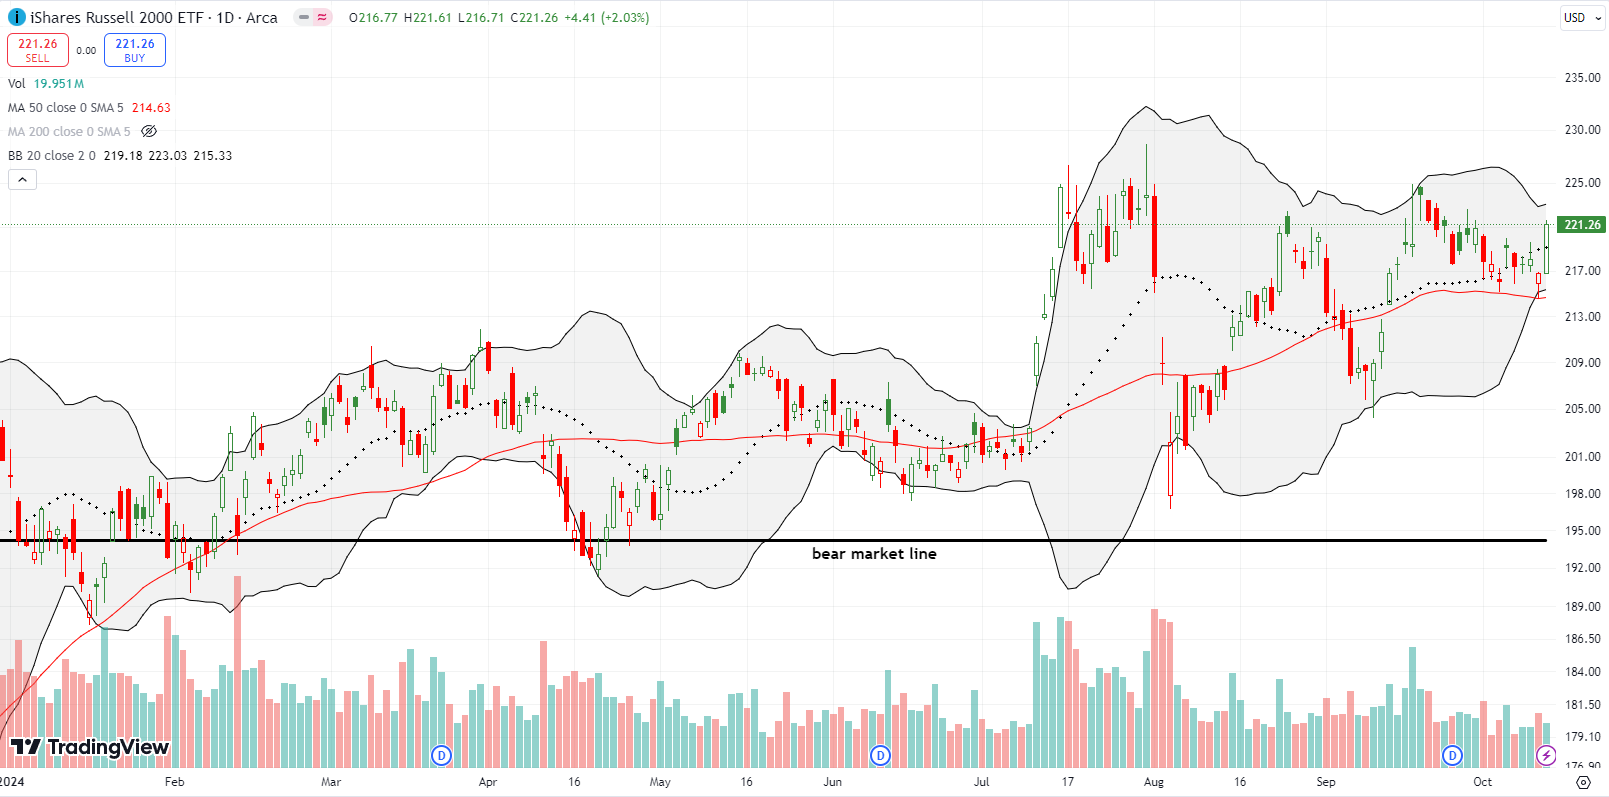
The iShares Russell 2000 ETF (IWM) woke up with a 2.0% gain. That move confirmed 50DMA support, a trendline that traders tested twice this month.
The Short-Term Trading Call to Deft October’s Warnings
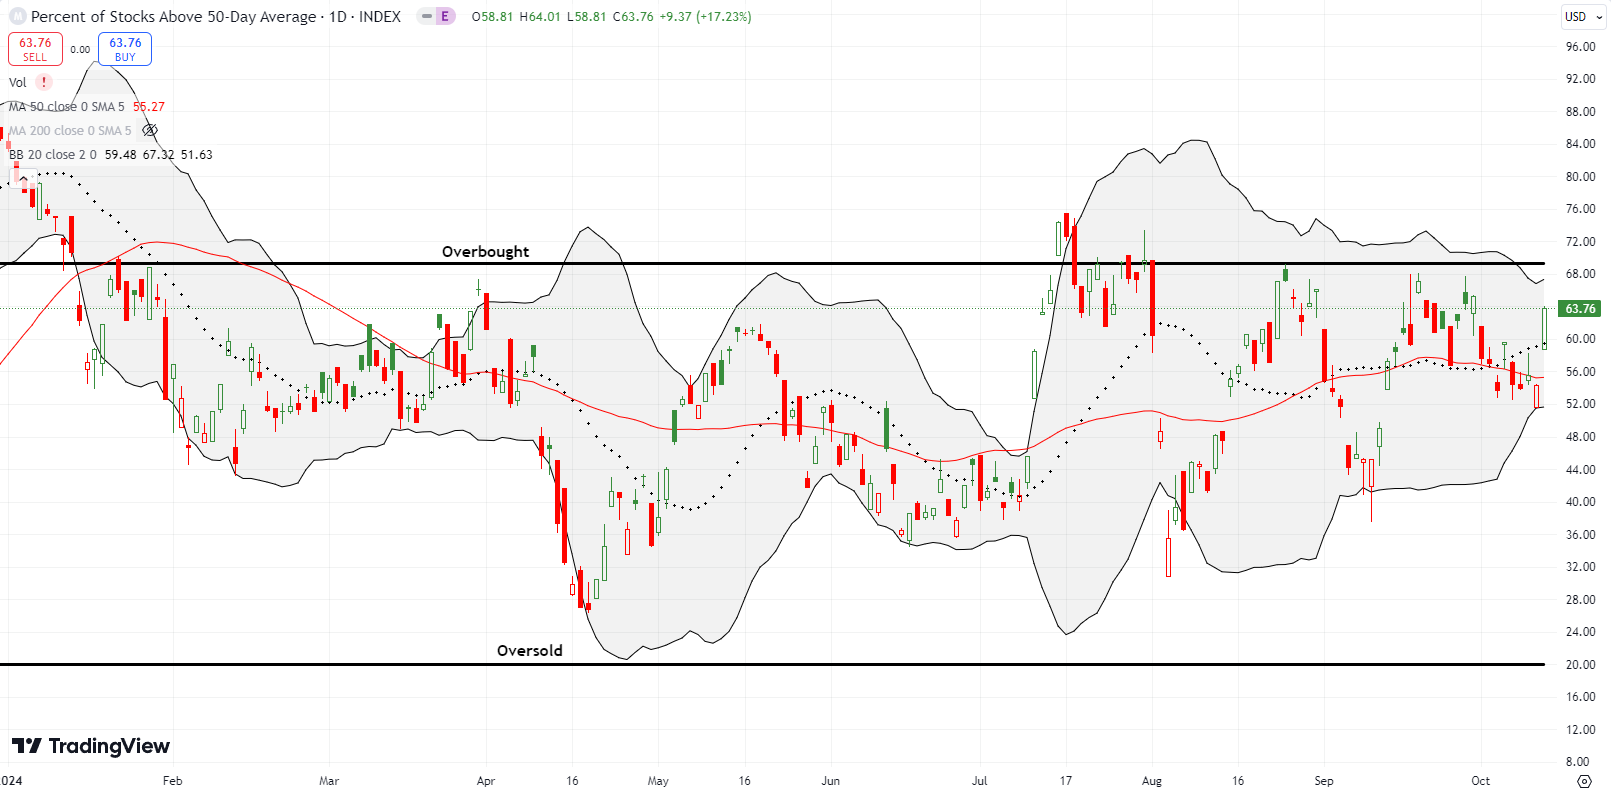
- AT50 (MMFI) = 63.8% of stocks are trading above their respective 50-day moving averages
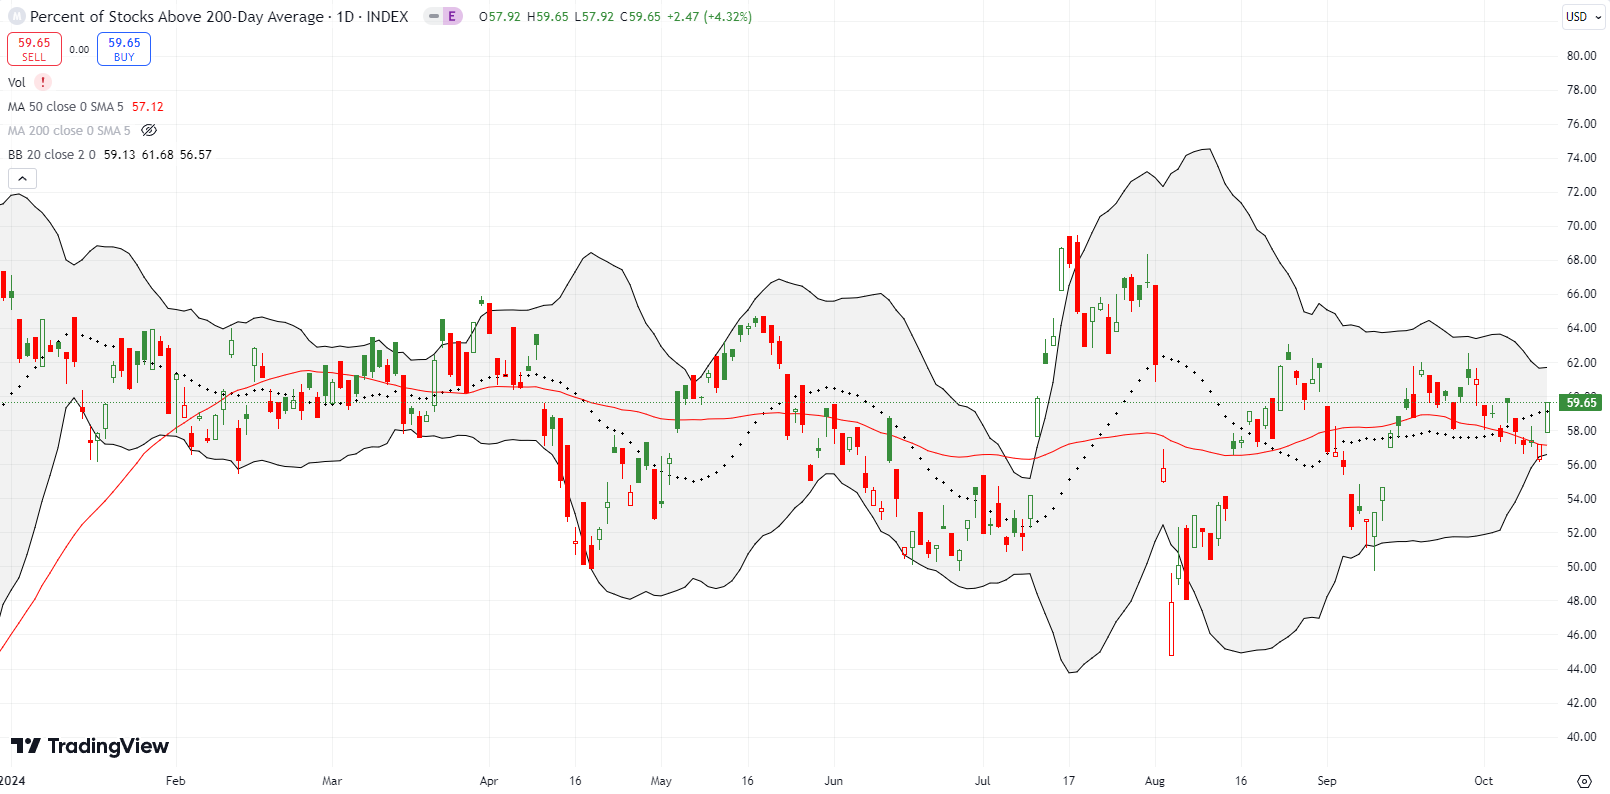
- AT200 (MMTH) = 59.7% of stocks are trading above their respective 200-day moving averages
- Short-term Trading Call: neutral
AT50 (MMFI), the percentage of stocks trading above their respective 50DMAs, drifted downward all week and then popped on Friday from 54.4% to 63.8%. Once again, my favorite technical indicator looks poised to push into overbought territory. The mildly bearish signal that was generated from late September’s failure to tap the overbought threshold was only good for a mild October pullback. The maximum drawdown for the month sits at 1.2%. It is below the median and the average maximum drawdown for the month. However, as I noted in the last Market Breadth, given the market has made it this far despite numerous warnings, I cannot foresee a near-term catalyst that will produce a more seasonal October pullback.
If my acquiescence to complacency proves wrong well then my periodic admonition to “get ready so you don’t need to be ready” will loom large again.
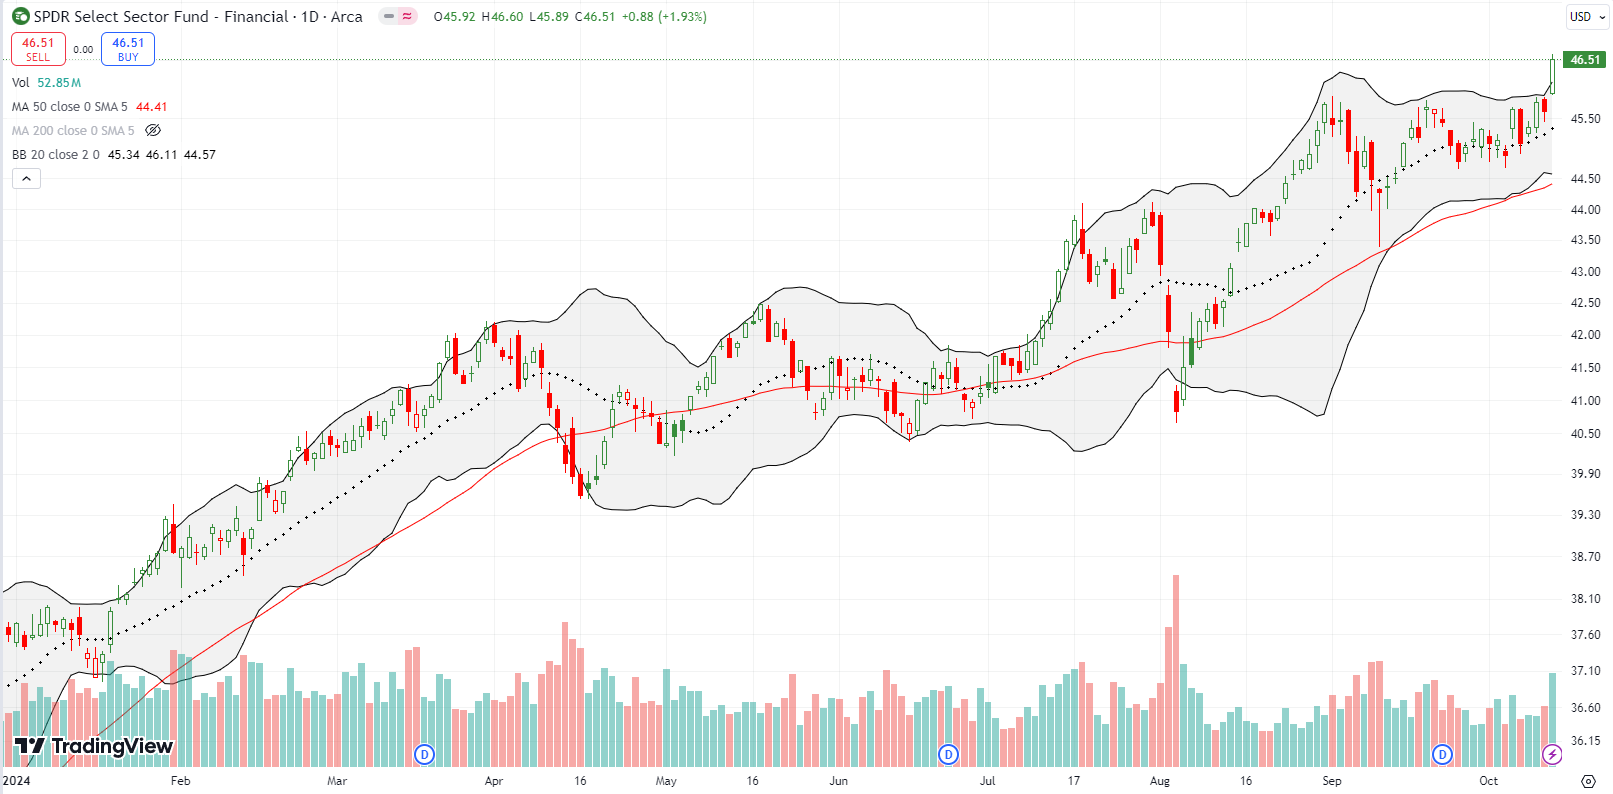
Like the S&P 500, financials don’t care about October’s warnings. The SPDR Select Sector Fund – Financial (XLF) closed the week at an all-time high. XLF gained 1.9% on Friday on an impressive breakout. The bad news a month ago that kept me from going long XLF, as a play on holding 50DMA support, looks and feels like a quaint and distant memory!
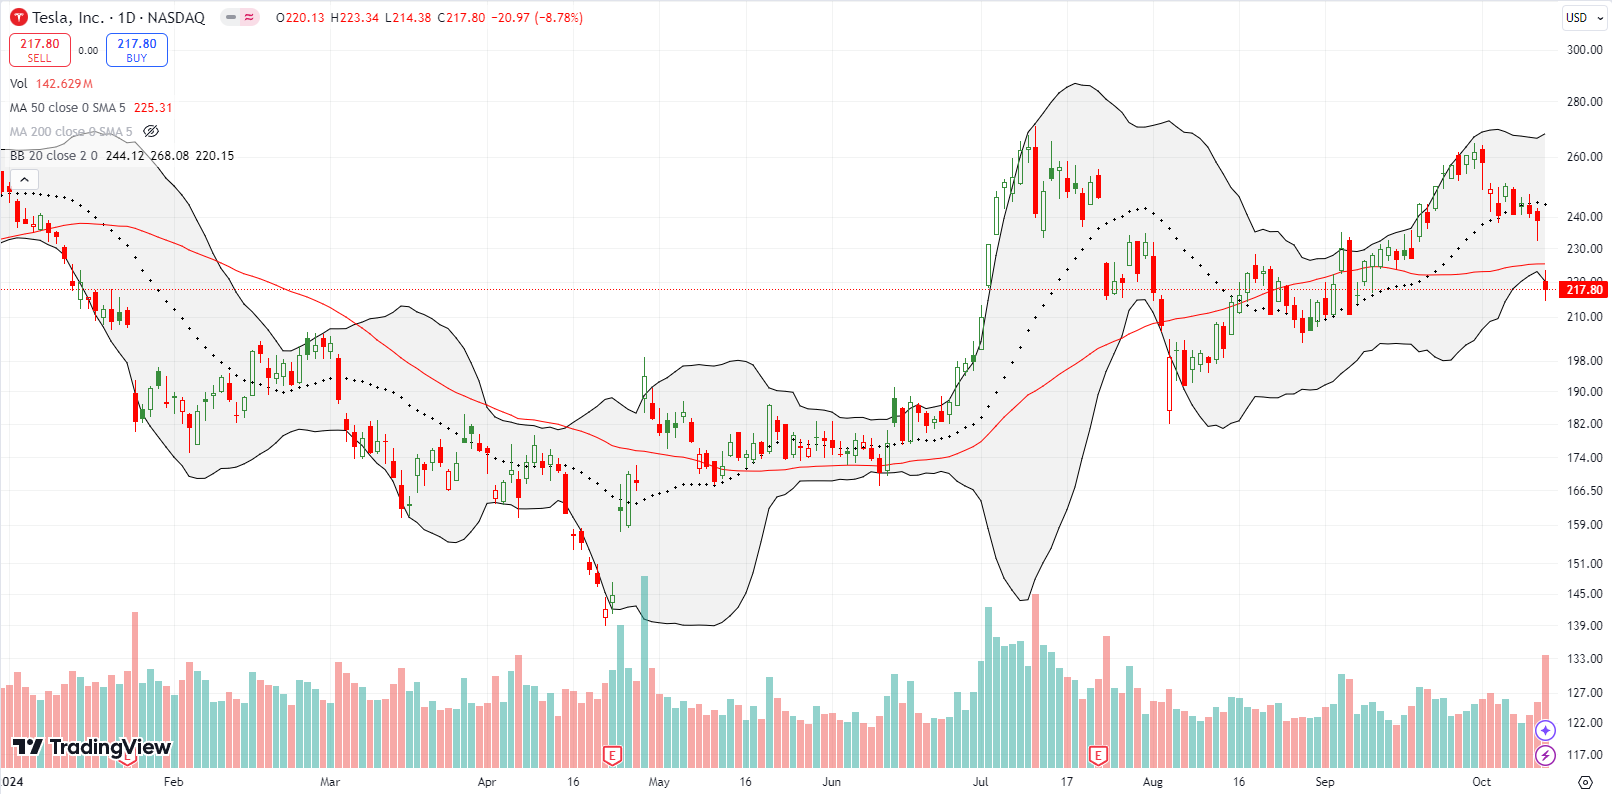
My Tesla Inc (TSLA) trade failed. I was counting on hype from Tesla’s (TSLA) announcement about its forthcoming robotaxi to get the TSLA fans scooping up shares before and after the event. If I had not locked into a bullish assumption about the event, I might have noticed the complete absence of excitement and hype going into the announcement. On October 2, TSLA dropped on disappointing September delivery numbers and never recovered. The stock drifted downward into Thursday night’s event and gapped down Friday morning. The 8.8% loss broke 50DMA support and closed TSLA just above its 2023 breakout point (not shown below).
After a quick (re)assessment I decided to carry over the trade at least one week. I took profits on Tradr 2x Short TSLA Daily ETF (TSLQ), rolled over the weekly long put, and took delivery of shares on the short put. On Monday, I plan to sell a call option against the shares. If I do not log a profit in the coming days, I will evaluate one more time whether to roll the position to a further date.
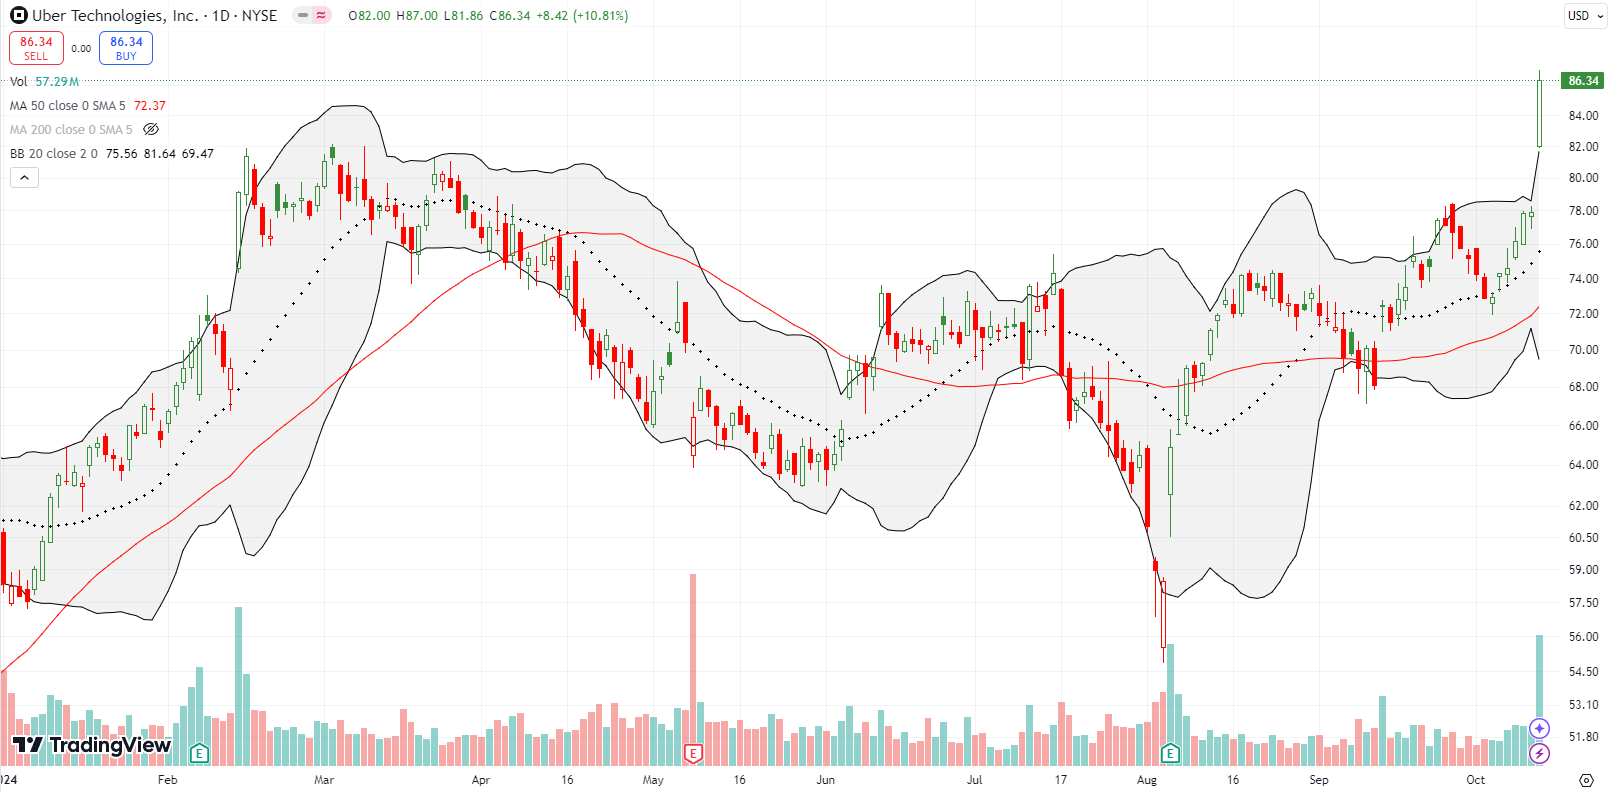
Uber Technologies, Inc (UBER) benefited from Tesla’s robotaxi dud. UBER gained 10.8% and closed at an all-time high. It never even occurred to me to use UBER as part of a hedged trade on Tesla’s robotaxi event. It also never occurred to me that UBER’s strength going into that announcement was one more warning sign. UBER’s breakout is as bullish as it gets and makes the stock a buy on the dips until/unless traders fully reverse Friday’s gain.
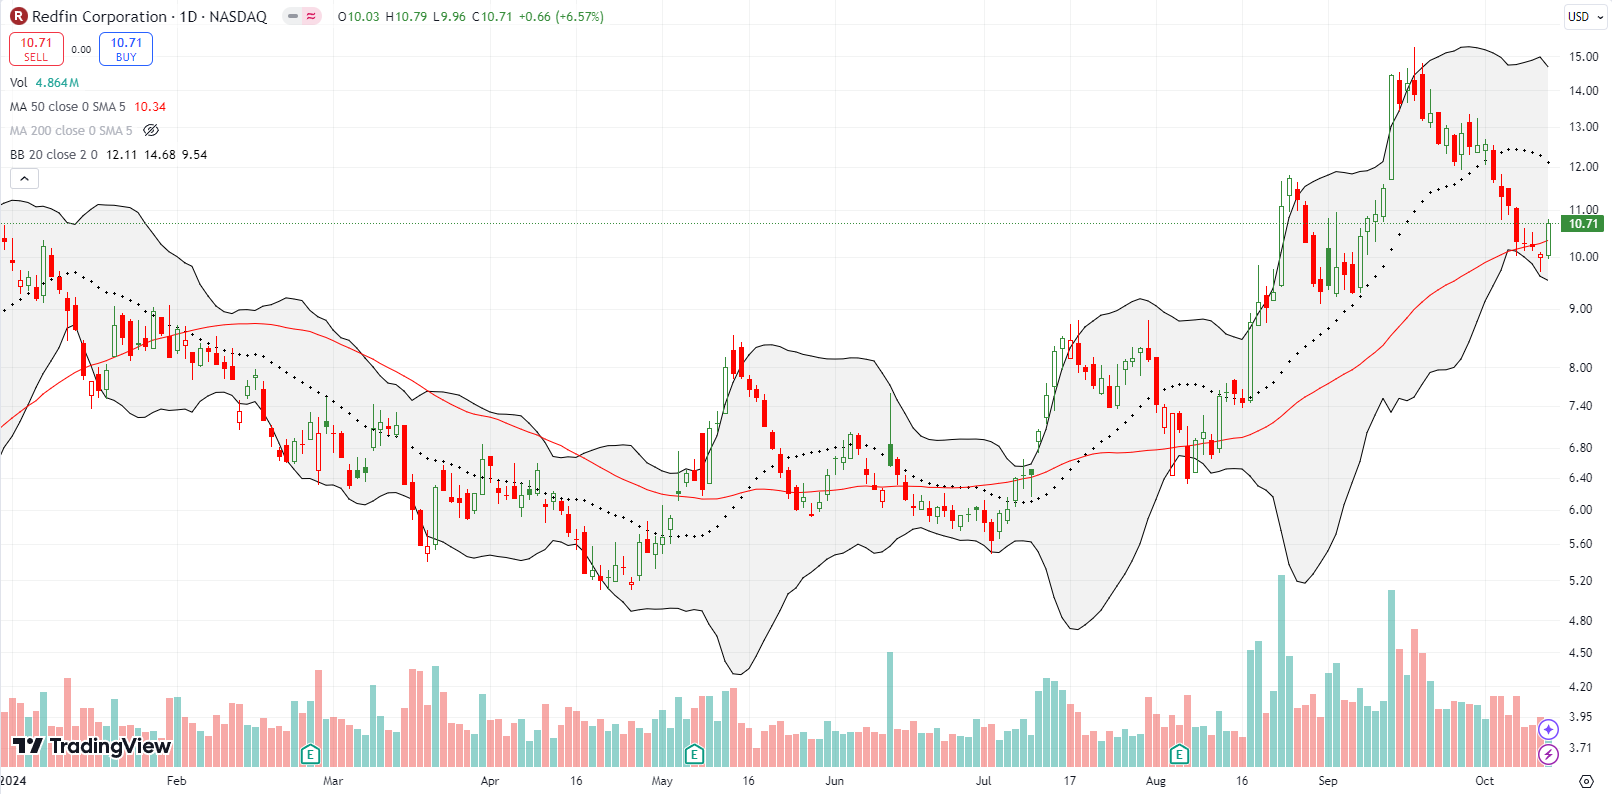
My 180-degree flip on Redfin Corporation (RDFN) worked out as the stock made a beeline to 50DMA support as I expected. I took profits on the 50DMA test. I flipped 180 degrees yet again after RDFN closed above 50DMA resistance. This trade stays on my radar because I suspect the moment I give up is when RDFN will suddenly soar as it did so many times on its rebound from the summer lows…or it will collapse (consistent with my nagging feeling that RDFN does not have a long-term sustainable business). Long-term rates have been rising, so it makes sense that RDFN faded almost the entire move from the last rally. I will flip yet again on a fresh low.
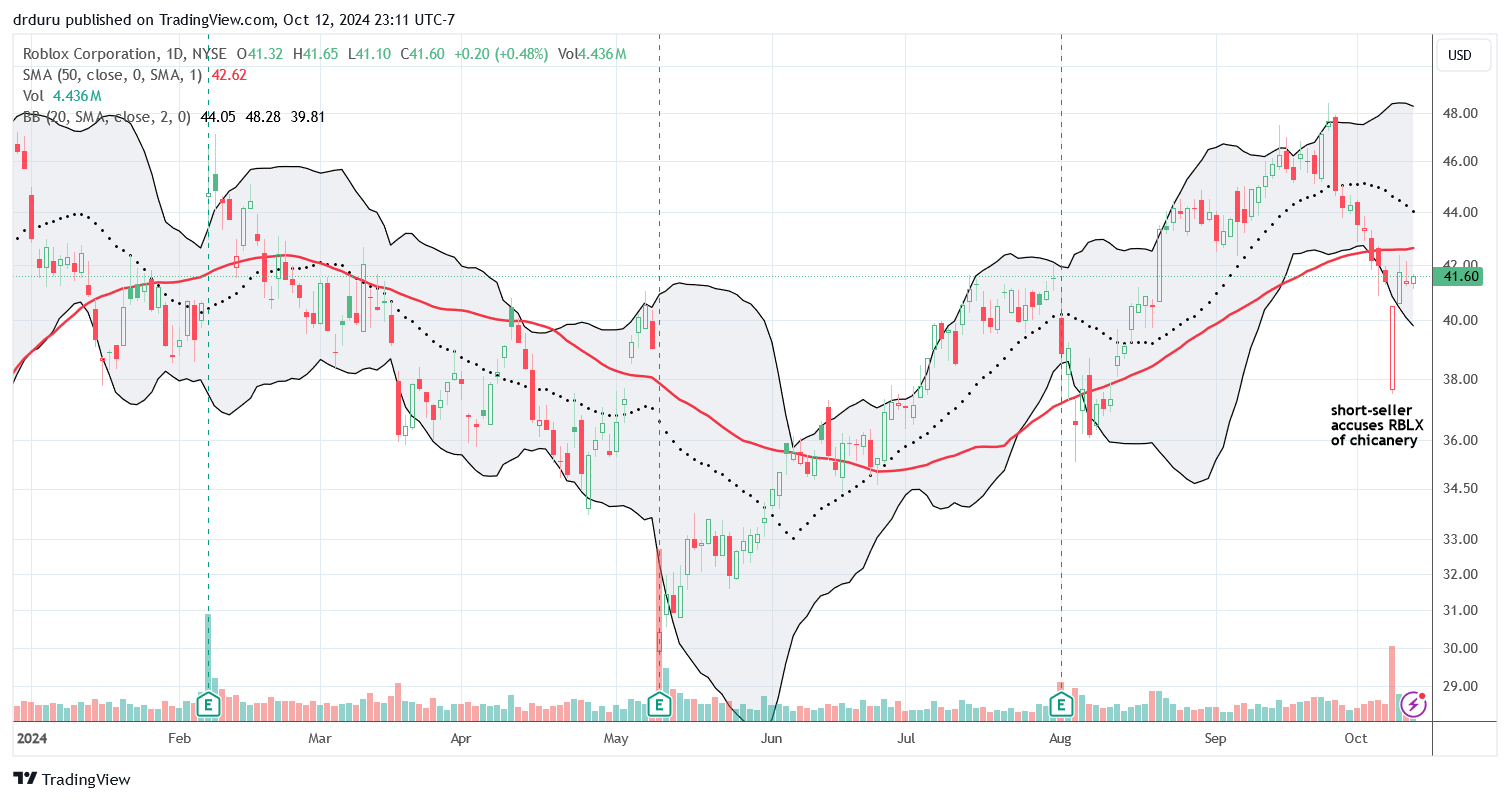
My hedged trade on Roblox Inc (RBLX) worked out in to the downside despite my suspicion that the stock was ready to fake out bears on a 50DMA breakdown. A short-seller issued a scathing report on RBLX that sent the stock down 9.0% at the open. With the stock trading an extreme (well below the lower Bollinger Band (BB)), I quickly took profits on the strangle position. With buyers already fighting back with a full reversal of the losses induced by the short-seller, I am likely to put on a fresh strangle position…suspecting that buyers are fueling up to continue fighting back.
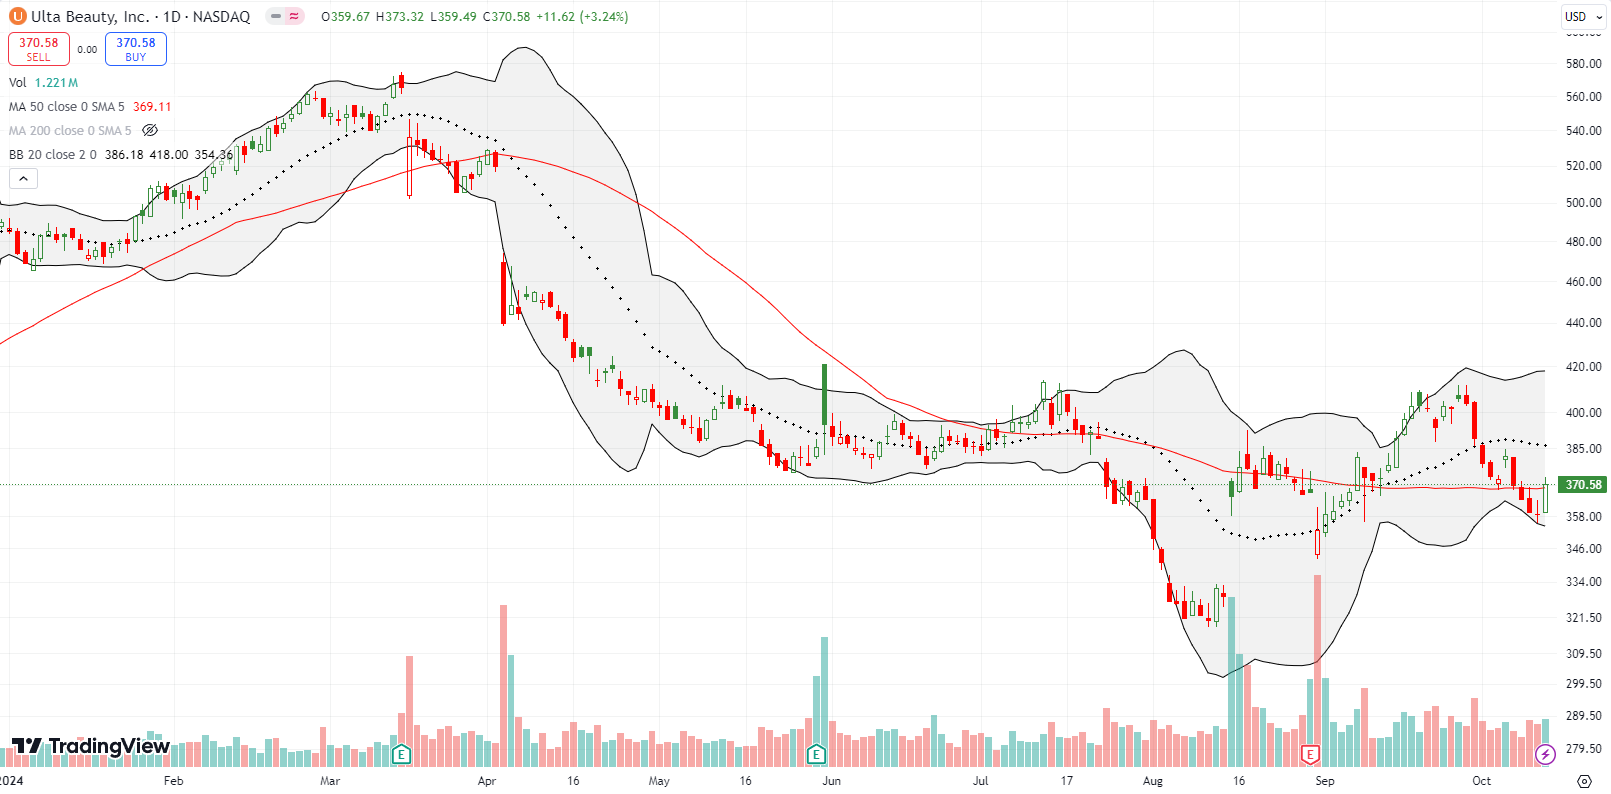
Ulta Beauty, Inc (ULTA) looked like one of many consumer discretionary stocks making impressive rebounds. A 50DMA breakout fizzled out right at ULTA’s summer highs. I bought into a successful test of 50DMA support with shares and then a call spread. The shares stopped out when ULTA broke below its 50DMA. I will have to bail on the call spread if ULTA reverses from Friday’s attempt to recover 50DMA support.
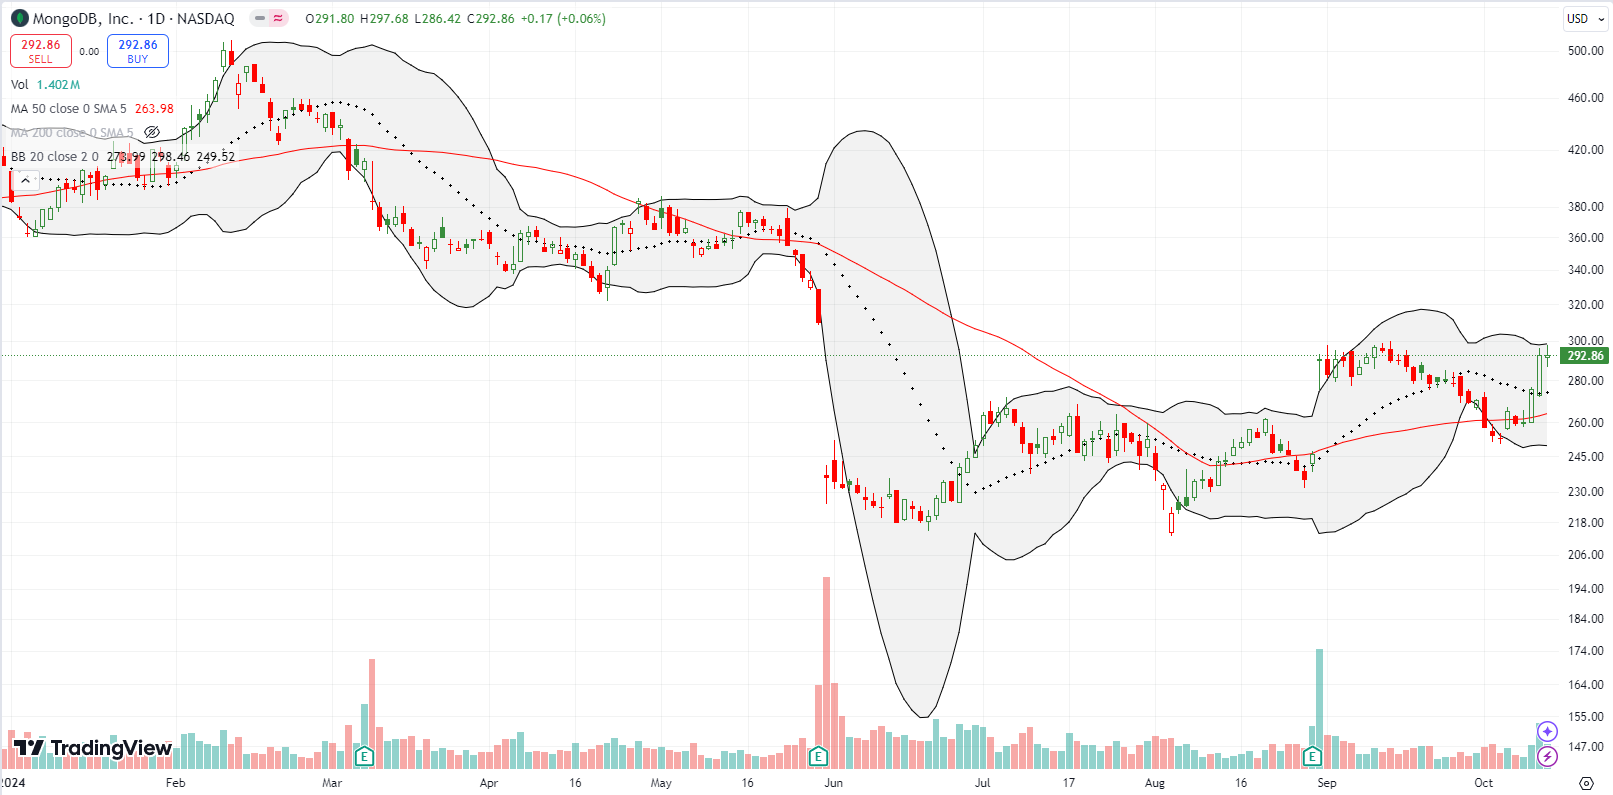
MongoDB, Inc (MDB) carved out an impressive rebound from 50DMA support. I bought shares on Thursday’s confirmation of support. Now MDB faces a big test at its post-earnings high. I am interpreting MDB’s 18.3% post-earnings gain as the beginning of a full recovery from May’s post-earnings gap down.
Snowflake Inc (SNOW) is trying to turn around again. I added to shares on the confirmed 50DMA breakout. I am sticking by this expensive database software stock based on insider purchases by executives. This turn is only confirmed by a higher high above the close before the August post-earnings gap down.
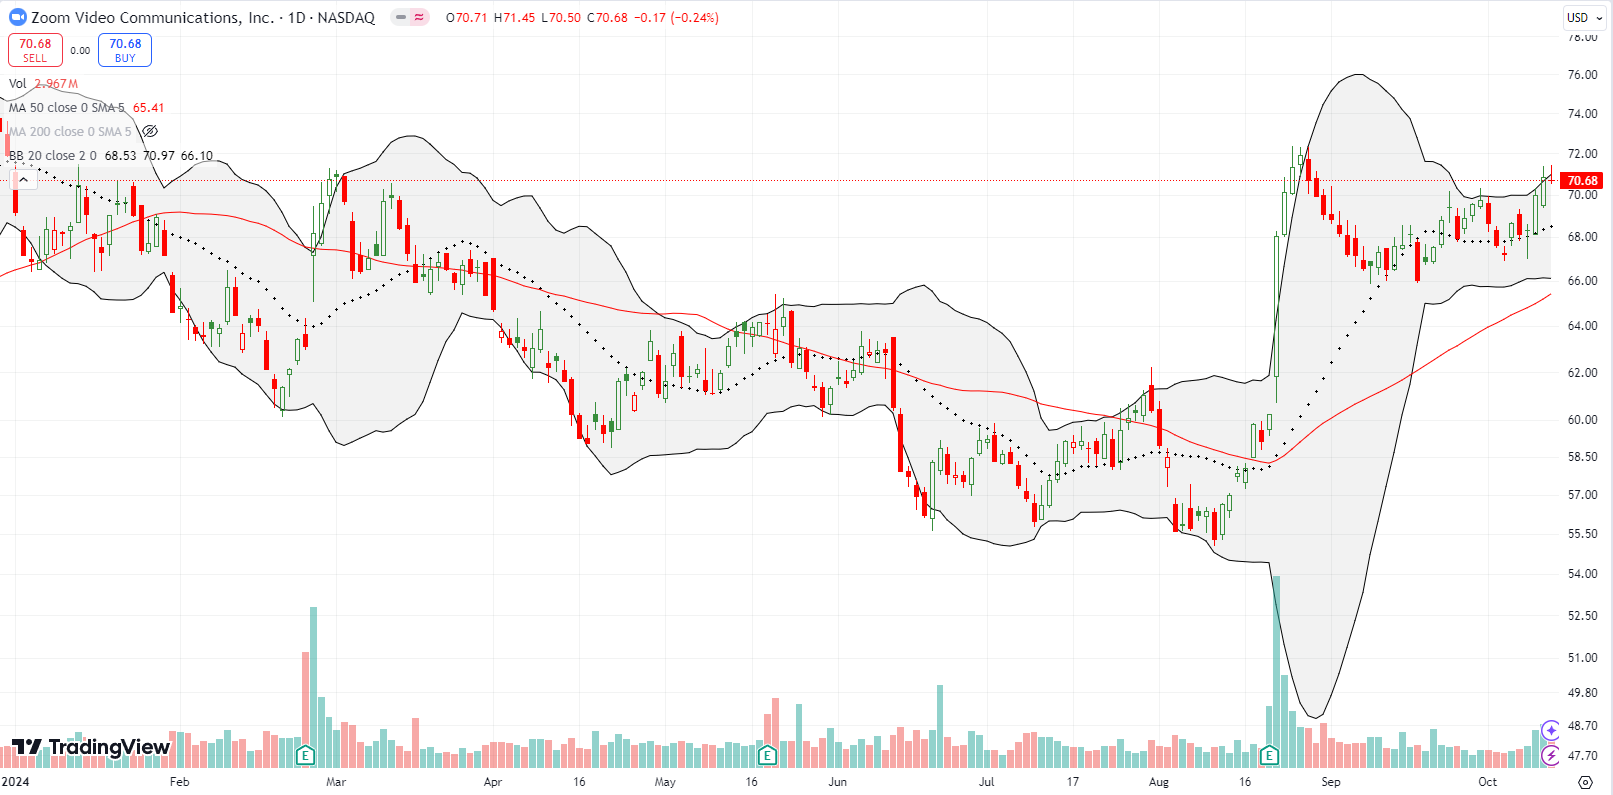
Zoom Video Communications, Inc (ZM) has been my favorite “hope” trade. I bought shares as ZM drifted into 20DMA support (the dashed line). ZM has not looked this good the entire time it has struggled in a now two year trading range. I am sticking by this one on the assumption that at some point, the stock will look “cheap” enough for bargain hunters to swoop in with force.
Be careful out there!
Footnotes
Subscribe for free to get email notifications of future posts!
“Above the 50” (AT50) uses the percentage of stocks trading above their respective 50-day moving averages (DMAs) to measure breadth in the stock market. Breadth defines the distribution of participation in a rally or sell-off. As a result, AT50 identifies extremes in market sentiment that are likely to reverse. Above the 50 is my alternative name for “MMFI” which is a symbol TradingView.com and other chart vendors use for this breadth indicator. Learn more about AT50 on my Market Breadth Resource Page. AT200, or MMTH, measures the percentage of stocks trading above their respective 200DMAs.
Active AT50 (MMFI) periods: Day #223 over 20%, Day #122 over 30%, Day #46 over 40%, Day #21 over 50%, Day #1 over 60% (1st day of overperiod ending 8 days under 60%), Day #61 under 70%
Source for charts unless otherwise noted: TradingView.com
Full disclosure: long SPY put spread, long IWM shares and call options, long QQQ put spread, long RDFN, long ULTA call spread, long TSLA shares and put option, long MDB
FOLLOW Dr. Duru’s commentary on financial markets via StockTwits, Twitter, and even Instagram!
*Charting notes: Stock prices are not adjusted for dividends. Candlestick charts use hollow bodies: open candles indicate a close higher than the open, filled candles indicate an open higher than the close.


