Stock Market Commentary
The week’s trading was punctuated by a single day with an all-time high on the S&P 500 and the NASDAQ in the wake of strong readings on the May S&P Global US Services PMI and the May ISM Non-Manufacturing Index. Unfortunately, that price milestone failed to change the contour of market breath which overall waned for the week. One-month lows in market breadth rendered judgment on a mixed jobs report for May.
Like the top indices versus market breadth, the establishment survey component of the jobs report painted a much rosier picture of the economy than the household survey. Moreover, while wage growth surged above the inflation rate, the unemployment rate hit 4% for the first time since January, 2022. The bond market sank while the top indices idled and watched the angst with bemusement. This week’s coming meeting for the Federal Reserve promises to put a fresh spin on how to interpret this mix.
Last week was also a week I decided to hunt a little more for hedges. I went out to October and bought an SPY $495/$480 put spread. I am starting to think a major sell-off ahead of the Presidential election is increasingly unlikely, but I also do not want to get complacent. The volatility index (VIX) plunged the last three days of the week and is close to returning to the previous 4+ year lows.
The Stock Market Indices
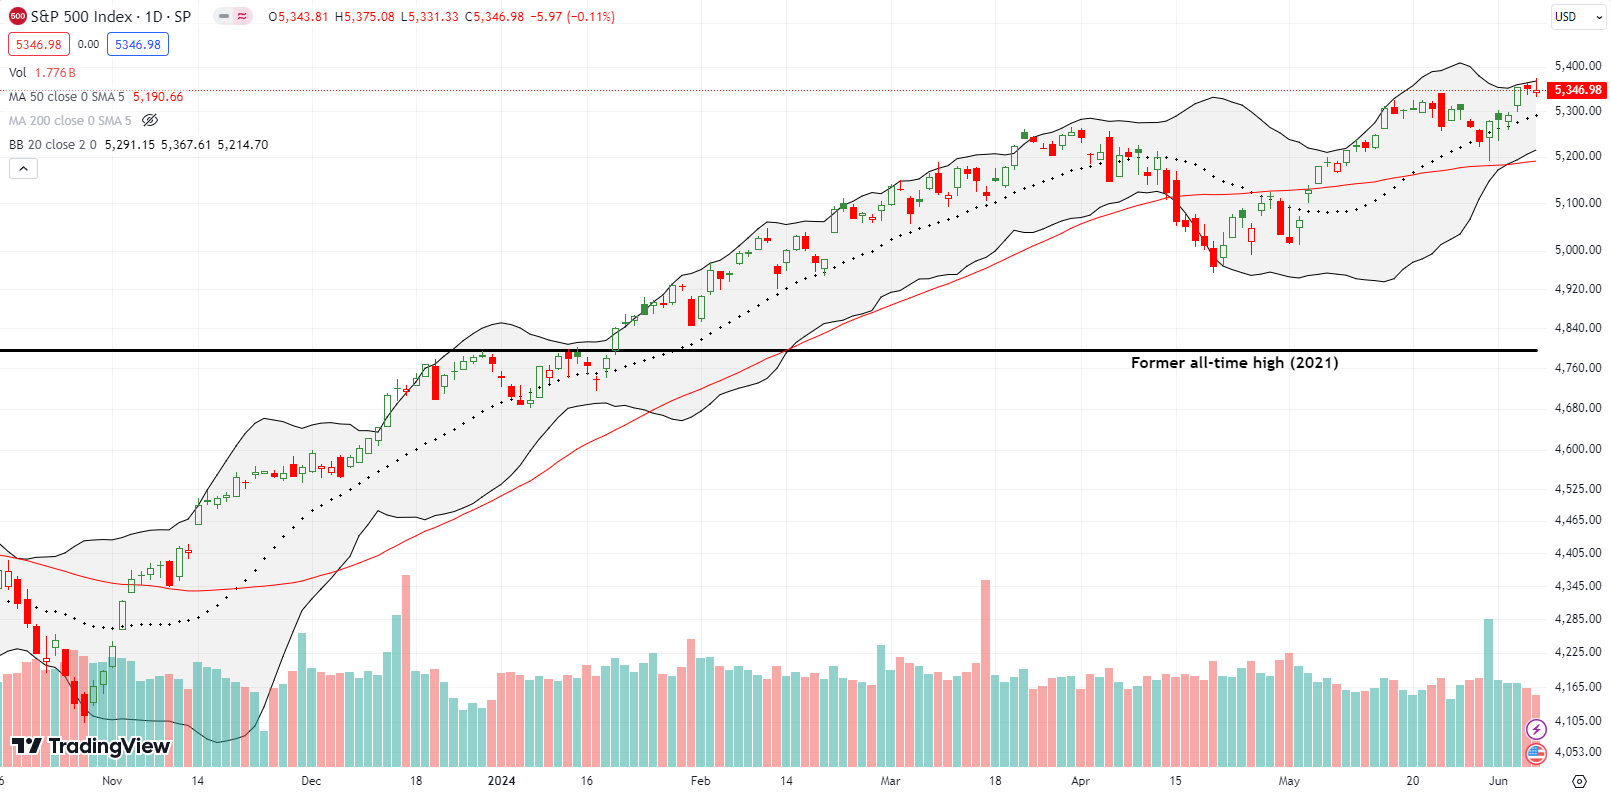
The S&P 500 (SPY) jumped to an all-time high on Wednesday with a 1.2% gain on the day. The move confirmed support at the the 20-day moving average (DMA) (the dotted line) and further confirmed support at the 50DMA (the red line). The index promptly went into a pause mode ahead of Friday’s employment report and barely responded to the downside after the report’s release. The S&P 500 looks well-positioned to continue rallying into the coming Fed meeting. The index should at least hold 20DMA support.
The NASDAQ (COMPQ) gapped up on Wednesday and gained 2.0% on the day. Like the S&P 500, the tech-laden index essentially flatlined going into the close of the week. The NASDAQ also looks poised to rally into the Fed meeting.
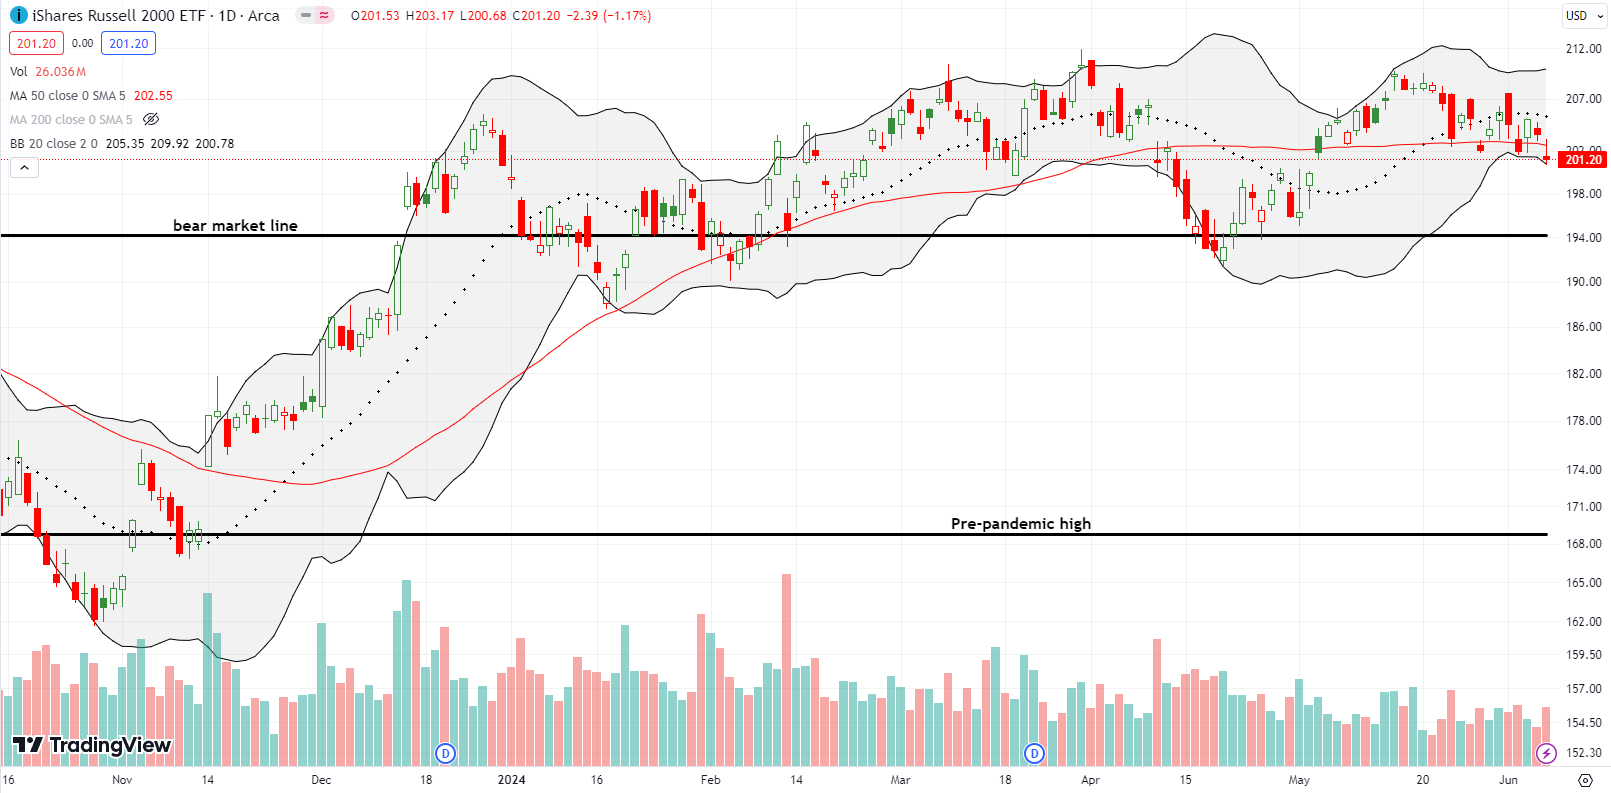
The iShares Russell 2000 ETF (IWM) significantly lagged the S&P 500 and the NASDAQ. Higher bond yields following the employment report seemed to weigh on the ETF of small caps. Not only did IWM completely fade its small pop on Wednesday, but also IWM set a fresh one-month low. IWM is barely clinging to a pivot around its 50DMA. I still added to my dying June $209 call position with a June $203.
The Short-Term Trading Call With Market Breadth Waned
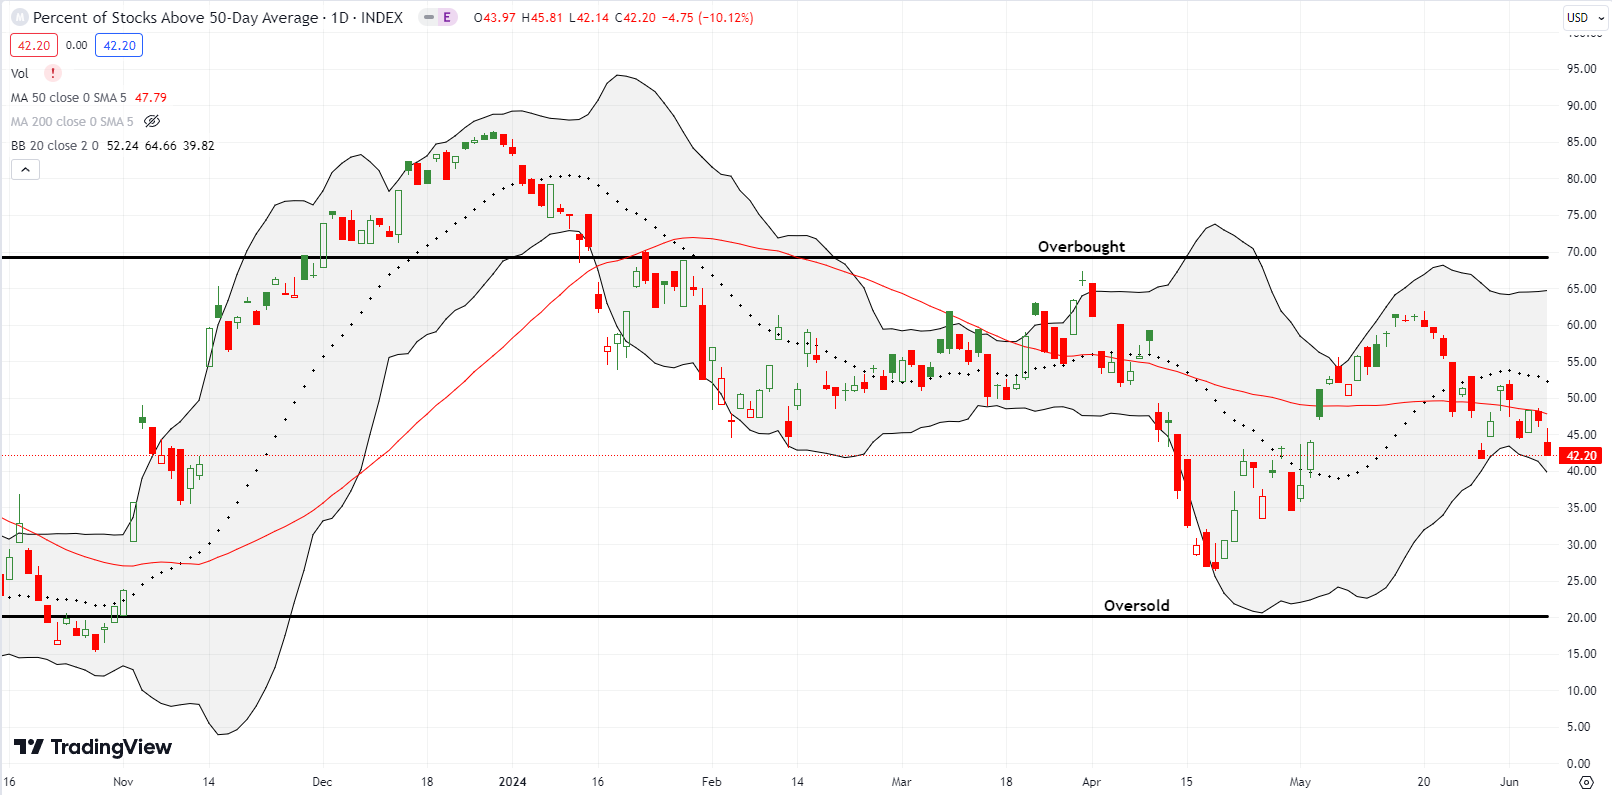
- AT50 (MMFI) = 42.2% of stocks are trading above their respective 50-day moving averages
- AT200 (MMTH) = 54.7% of stocks are trading above their respective 200-day moving averages
- Short-term Trading Call: cautiously bullish
AT50 (MMFI), the percentage of stocks trading above their respective 50DMAs, closed the week near its May low. My favorite technical indicator waned from 48% to 42% on Friday and highlighted a sharp divergence from the S&P 500’s all-time highs. This divergence is a yellow flag. However, I am not quite ready to call a bearish divergence given the potential for AT50 to rebound in the coming week. If instead AT50 breaks to new lows, I will downgrade the trading call from cautiously bullish to neutral.
In my last Market Breadth post, I asked “Did Retail Save the Market from An NVDA Hangover?” The answer appeared to be “yes”, and retail caught my eye again last week despite SPDR S&P Retail (XRT) losing 1.9% for the week. I even bought XRT June put options on Friday (hedges).
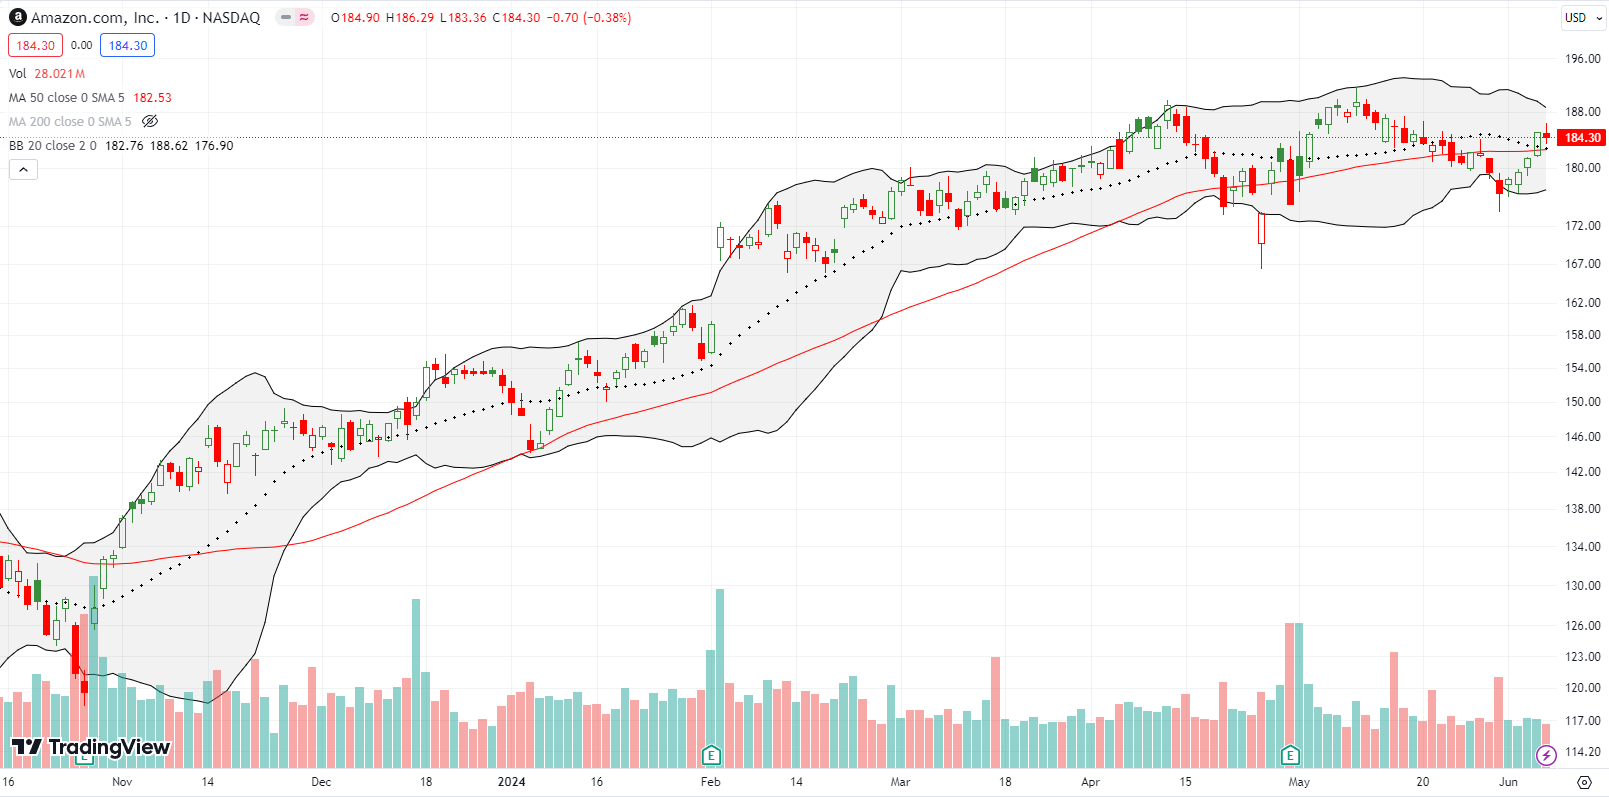
Amazon.com (AMZN) lagged the market in May. Last week, it poked its nose above its converged 20DMA and 50DMA trend lines of resistance. I jumped into a June call spread on the breakout. Note that AMZN has already traveled a post-earnings roundtrip in price. AMZN is number 31 in the list of XRT components with a 1.4% allocation of the ETF.
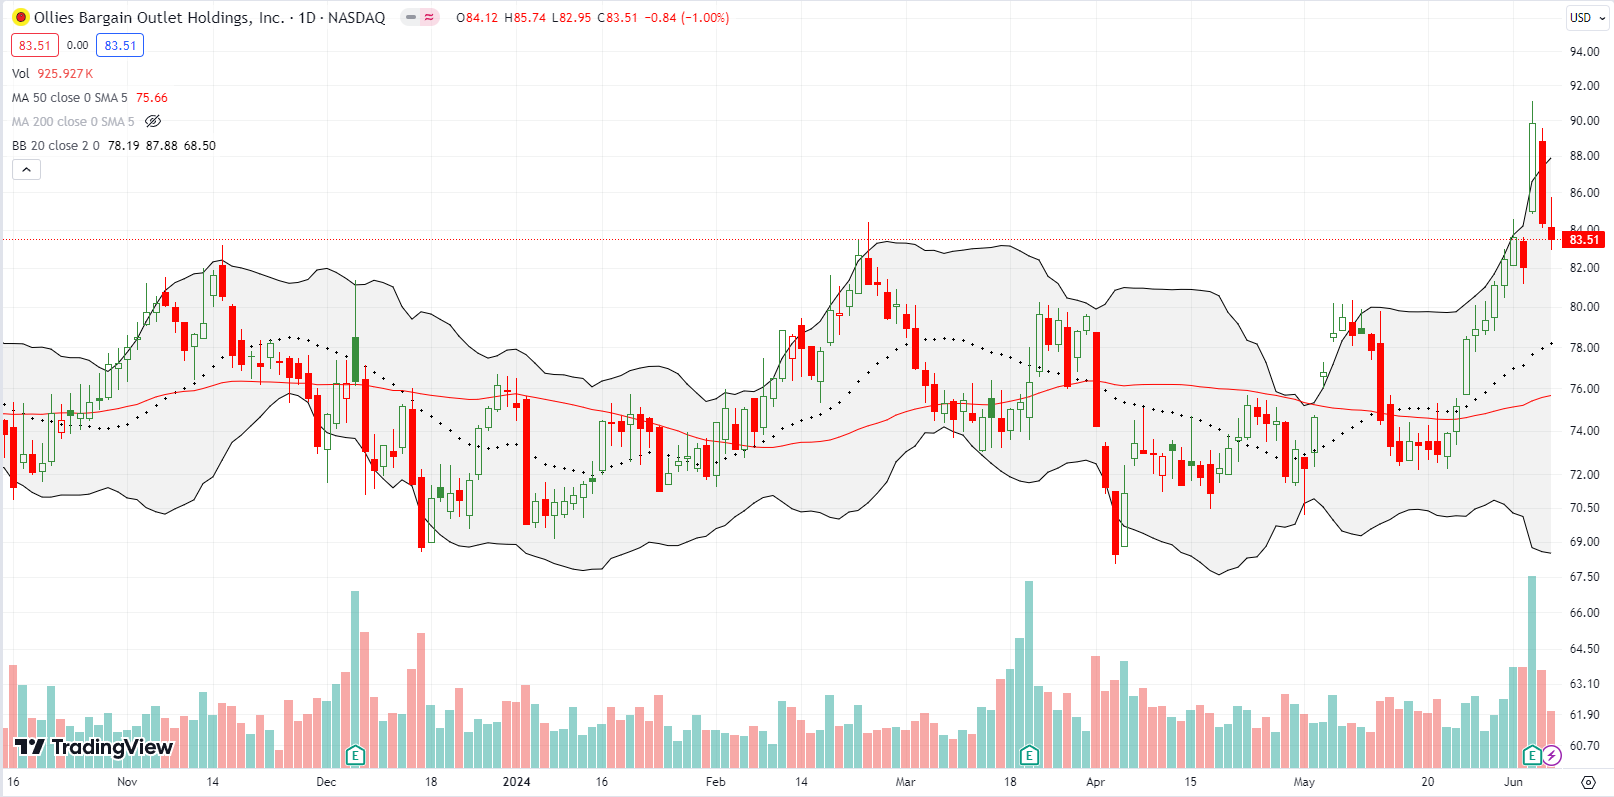
Ollie’s Bargain Outlet Holdings, Inc (OLLI) looked great on a 9.5% post-earnings surge and breakout to a 2-year high. For whatever reason, investors immediately changed their collective minds and nearly reversed the entire move in two days. I am looking to buy OLLI if price gets above Friday’s intraday high. According to swingtradebot, OLLI is set up for a classically bullish “calm after the storm.” Per swingtradebot: “This finds stocks which have recently had a significant range expansion and are now experiencing range contraction. A trader can use the contraction to anticipate a return to an expansion phase. One idea would be to enter a trade as price exceeds the range of the contraction bar with a stop-loss at the other extreme of the contraction bar.” These patterns often occur after post-earnings fades.
OLLI is number 20 in the list of XRT components with a 1.5% allocation of the ETF.
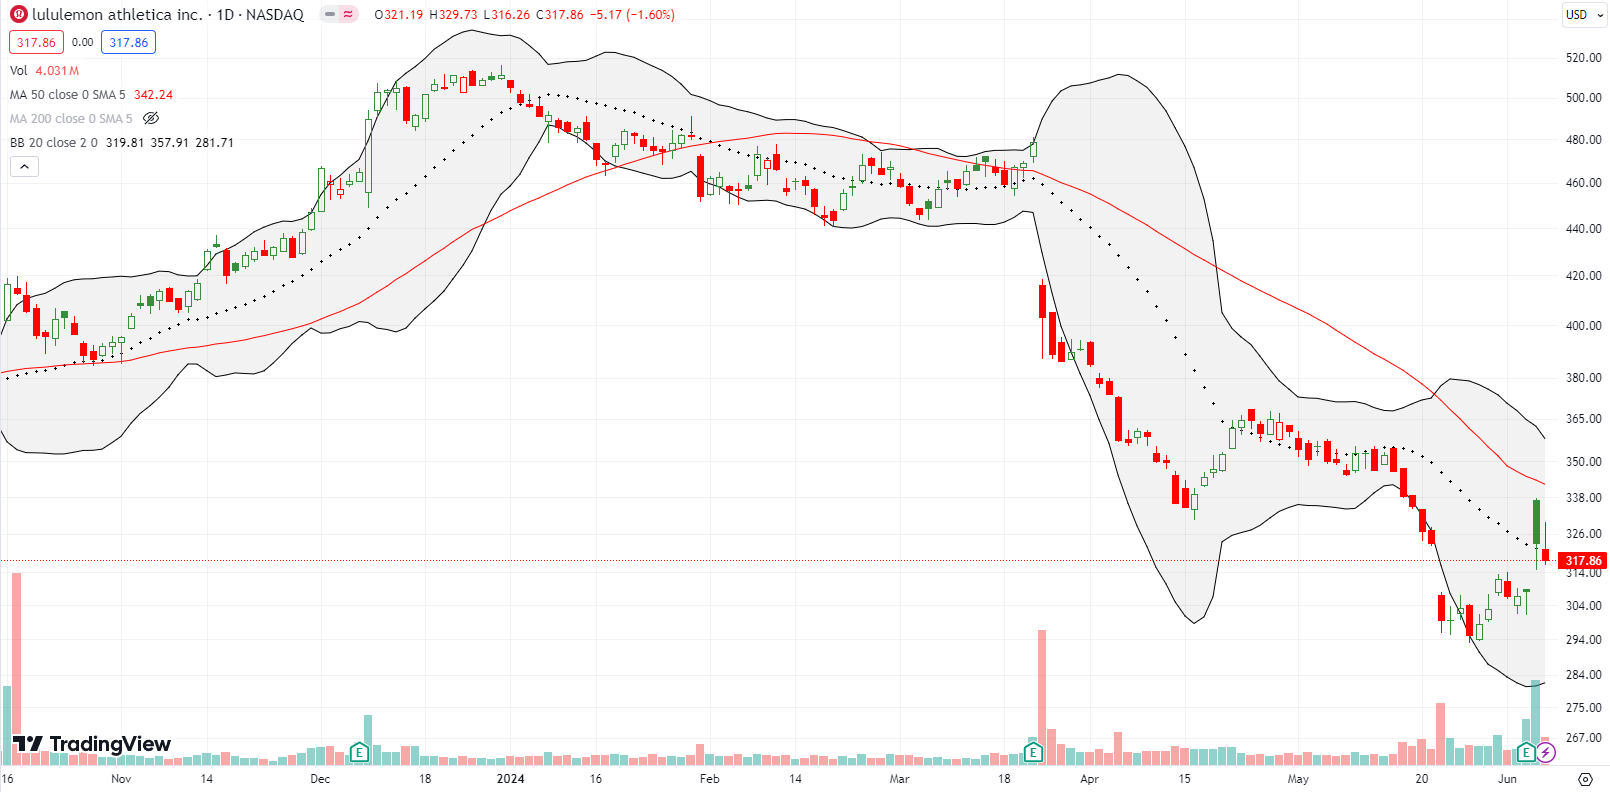
lululemon athletica Inc (LULU) has made the news all year for a major pullback. After losing as much as 42% year-to-date, you can bet management felt a lot of pressure to deliver some good news during last week’s earnings. They did their best to deliver the goods. The company increased earnings guidance for the year and significantly ramped up its stock buyback program by another $1B to a $1.7B authorization. The company burned up $530M in the previous two quarters buying stock, so clearly the repurchases alone create an insufficient buying thesis. The stock promptly gapped up post-earnings but faded short of declining 50DMA resistance.
Walmart Inc (WMT) is carrying the banner for retail. WMT pulled off a bullish resolution to a Bollinger Band (BB) squeeze after posting a well-received earnings report. Buyers pretty much continued to pile in the stock until Friday’s 1.9% pullback. I consider WMT a buy on dips.

GameStop Corporation (GME) was the star retail company of the week. I am flabbergasted that this struggling retailer is back in the meme stock spotlight. I asked my son about GameStop given he is an avid gamer. He told me he does not like the stores, but it is the only place to get certain games and consoles. GME is once again the place to witness meme stock madness: a hoard of buyers rushing into a stock to answer the call of a cult figure who is relying on the following to make his already substantial position even larger.
The company promptly took advantage of the surge in price by doing a secondary along with a (mandatory?) early revelation about its poor business performance in the past quarter (once again management skipped out on holding a conference call where they would have to answer tough questions). Revenues declined 29%. The stock lost 39% in response. Still, GME ended the week UP 22%. The stock is currently holding 20DMA support.
Even if Roaring Kitty fails to get even richer off his mind-boggling GME position, GameStop is enriching itself. This latest offering of 75M shares adds to 45M shares it sold earlier for a cool stash of $933.4M. That is almost the entire $1.083B of its cash and cash equivalents on hand.

I recently added Vertiv Holdings, LLC (VRT) to my generative AI trade (I should rename this basket to the AI trade). The accumulated position looked good until last week’s 50DMA breakdown. Now I need to brace myself for an extended sell-off. Just like any member of the unapologetically bullish basket, I will look to add to my position at key support levels. Next up for consideration would be a complete reversal of the April earnings gains.
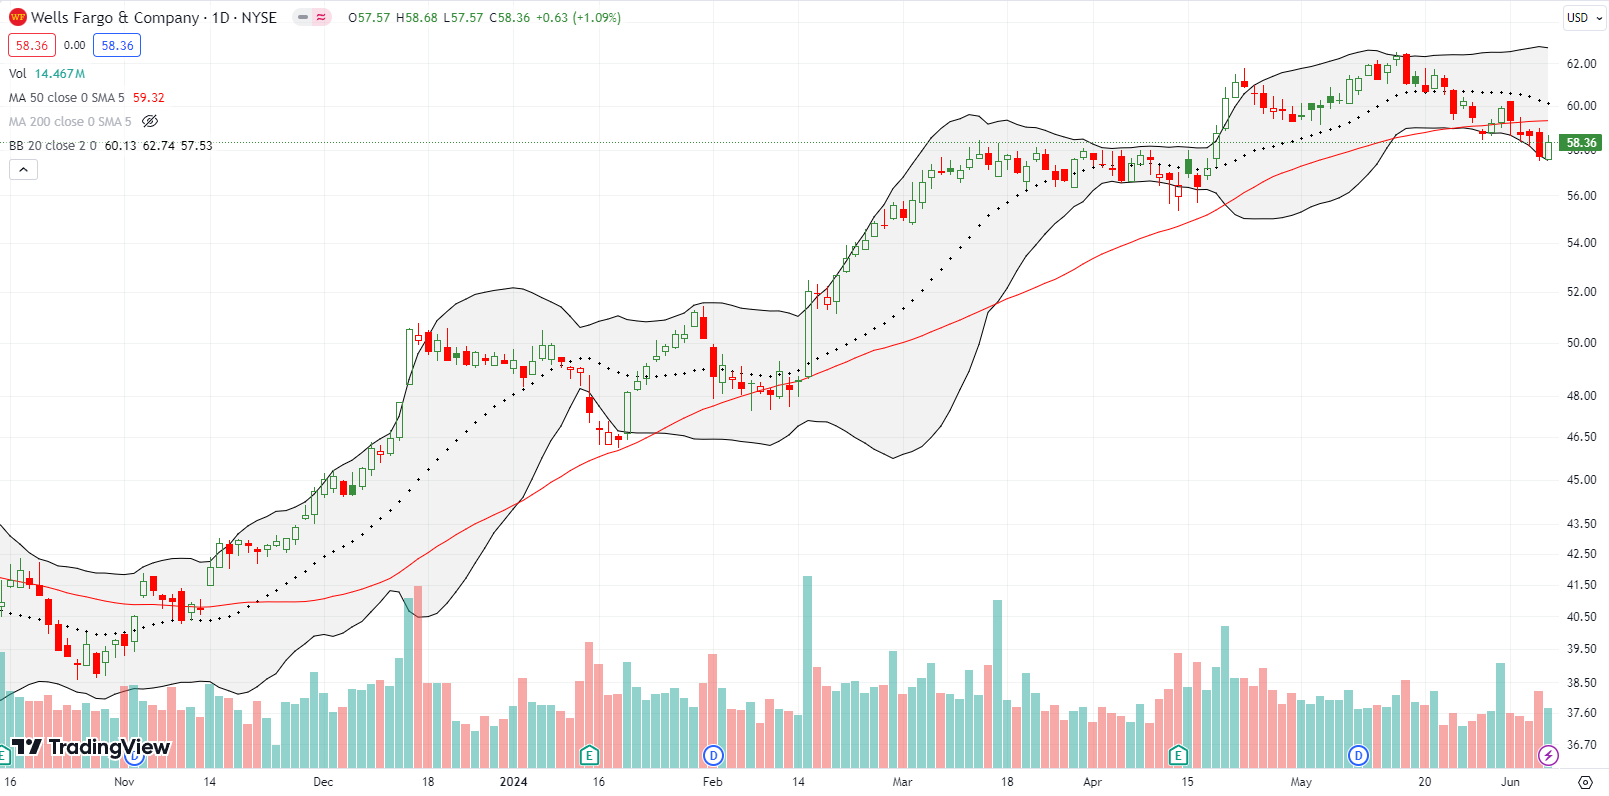
At the same time I flagged VRT, I noticed Wells Fargo & Company (WFC) making a surprise breakout. WFC promptly drifted downward and provided a soft entry point. The stock soon drifted to a new 6-year high. The move was so slow, I almost drifted to sleep. I took my slow profits, and I have watched the stock wane and drift its way into a confirmed 50DMA breakdown. Thus ends the bullish narrative for now.
Be careful out there!
Footnotes
Subscribe for free to get email notifications of future posts!
“Above the 50” (AT50) uses the percentage of stocks trading above their respective 50-day moving averages (DMAs) to measure breadth in the stock market. Breadth defines the distribution of participation in a rally or sell-off. As a result, AT50 identifies extremes in market sentiment that are likely to reverse. Above the 50 is my alternative name for “MMFI” which is a symbol TradingView.com and other chart vendors use for this breadth indicator. Learn more about AT50 on my Market Breadth Resource Page. AT200, or MMTH, measures the percentage of stocks trading above their respective 200DMAs.
Active AT50 (MMFI) periods: Day #136 over 20%, Day #35 over 30%, Day #26 over 40% (overperiod), Day #5 under 50% (underperiod), Day #14 under 60%, Day #103 under 70%
Source for charts unless otherwise noted: TradingView.com
Full disclosure: long IWM calls, long VRT, long XRT puts, long AMZN call spread
FOLLOW Dr. Duru’s commentary on financial markets via StockTwits, Twitter, and even Instagram!
*Charting notes: Stock prices are not adjusted for dividends. Candlestick charts use hollow bodies: open candles indicate a close higher than the open, filled candles indicate an open higher than the close.





1 thought on “Market Breadth Waned Despite Stock Market All-Time Highs – The Market Breadth”