
Housing Market Intro and Summary
What happened in the housing market in April, 2024? After four months of growing more positive, home builders proceeded into the spring selling season thanks to drag from the South. In my previous Housing Market Review, I pointed out a positive start to the spring selling season. April painted a much different picture with topping stocks of home builders and definitive headwinds for home sales, especially with mortgage rates marching higher again.
- The stocks of home builders are generally rolling over and forming topping patterns.
- Builder sentiment flattened and ended a 4-month streak of gains. The Southern region was the sole drag on sentiment.
- Single-family housing starts may be stabilizing around the 1M level as a 13-month streak of sequential gains ended for building permits.
- New home sales started the spring selling season with big gains that took sales well above last spring’s launch.
- A bottom for existing home sales was called into question as cash buyer and investors beat a hasty retreat from the market. The resulting sharp sequential decline in sales stood in sharp contrast to the jump in new home sales.
- Pricing strength in higher-end homes revealed a sharp dichotomy in California’s market for existing homes.
- Renting is now cheaper than buying a home in each of the U.S.’s 50 largest metros.
Housing Stocks
The iShares US Home Construction ETF (ITB) recorded its last all-time high on the last trading day of March. From there, ITB lost a whopping 10.3% for April and far under-performed the 4.2% loss in the S&P 500 (SPY). This widening performance gap not only confirmed the end of the seasonal trade on home builders but also the underperformance signals a likely sustained top for home builder stocks. ITb has dropped back into its former trading range and nearly erased all its gains for the year.
")
Century Communities (CCS) delivered one of the sharpest topping patterns by rolling over in April and adding a post-earnings pullback last week. This sharp reversal was a reminder of the risks in chasing “late season” buys in home builders!
")
D.R. Horton (DHI) overcame a poor start to the year only to confirm a fresh 50DMA breakdown ahead of April earnings. DHI gapped higher after earnings and then faded to a near flat close. DHI is down for the year and is on the edge of suffering further price weakness.
")
Meritage Homes (MTH) is trying to buck the topping trend and weakness. Last week MTH jumped nearly 7% after posting earnings. The stock even survived an intraday reversal from the open (note how the 50DMA provided solid support for the price action). So far, the stock remains resilient although it has yet to break out above the year’s high.
")
Housing Data
Home Builder Confidence: The Housing Market Index – April, 2024
The rebound in builder sentiment stalled after a 4-month streak of gains. April’s 51 stayed flat with the March National Association of Home Builders (NAHB)/Wells Fargo Housing Market Index (HMI). The HMI component Single-Family: Next Six Months (Seasonally Adjusted) was the only one of the three components to fall. This component fell 2 points from a 9-month high.
Although confidence stalled, the NAHB reported on-going reduction in pressure to incentivize sales. The 22% share of builders cutting prices is down from 24% in March and significantly down from January’s 31% and December’s 36%. The average price discount somehow stayed flat at 6% for the tenth straight month. The share of builders providing incentives actually decreased from 60% in March to 57% in April. This share has remained in a tight range for several months.
/Wells Fargo Housing Market Index (HMI) and the University of Michigan Index of Consumer Sentiment")
Source for data: NAHB and the University of Michigan
Consumer sentiment has stalled alongside builder sentiment.
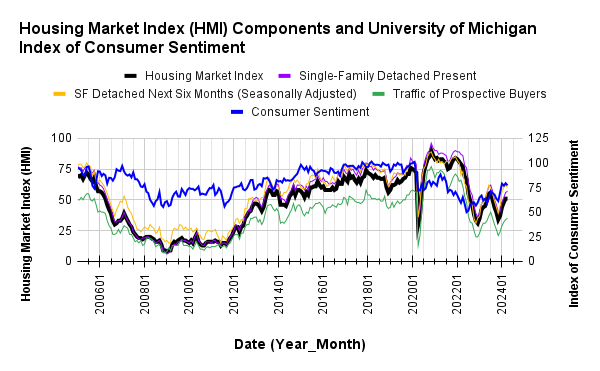
Despite the flat month-over-month performance for HMI, the regional changes were surprisingly distributed. Confidence jumped again in the Northeast, this time from 61 to 65. The West also jumped by 4 points from 45 to 49. The Midwest gained one point. So the South was the only region to fall, and its decline was a mere one point. Clearly, the South has an outsized weighting on HMI!
New Residential Construction (Single-Family Housing Starts) – March, 2024
Single-family housing starts dropped back to January’s levels. As long as starts do not fall significantly lower, I will assume that at worst starts are stabilizing around the 1M level. For March, single-family housing starts declined 12.4% month-over-month to 1,022,000, down from 1,167,000 (revised upward from 1,129,000). Starts continued year-over-year strength with a 21.2% gain. Recall that the favorable comparables will continue until May. In a previous Housing Market Review I claimed that year-over-year strength would begin to moderate; the peaks from November and March look like confirmations of the moderation.
![US. Bureau of the Census, Privately Owned Housing Starts: 1-Unit Structures [HOUST1F], first retrieved from FRED, Federal Reserve Bank of St. Louis, April 28, 2024](https://drduru.com/onetwentytwo/wp-content/uploads/2024/04/20240428_Housing-Starts.png "Housing starts")
Poor builder sentiment did not hinder intentions to build in 2023 and positive sentiment supported permit growth through February. However, building permits in March ended an impressive 13-month streak of sequential gains with a 4.7% decline from February. This sequential decline is significant compared to prior declines. Moreover, the year-over-year gain moderated for the second month in a row, from February’s 29.5% to 18.4% in March. Thus, I assume a new winning streak will not resume anytime soon. These changes also imply builders are finally getting close to the inventory levels they think they need to satisfy near-term demand.
The Northeast was the only region which failed to achieve a large year-over-year jump in housing starts. The Northeast, Midwest, South, and West each changed -22.4%, +15.0%, +13.8%, and +80.5% respectively year-over-year. The West suffered a particularly deep trough in starts a year ago. Starts in the region are still 16.2% below their last peak in July.
New Residential Sales (Single-Family) – March, 2024
March new home sales of 693,000 increased 8.8% above February’s sales. February sales were revised downward from 662,000 to 637,000. Sales increased 8.3% year-over-year. So far so good on my earlier expectation for new home sales to jump with the spring selling season.
![US. Bureau of the Census, New One Family Houses Sold: United States [HSN1F], first retrieved from FRED, Federal Reserve Bank of St. Louis, April 28, 2024.](https://drduru.com/onetwentytwo/wp-content/uploads/2024/04/20240428_New-Home-Sales.png "new home sales")
The median price jumped 6.0% from February’s 2 1/2 year low to hit $430,700, also a decline of 1.9% year-over-year. The year-over-year changes still look like they have bottomed, and the most recent downtrend looks like it came to end on the heels of March’s surge.
A sharp shift in sales to homes priced near or above the (previous) median looks responsible for the sudden surge in price. Each price tier above $400,000 gained in share from February’s mix. Yet, the year-over-year changes in price did not demonstrate such a dramatic shift so another strong spring selling season looks like a main price driver.
March’s inventory was 8.3 months of sales, little changed from the 8.4, 8.3, and 8.2 of previous months. Absolute inventory increased from 463,00 to 477,000 or up 3.0%. On a month of sales basis, the new home market remains well-supplied given 6 months of sales is considered a balanced market.
In November, the South stuck out as the one region with a year-over-year decline in sales. The same surprise occurred for February. For March, new home sales in the South jumped off recent lows with a 7.7% sequential gain, thus staying in a 2-year sales range. As the nation’s largest region of housing, I continue to monitor the South’s drag on the national numbers. For now, in March, the Northeast was the one region that failed to record a year-over-year gain in sales. The Northeast, Midwest, South, and the West changed -13.2%, +23.4%, +4.5%, and +18.8% respectively.
Existing Home Sales – March, 2024
Hopefully existing home sales are still bottoming. March’s setback was sharp enough to throw a bottoming into question given the launch of the spring selling season. The seasonally adjusted annualized sales in March of 4.19M declined 4.3% from February’s 4.38M (unrevised) while also decreasing 3.7% year-over-year. I previously assumed that the momentum off the recent lows would deliver year-over-year gains in sales.

(For historical data from 1999 to 2014, click here. For historical data from 2014 to 2018, click here) Source for chart: National Association of Realtors, Existing Home Sales© [EXHOSLUSM495S], retrieved from FRED, Federal Reserve Bank of St. Louis, April 29, 2024

Sales of condos and coops took another step closer to their pandemic era lows. This potential warning sign on existing sales has yet to trigger commentary from the NAR. Perhaps a recovery for these sales requires a rebound in the share of first-time home buyers.
March’s absolute inventory of 1.11M homes was up 4.7% month-over-month and up 14.4% year-over-year. The January report was supposed to herald a change in market dynamics with both increased supply and demand. Clearly, the dynamics are not yet solidified. According to the NAR, “unsold inventory sits at a 3.2-month supply at the current sales pace, up from 2.9 months in February and 2.7 months in March 2023.”
The median sales price of an existing home continues to look like it is ending a downtrend even with the current stall in the recovery for existing home sales. The median price increased 2.5% month-over-month, a second sequential gain in a row and the second gain since June, 2023. An increase of 4.8% year-over-year created the 8th straight year-over year gain. I was surprised the NAR did not comment on this price strength in the face of declining sales and the affordability implications.
The average time on market for an existing home fell back to 33 days after leaping by 7 days in February to 38 days. This average time was 29 days a year ago. I thought buyers in February were enjoying the ability to take a little more time with more available inventory. Now these data look a bit noisy. At least a drop in time on market is consistent with stronger demand.
The share of sales to first-time home buyers soared back up from 26% in February to 32% in March. The share was 28% a year ago. All cash buyers and investors staged a major retreat from the market and presumably were primary drivers of March’s sales decline. This was a 180 degree shift from February when first-timers retreated. I previously stated that a healthy spring selling season required participation from first-time home buyers. So I did not expect their share to surge while sales actually declined (sequentially). Overall, their share continues to drift up and down. The NAR’s 2017 Profile of Home Buyers and Sellers reported an average of 34% for 2017, 33% for 2018, 33% for 2019, 31% for 2020, 34% for 2021, 26% for 2022, and 32% for 2023.
In January, the West was a surprising exception to the regional year-over-year declines in sales. All regions declined in February and March. The regional year-over-year changes were: Northeast -3.8%, Midwest -1.0%, South -5.0%, West -3.7%.
As usual, every region experienced a year-over-year price increase. The regional year-over-year price changes were again substantial for the Northeast: Northeast +9.9%, Midwest +7.5%, South +3.4%, West +6.7%.
Single-family existing home sales decreased 4.3% from February and declined on a yearly basis by 2.8%. The median price of $397,200 was up 4.7% year-over-year and up 2.4% month-over-month, the second sequential increase in a row and the first increases since June, 2023.
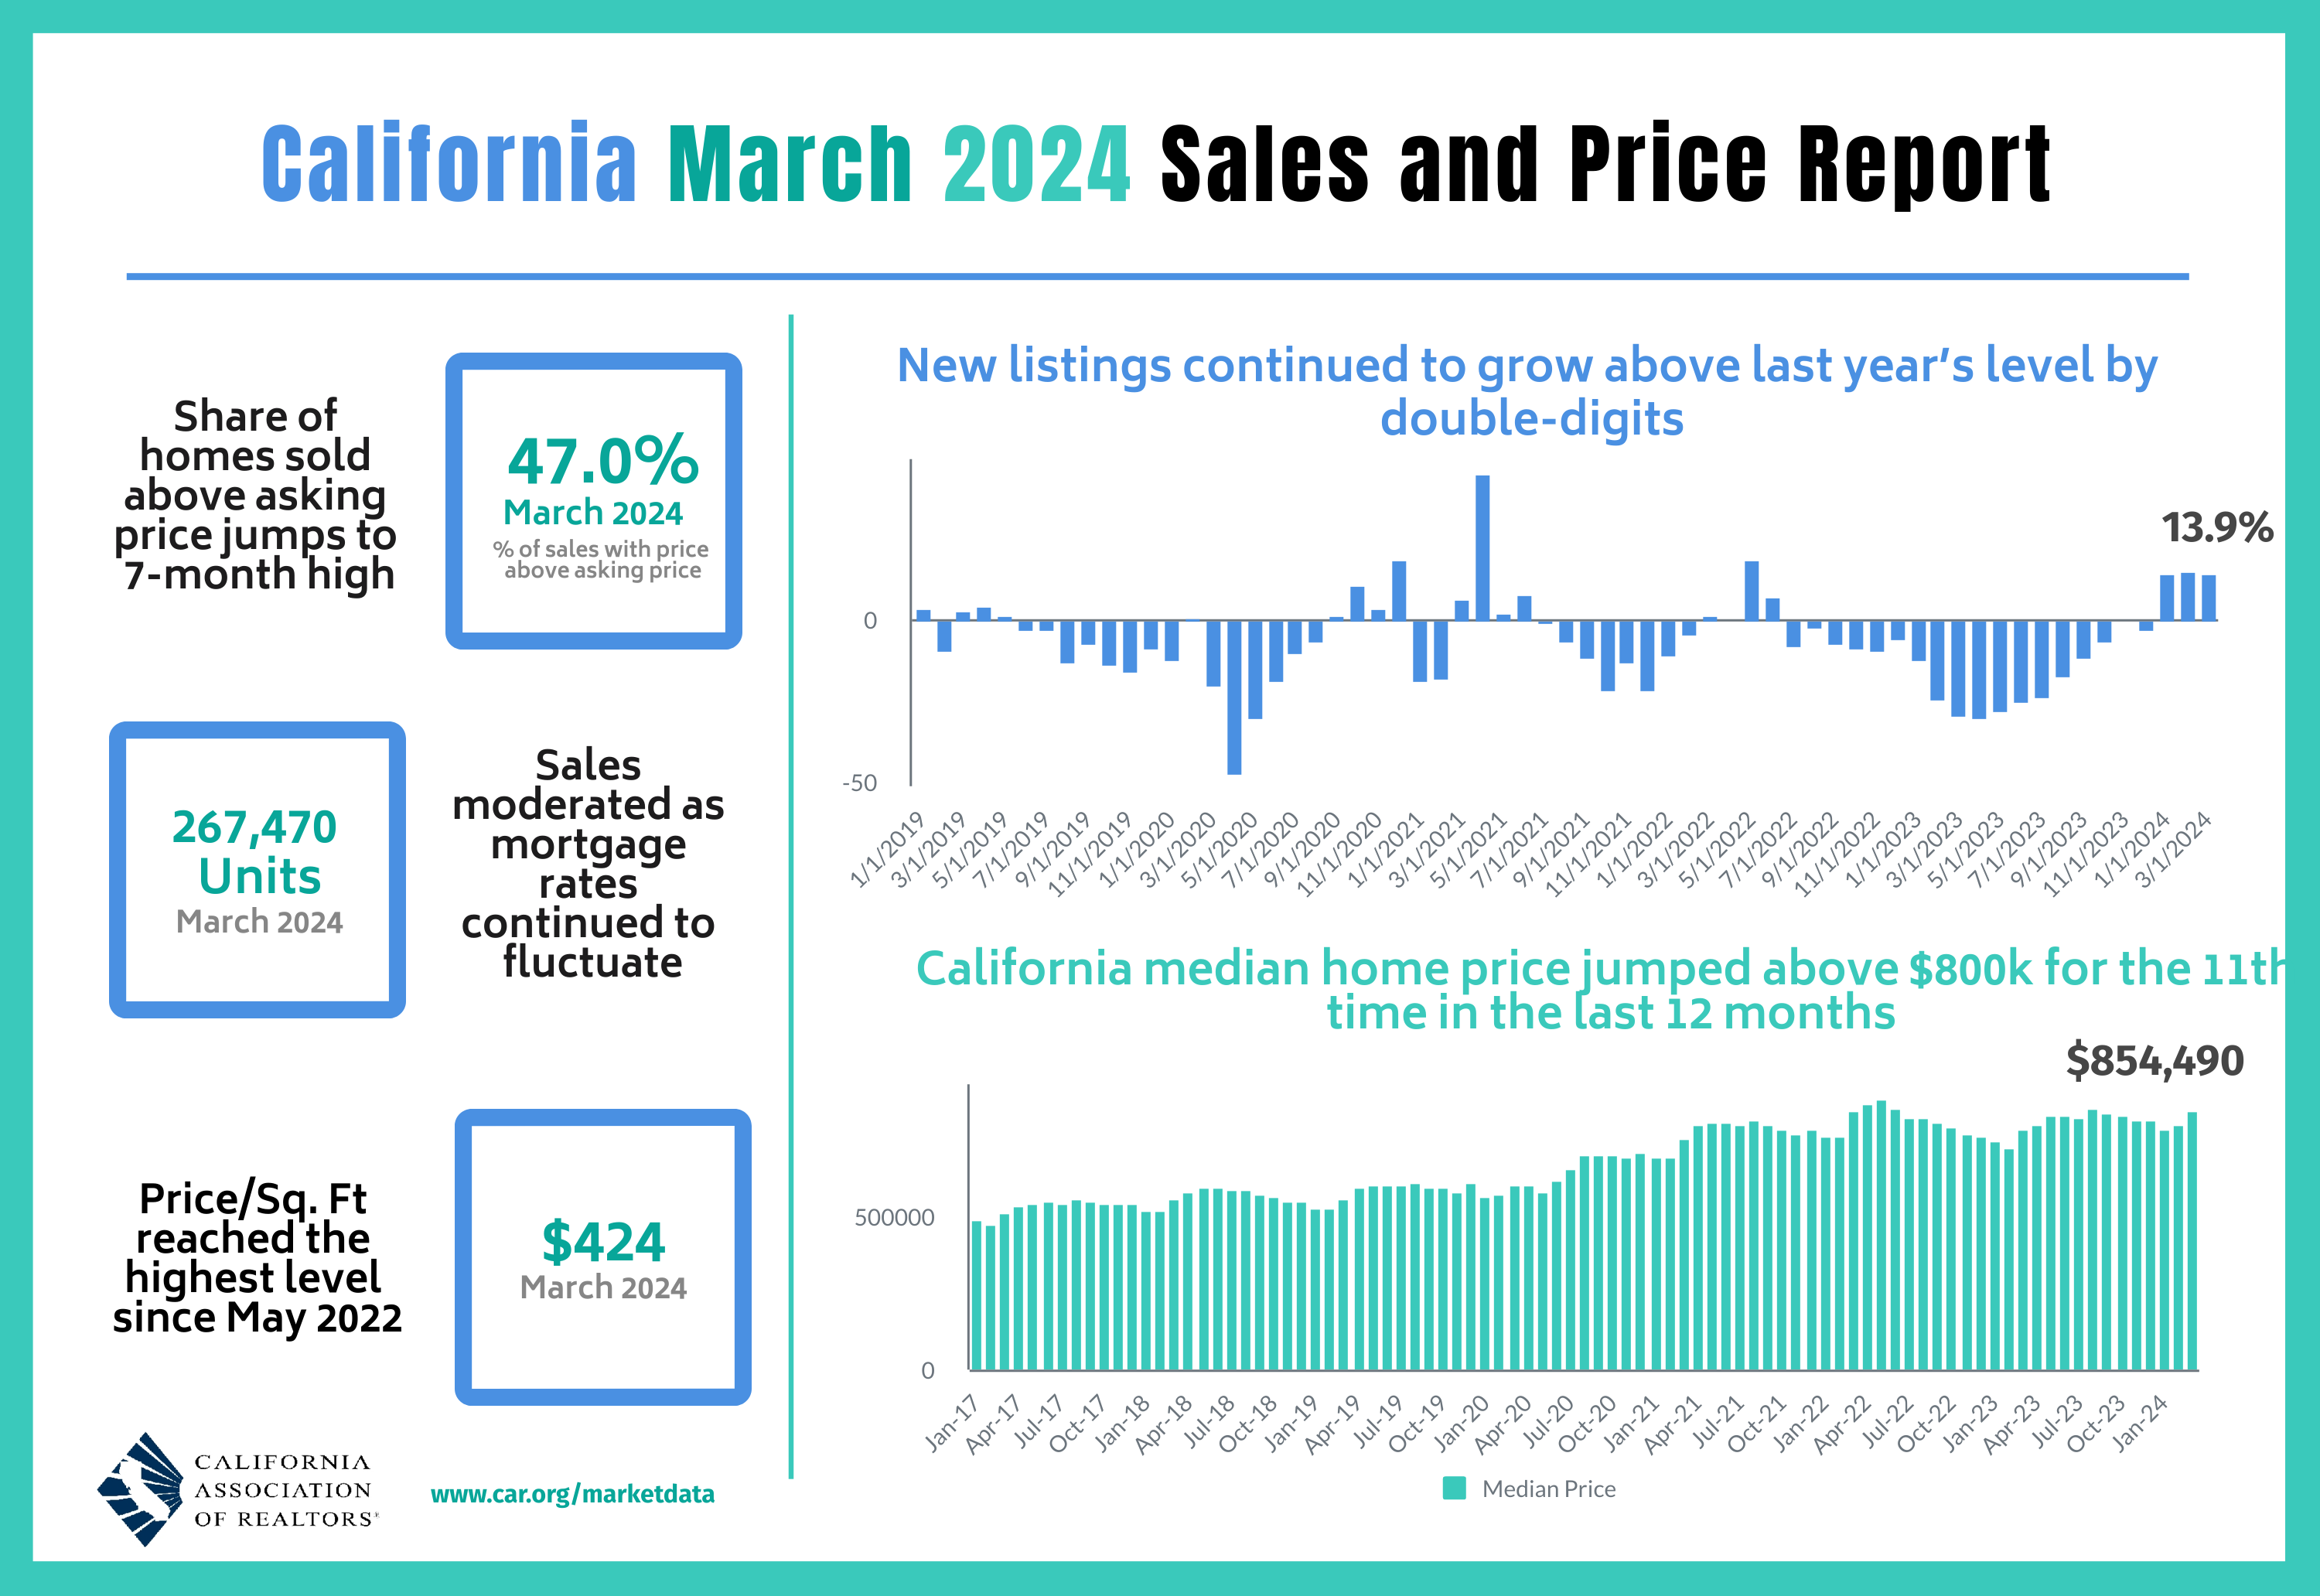
California Existing Home Sales – March, 2024
California’s existing home market experienced a brief surge after 30 months of yearly declines, returning sales to September 2022 levels. However, the market showed signs of slowing down just as the spring selling season began. According to the latest report from the California Association of Realtors (C.A.R.), existing single-family home sales totaled 267,470 in March, marking a 7.8% decrease from February and a 4.4% drop from March 2023. This recent downturn sharply contrasts with the early 2024 gains but is consistent with the overall national decline in sales.
Despite the sales pullback, the median home price in March jumped to $854,490, a gain of 6.0% from February and a 7.7% increase from the $793,260 median price in March 2023. This ongoing rise, marking the ninth consecutive month of year-over-year gains, highlights an enduring strength in California’s higher-end market segments. Indeed, homes priced at or above $1 million demonstrated strong year-over-year growth of 9.9%, while more affordable segments saw modest declines (homes priced under $500,000 dropped in sales by 2.4%).
The median time it took to sell a home in California significantly declined again, this time from 22 days in February to 19 days in March. It took 24 days a year ago. This decrease underscores the market’s competitive nature despite the overall slowdown in sales and paints the a picture of a sharp dichotomy in California’s housing market.
The statewide sales-price-to-list-price ratio was 100.0% for the second month in a row, nearly unchanged from 99.1% in March 2023. Additionally, the price per square foot for an existing single-family home in California was $424 in March, a 9.5% surge from the $387 a year ago. Given this increase outpaced the overall median price trends, it further highlights the dominance of higher-end sales.
Inventory dynamics also shifted. The Unsold Inventory Index (UII) dropped again, this time to 2.6 months in March from 3.0 months in February. This change marks an increase from 2.1 months in March 2023.
Looking ahead, C.A.R. President Melanie Barker noted that while the market lost momentum in March, it remained competitive with strong price trends and rapid turnover. However, C.A.R.’s Chief Economist Jordan Levine cautioned that further challenges may lay ahead with elevated mortgage rates.
Home closing thoughts
Time to Rent and Shelve Those Ownership Dreams?
“For those weighing whether they should rent or buy a home right now, all signs point to renting as the more cost-effective option in most major U.S. cities.” This was the ominous leading sentence in a study by Bankrate comparing renting versus buying a home. The affordability gap could be worse since the study only compared monthly mortgage payments to rent. Factor in taxes, insurance, and maintenance and suddenly housing can look like a non-starter even taking into account deductions for mortgage interest payments. This difference could eventually cause a drag on sales, so the trends bear monitoring.
Bankrate added a notable caveat: “While renting is cheaper right now in the 50 largest metros, the financial incentive to buy is more obvious for Americans living in more affordable metros if they intend to stay in those areas for a few years and want to build wealth over time through owning property.”
Backyard Deals in the ADU Industry
In “Cash for your backyard? Companies, homeowners try to capitalize on a California law“, Marketplace discussed a small but growing trend in California where companies are offering homeowners cash for portions of their backyards for building ADUs or Accessory Dwelling Units. These companies are capitalizing on a state law that facilitates the construction of additional housing units. Some homeowners are selling parts of their land to reduce maintenance responsibilities and gain profits. Other homeowners use the backyard sales to extract equity without accruing debt. The California law, however, has not significantly boosted housing supply due to the complexity and costs involved in such developments. Companies like BuildCasa are stepping in to help interested homeowners avoid the hassles of becoming developers.
Californians can track the latest updates from AUD industry on the California Building Industry Association’s AUD webpage.
Spotlight on Mortgage Rates
The Mortgage Bankers Association (MBA) reported two weekly increases and two weekly decreases in mortgage applications. In April, mortgage rates resumed an uptrend that started with a bottom in January (see the chart below). Mortgage rates are above 7% again. If not for the rate buydowns of home builders, home sales might slowly grind to a halt for the spring selling season.
New home mortgage purchase applications jumped 6.1% year-over-year in March and 1% month-over-month (not seasonally adjusted). This strength follows a 15.7% and 19.1% year-over-year surges in February and January respectively. The year-over-year increase was the 14th consecutive month of gains. Average loan size grew to its highest level since March, 2023. According to the MBA, these numbers mark a slow start to the spring selling season relative to last year’s numbers.
![Freddie Mac, 30-Year Fixed Rate Mortgage Average in the United States [MORTGAGE30US], retrieved from FRED, Federal Reserve Bank of St. Louis; May 1, 2024.](https://drduru.com/onetwentytwo/wp-content/uploads/2024/05/20240501_30-Year-Fixed-Rate-Mortgage-Average-in-the-United-States.png)
Be careful out there!
Full disclosure: long ITB, long CCS