

Housing Market Intro and Summary
In recent months, the housing market experienced several impacts from declining mortgage rates. An accelerating improvement in consumer and builder sentiment point the path toward a strong spring selling season despite on-going issues of affordability and inventory availability (in the existing home market). While housing starts pulled back from November’s breakout, a strong increase in permits further supported future gains in housing starts. New home sales and existing home sales are trending down from recent peaks and were down overall for 2023. Thus, 2024 holds out the prospect of upside given the building tailwinds in the market.
Yet, a strong rally in the stocks of home builders may have hurriedly priced in most of the coming good news. This latest earnings season for home builders has even delivered some key disappointments. Accordingly, I think the seasonal trade for home builders has already topped out. (Not to mention, I am currently bearish on the stock market as a whole).
Housing Stocks
The iShares US Home Construction ETF (ITB) managed to print an all-time high in January. Unfortunately, disappointing earnings news from D.R. Horton, Inc (DHI) abruptly brought the celebration to an end. As a result, ITB under-performed the S&P 500 (SPY) in January by -1.7% versus 1.6%. I interpret this under-performance as one indicator of a topped out seasonal trade. Only a steeper sell-off in the next month or two would draw me into one more set of buys for this season.
")
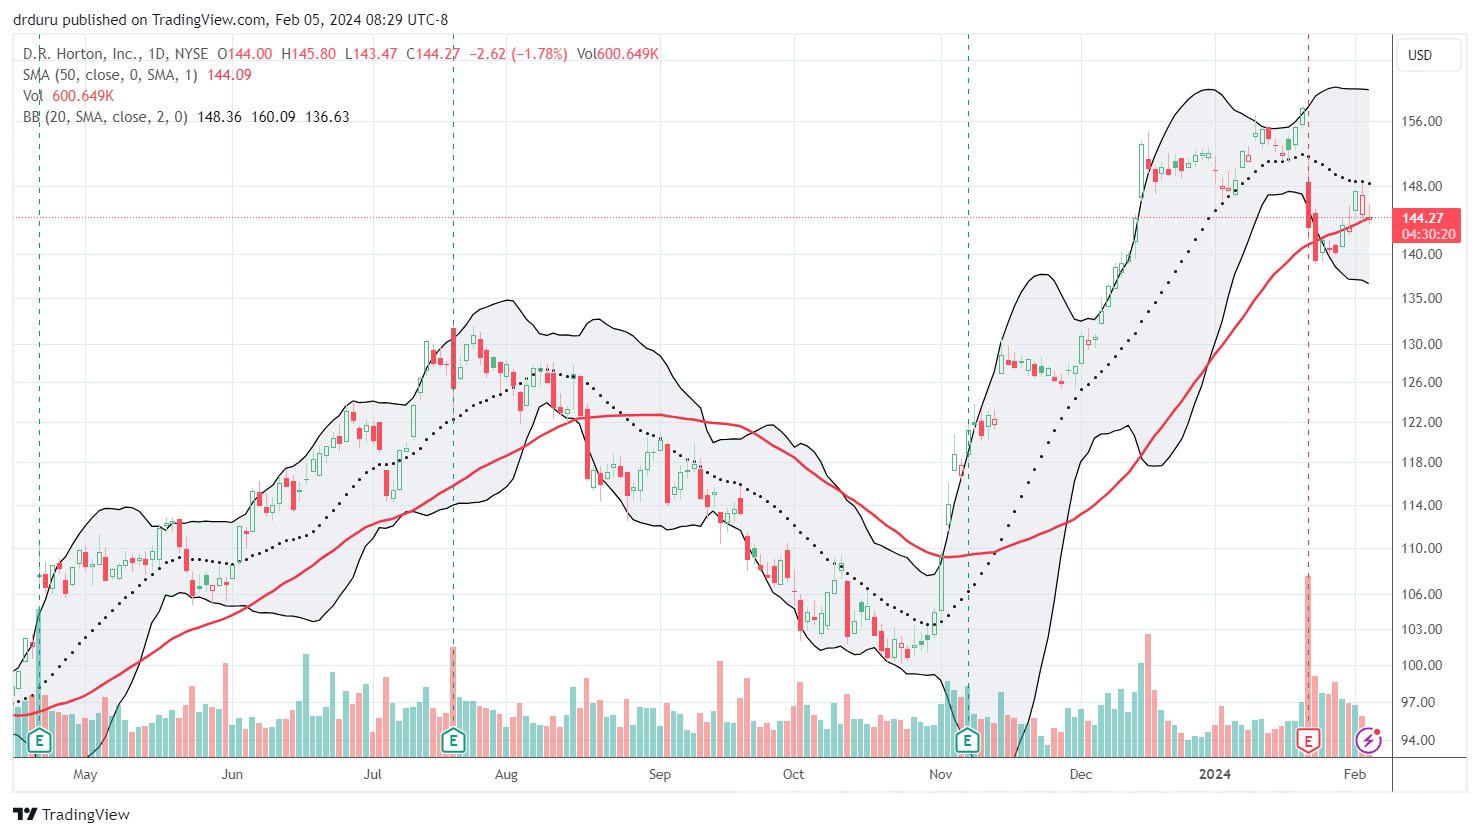
Another sign of a top in the seasonal trade is the number of builders in my universe that significantly stumbled after earnings: DR Horton (DHI) -9.2%, Meritage Homes (MTH) -7.2%, and M/I Homes (MHO) -5.7%. KBH only fell 1.2% but has drifted downward ever since. On the positive side, DHI is clinging to support at its 50-day moving average (DMA) (the red line in the chart below). Pulte Homes (PHM) quickly stabilized after a small post-earnings loss. Century Communities (CCS) actually jumped 7.6% to a new all-time high.
The gain for CCS is particularly notable after “mid-tier” peer M.D.C. Holdings (MDC) was acquired in an all cash deal at a notable premium by Japanese home builder Sekisui House. I had never heard of Sekisui House until this deal! I have long assumed U.S. home building is strictly a domestic business. Sekisui House already has a notable footprint in the United States and this deal will make the company the fifth largest builder in the U.S.
")
Housing Data
Home Builder Confidence: The Housing Market Index – January, 2024
December’s headline was “Builder Sentiment Rises on Falling Interest Rates“. January’s headline reinforced the importance of interest rates to the housing narrative: “Builder Sentiment Surges on Falling Interest Rates“. Accordingly, I am even more confident in my earlier expectation that “with a peak in mortgage rates likely in place, November should mark the low for sentiment.” While the National Association of Home Builders (NAHB)/Wells Fargo Housing Market Index (HMI) remains below the 50 mark which divides positive from negative sentiment, the 7 point surge to 44 in January pulled sentiment further away from the lows first created by the pandemic and next by the Fed’s swift rate hikes in 2022. Another big gain for HMI component SF Detached Next Six Months (Seasonally Adjusted) further convinces me sentiment has seen a low for this cycle. After increasing 6 points in December, this component gained a whopping 12 points in January. SF Detached Next Six Months is also well above 50 at 57.
Even with confidence on the move higher, the NAHB continues to report pressure on builders to reduce prices to address affordability issues. The 31% share of builders cutting prices is significantly down from December’s 36%. However, the average price discount stayed flat at 6% for the fourth straight month. Moreover, the share of builders providing incentives increased from 60% in December to 62% in January which in turn is back to the cycle high.
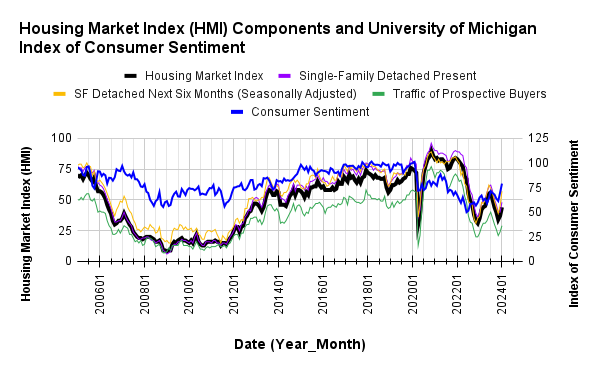
/Wells Fargo Housing Market Index (HMI) and the University of Michigan Index of Consumer Sentiment")
Source for data: NAHB and the University of Michigan
Note how the HMI previously peaked alongside consumer sentiment. Builder sentiment is rising with consumer sentiment but significantly lags the breakout. I expect builder sentiment to continue chasing consumer sentiment higher and further confirm the recent trough as the low for this cycle.
For the second straight month, the jump in SF Detached Next Six Months (Seasonally Adjusted) was a major driver of the increase in HMI.
Every region except the Midwest experienced an increase in its HMI. The West jumped off its lows by 9 points. The South joined the West in leading the HMI higher with its own 10 point surge. The Northeast only gained 1 point.
New Residential Construction (Single-Family Housing Starts) – December, 2023
In November, single-family housing starts broke with the bottom in builder sentiment. December delivered a fresh divergence between sentiment and starts. Single-family housing starts dropped 8.6% month-over-month to 1,027,000, down from 1,124,000 (revised downward). Starts continued year-over-year strength with a 15.8% gain in December. In the last Housing Market Review I claimed that year-over-year strength would begin to moderate; November’s year-over-year gain was 42%.
![US. Bureau of the Census, Privately Owned Housing Starts: 1-Unit Structures [HOUST1F], first retrieved from FRED, Federal Reserve Bank of St. Louis, February 3, 2024](https://drduru.com/onetwentytwo/wp-content/uploads/2024/02/20240204_Housing-Starts.png "Housing starts")
Poor builder sentiment never hindered intentions to build in 2023. Building permits in December accelerated the current uptrend. The eleventh consecutive monthly increase was a 2.3% gain. For several months, I had that the message from building permits was an imminent breakout in starts. That breakout finally unfolded in November just as sentiment bottomed. Thus, I am expecting the breakout in starts to hold despite the small setback in December.
Th Northeast was the only region with a year-over-year decline in housing starts. Housing starts otherwise jumped significantly. The Northeast, Midwest, South, and West each changed -52.8%, +37.6%, +17.8%, +48.2% respectively year-over-year.
New Residential Sales (Single-Family) – December, 2023
New single-family home sales have trended downward since hitting a recent peak last July. In the last Housing Market Review, I noted that if sales did not rebound in December and January, I would start to worry about an imminent air pocket in the housing market. Right on schedule, December new home sales of 664,00 jumped 8.0% from November’s 615,000. November sales were revised upward from 590,000. Overall, new home sales increased 4.2% for the year. With a 5.2% annual gain, the South was the only region to increase more than the aggregate. The West lagged at 2.1%.
![US. Bureau of the Census, New One Family Houses Sold: United States [HSN1F], first retrieved from FRED, Federal Reserve Bank of St. Louis, January 4, 2024.](https://drduru.com/onetwentytwo/wp-content/uploads/2024/02/20240204_New-Home-Sales.png "new home sales")
The median price decreased 3.0% from November to $413,200, also a whopping 13.8% year-over-year decrease. While the year-over-year changes may have bottomed, out a downtrend from early 2022 is still in place.
Note well the contrast in 2023 between declining sales and price and all-time highs for the stocks of home builders. This contrast is another indicator that, at this juncture, investors have likely priced in most of the coming good news for the housing market and thus topped out the seasonal trade.
The sequential transition in price mix toward lower price tiers took a big detour in November but mostly resumed in December. The price tier from $500,000 to $749,999 gained two percentage points while the $200,000 to $299,999 tier lost a percentage point. Otherwise, all the other changes were consistent with a downshifting in the median sales price. The year-over-year shift in price mix still leans heavily in favor of lower price tiers.
The November plunge in sales sent housing inventory soaring to 9.2 months of sales. December settled in at 8.2 months of sales. Absolute inventory increased slightly from 451,000 to 453,00 or up 4.4%. I earlier thought a pick-up in sales would decrease both relative and absolute inventory. On a month of sales basis, the new home market remains well supplied given 6 months of sales is considered a balanced market.
In November, the South stuck out as the one region with a year-over-year decline in sales. For December, the Northeast stuck out. The Northeast, Midwest, South, and the West changed -2.9%, +6.0%, +3.7%, and +7.6% respectively.
Existing Home Sales – December, 2023
Existing home sales resumed their regularly scheduled programming with sales declines and higher prices. For the year, existing home sales fell to a 30-year low with an 18.5% decline from 5.02M in 2022 to 4.09M in 2023. At the same time, the median price of an existing home jumped to a record $389,800.
Existing home sales are still in a downtrend from February’s peak. The seasonally adjusted annualized sales in December of 3.78M declined 6.2% year-over-year and down 1.0% from November. November’s sales were unrevised at 3.82M. In my last Housing Market Review, I figured sales would bottom with mortgage rates dropping. While they failed to find a low in December, the National Association of Realtors (NAR) continued to express similar sentiments: “The latest month’s sales look to be the bottom before inevitably turning higher in the new year…Mortgage rates are meaningfully lower compared to just two months ago, and more inventory is expected to appear on the market in upcoming months.” The NAR is constantly looking for inventory to turn a corner, so I am wary of that prognostication!

(For historical data from 1999 to 2014, click here. For historical data from 2014 to 2018, click here) Source for chart: National Association of Realtors, Existing Home Sales© [EXHOSLUSM495S], retrieved from FRED, Federal Reserve Bank of St. Louis, February 4, 2023

The median sales price of an existing home last peaked in June. The 1.3% month-over-month price drop in December continued an on-going descent. If falling mortgage rates bring an end to the sales declines, I also expect the sequential price declines to come to an end. Prices increased 4.4% year-over-year for the 6th straight year-over year gain, so the overall trend remains upward. The NAR put a good news / bad news spin on the price dynamics: good news for housing wealth, bad news for prospective owners.
“Despite sluggish home sales, 85 million homeowning households enjoyed further gains in housing wealth…Obviously, the recent, rapid three-year rise in home prices is unsustainable. If price increases continue at the current pace, the country could accelerate into haves and have-nots.”
December’s absolute inventory of 1.0M homes decreased 11.5% month-over-month but increased 4.2% year-over-year. According to the NAR, “unsold inventory sits at a 3.2-month supply at the current sales pace, down from 3.5 months in November but up from 2.9 months in December 2022.”
The average time on market for an existing home increased by another 4 days to 29 days in December. The 56% of homes that sold within a month is down significantly from the 62% in November. Demand pressures continue to decline. While seasonal factors are at work sequentially, these demand signals also showed weakening demand pressures from a year ago at 26 days and 57% respectively.
The share of sales to first-time home buyers decreased to 29% in December from 31% in November. The share was also 31% a year ago. This share continues to drift up and down with no direction. The NAR’s 2017 Profile of Home Buyers and Sellers reported an average of 34% for 2017, 33% for 2018, 33% for 2019, 31% for 2020, 34% for 2021, 26% for 2022, and 32% for 2023. The first-time buyer share for 2022 was the lowest on record for the NAR. The complete rebound in 2023 surprises me given that difficult inventory, rate, and price conditions are supposed to work against first-time home buyers.
As has been the pattern for most of the year, all regions declined, some significantly, in sales year-over-year. The regional year-over-year changes were: Northeast -9.6%, Midwest -10.9%, South -4.4%, West -1.4%.
As usual, every region experienced a year-over-year price increase. The regional year-over-year price changes were as follows: Northeast +9.4%, Midwest +5.9%, South +3.8%, West +4.8%.
Single-family existing home sales decreased 0.3% from November and declined on a yearly basis by 6.1%. The median price of $387,000 was up 4.0% year-over-year and down 1.3% month-over-month.
California Existing Home Sales – December, 2023
Sales of existing single-family homes in California stayed flat November to December and declined 7.2% year-over-year to 224,000. This 30th straight year-over-year decline kept sales at a 16-year low. On an annual basis, California logged 257,630 single-family existing home sales. This 24.8% drop in sales from 2022 levels was California’s largest annual decline since 2007. California significantly underperformed the nation as a whole.
November’s median home price decreased 0.3% from November but held above $800,000 for the ninth month in a row. The median price was up 6.4% year-over-year, beating November’s 18-month high. On an annual basis, the median price fell 0.6% to $813,980. The California Association of Realtors (C.A.R.) projected the median price will rebound to 860,300 for 2024 as a result of declining mortgage rates and a return of both buyers and sellers to the market (note how this projection aligns with my expectations for the national aggregate). Prices increased 6.7% year-over-year on a square foot basis.
The Unsold Inventory Index (UII) decreased from 3.0 months in November to 2.5 months in December and fell 3.8% year-over-year. Active listings declined for the first time since March, 2023. The accompanying year-over-year decline ended 8 straight months of gains. This interruption in the previous uptrends does not portend well for expectations of a pick-up in sales.
![Housing Inventory: Active Listing Count in California (Source: Realtor.com, Housing Inventory: Active Listing Count in California [ACTLISCOUCA], retrieved from FRED, Federal Reserve Bank of St. Louis, January 4, 2024](https://drduru.com/onetwentytwo/wp-content/uploads/2024/02/20240204_Active-Listings-California-Existing-Single-Family-Homes.png)
Despite the sales decline, the market of existing buyers and sellers remains very competitive in California. The average time to sell a home increased from 21 days in November to 26 days in December. However, this duration is still substantially shorter than the 33 days a year ago. The statewide sales-price-to-list-price ratio ended a 7-month streak of staying flat by dropping to 99.0% from 100.0%. A year ago, the ratio was 96.7%.
Home closing thoughts
Pending Home Sales Surge
Redfin (RDFN) reported the largest sequential percentage jump in pending home sales in two years. The surge took pending home sales to a 1+ year high. The 5.9% year-over-year gain was the largest in over 2 1/2 years. The largest monthly drop in mortgage rates since 2008, sent buyers scrambling. Supply did not respond in kind so existing homes are likely to continue increasing in price into the spring selling season.
Housing Buyers More Optimistic
Just as consumer and builder sentiment is on a sharp upswing, consumers are more optimistic about mortgage rates (going down). The latest Fannie Mae National Housing Survey reported that its “Home Purchase Sentiment Index® (HPSI) increased 2.9 points in December to 67.2, due primarily to a significant jump in the share of consumers expecting mortgage rates to go down over the next 12 months. Interestingly, consumers still have an “overwhelmingly pessimistic” impression about buying conditions although the measure is up 6.2 percentage points in a year. I have to assume that perspectives about the housing market will steadily improve this year barring any shocks to the jobs market.
Spotlight on Mortgage Rates
The Mortgage Bankers Association (MBA) reported a weekly increase in mortgage applications three of the four weeks in January. The plunge in mortgage rates from the peak in late October is providing a tailwind for mortgage applications (note that rates stayed mostly flat in January). December logged yet another year-over-year surge in mortgage applications for new homes, an 11th consecutive year-over-year increase. While applications declined 4% month-over-month (not seasonally adjusted) the overall upward trend continues to bode well for overall home sales in coming months.
![Freddie Mac, 30-Year Fixed Rate Mortgage Average in the United States [MORTGAGE30US], retrieved from FRED, Federal Reserve Bank of St. Louis; January 5, 2024.](https://drduru.com/onetwentytwo/wp-content/uploads/2024/02/20240205_30-Year-Fixed-Rate-Mortgage-Average-in-the-US.png)
Be careful out there!
Full disclosure: long ITB
With the S&P close to 5000,I have just picked up some puts with tight trailing stops…best wishes and thanks for your analysis !
Good luck! I don’t see a bearish signal for the S&P 500 yet. I prefer to see the first day of selling (the whites of their eyes) or some kind of blow-off top. Regardless, this run feels super-extended given the bearish divergence with market breadth!