Stock Market Commentary
The summer of stocks looks like it is winding down as trading dynamics transition into the stock market’s most dangerous months. The complete reversal of July’s gains on the major indices represents the most ominous sign of the transition. Technology stocks in particular have flipped from rocketships to anchors weighing on the trading action. Earnings performances over the last few weeks have come far short of justifying high-flying valuations. More importantly, investors and traders seem to care more and more about valuations at the moment.
The Stock Market Indices
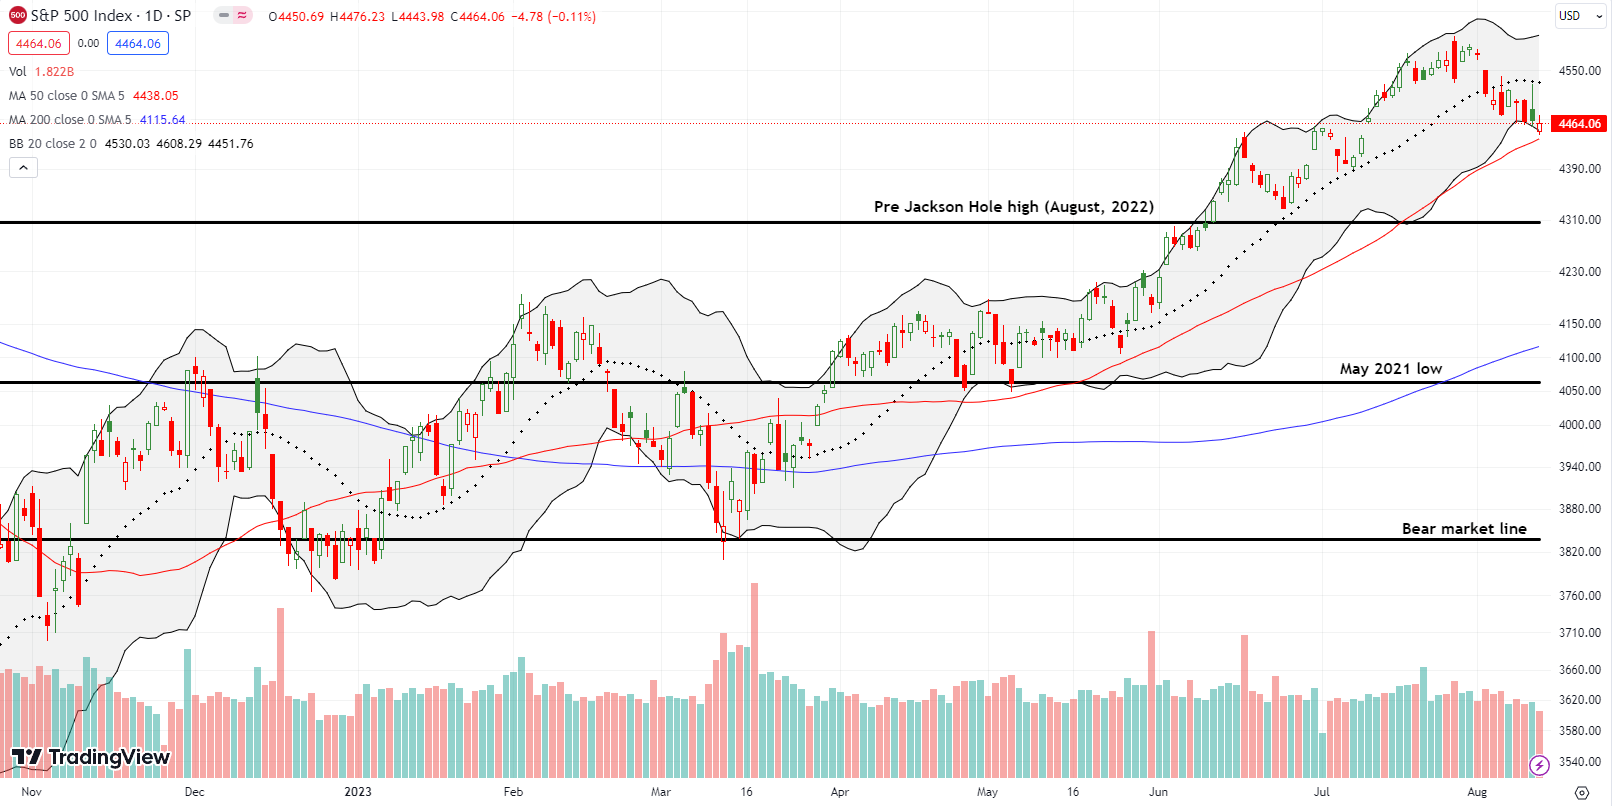
The S&P 500 (SPY) closed June at 4450.37. Last Friday’s low was 4443.98, and the index closed the day at 4464.06. The S&P 500 has spent most of August drifting downward on its way to losing all of July’s gains. The first of three of the stock market’s most dangerous months is taking its toll. The 2.7% maximum drawdown so far this month is higher than the median maximum drawdown for August. This month’s drawdown is still below the 3.1% average maximum drawdown. Thus, I can positively spin August’s trading action: the S&P 500’s test of support at the 50-day moving average (DMA) (the red line below) could be the extent of the pain for this month. Let’s brace ourselves!
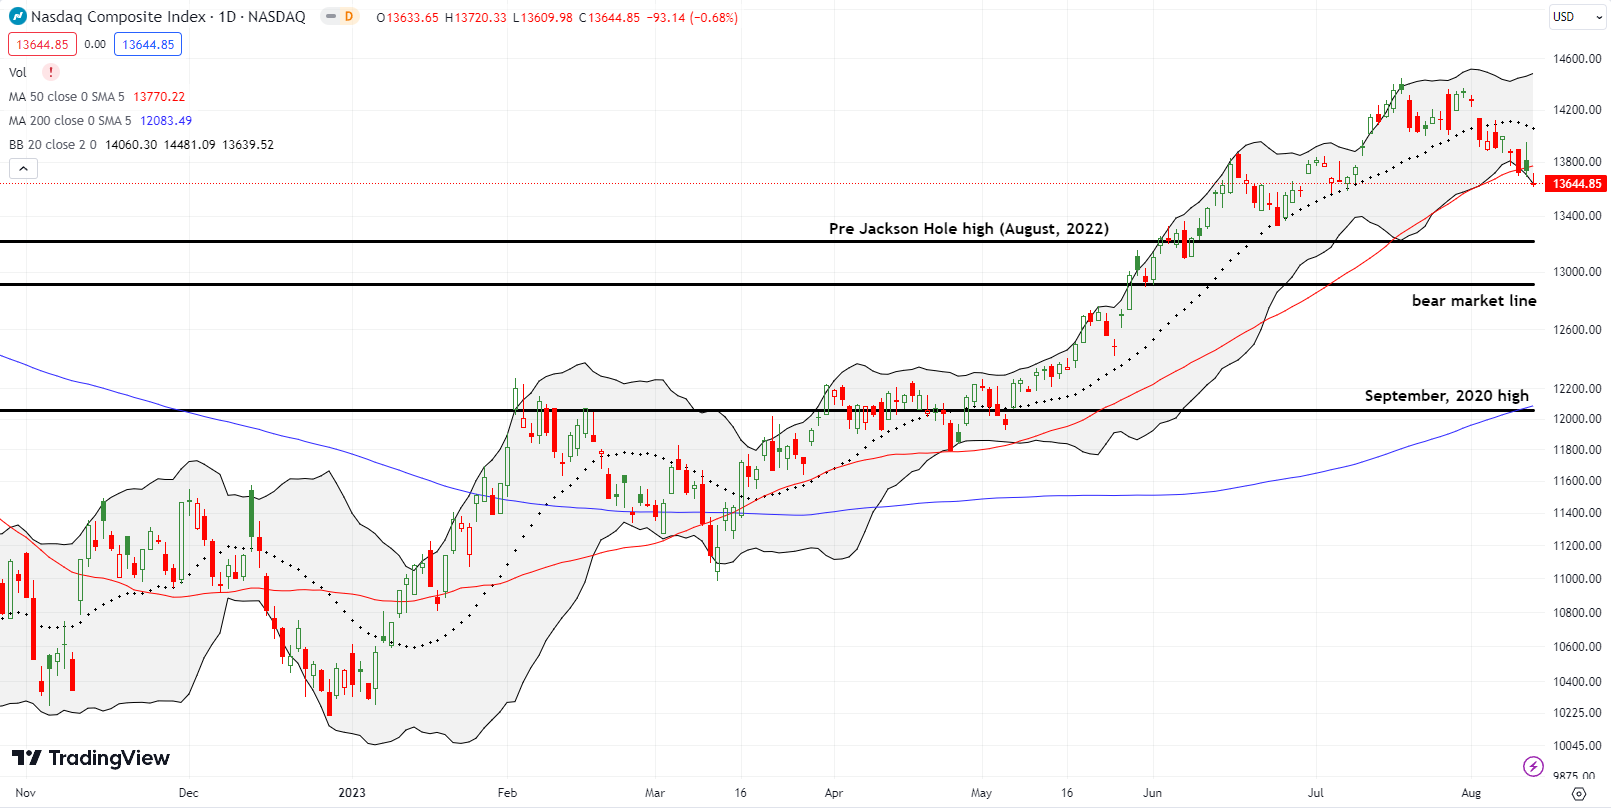
The NASDAQ (COMPQ) threatens my positive spin. The tech laden index is the anchor weighing on the stock market. The NASDAQ not only lost its gains for July but also it closed below its 50DMA on Friday. Like the S&P 500, the NASDAQ slid down the lower Bollinger Band (BB) all week in a sign of persistent selling pressure. Thus, it will take an abrupt change in sentiment to prevent the NASDAQ from confirming a bearish 50DMA breakdown with a lower close.
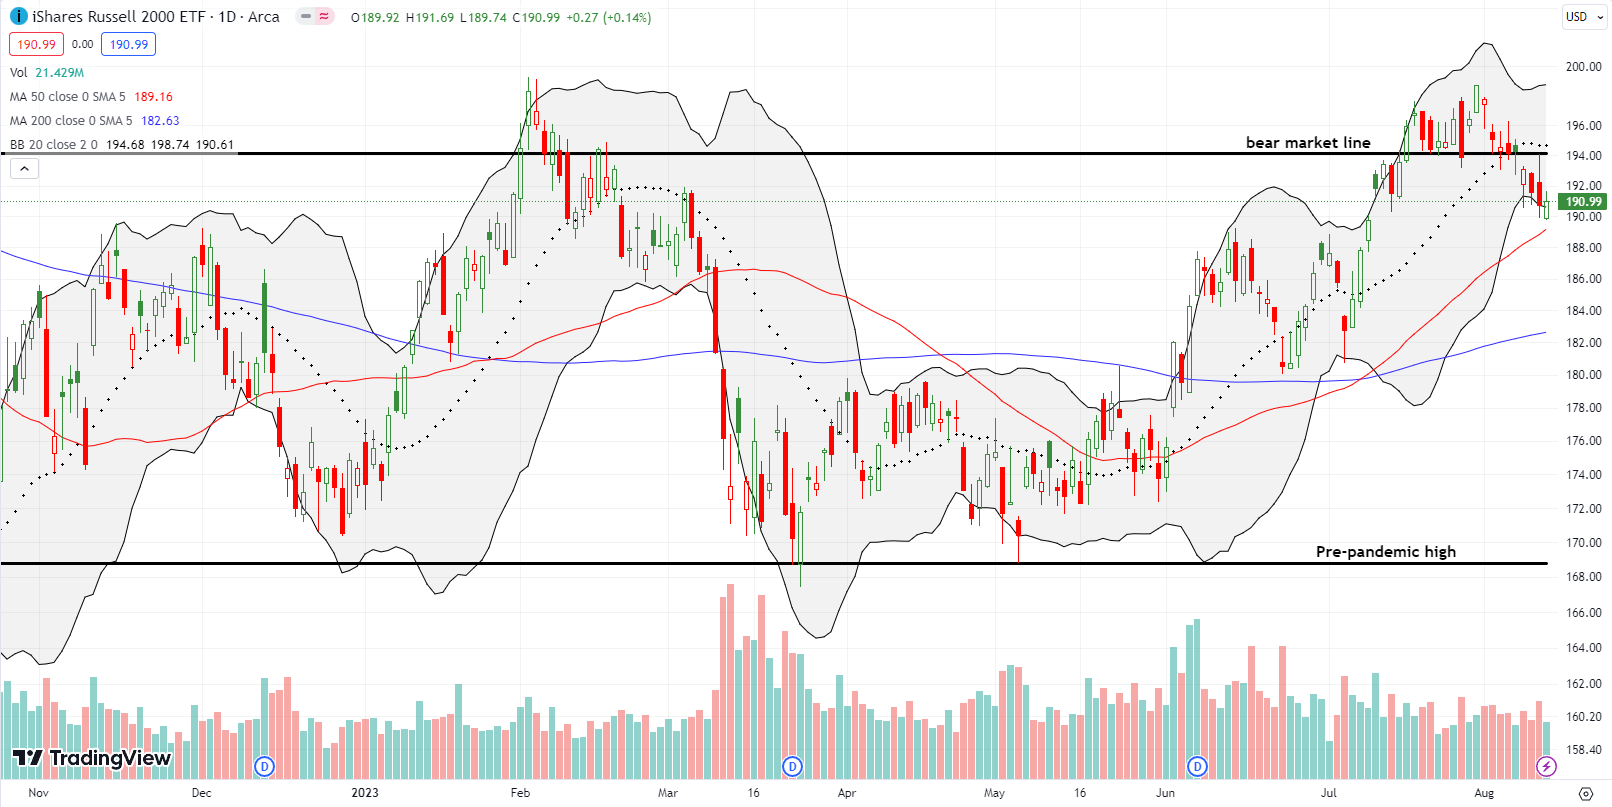
The iShares Russell 2000 ETF (IWM) lost its bid to stay out of a bear market. On Monday, IWM dipped its toe into bearish territory, and buyers rescued the ETF of small caps. Sellers got the job done the next day and confirmed the bear market breakdown for the rest of the week. Now, IWM faces an imminent test of uptrending 50DMA support. No matter how that drama plays out, IWM looks trapped by a double top for the year. Needless to say, my IWM call spread wasted away.
The Short-Term Trading Call with July’s Gains Lost
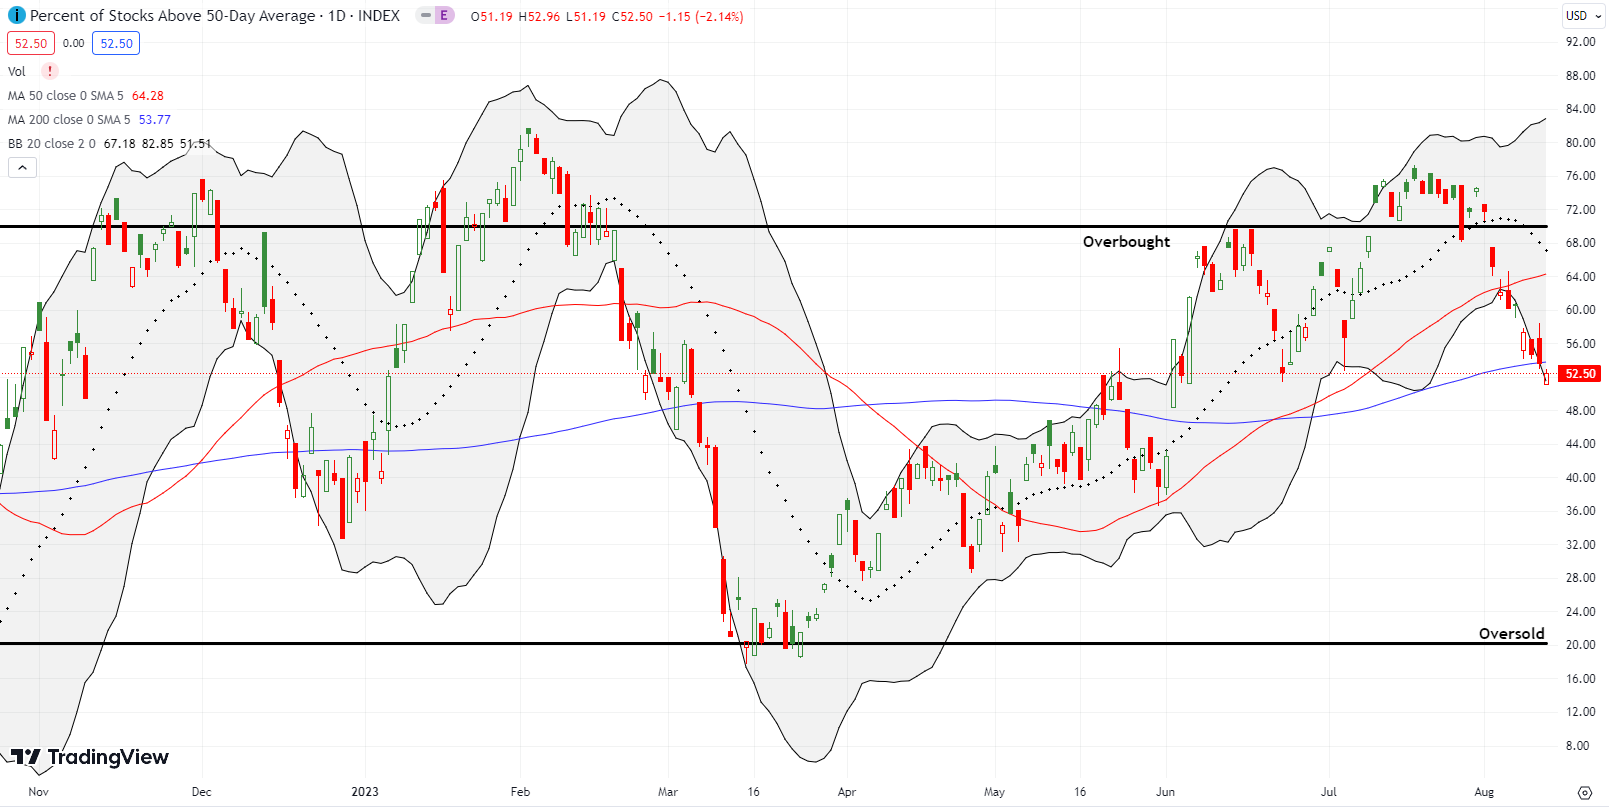
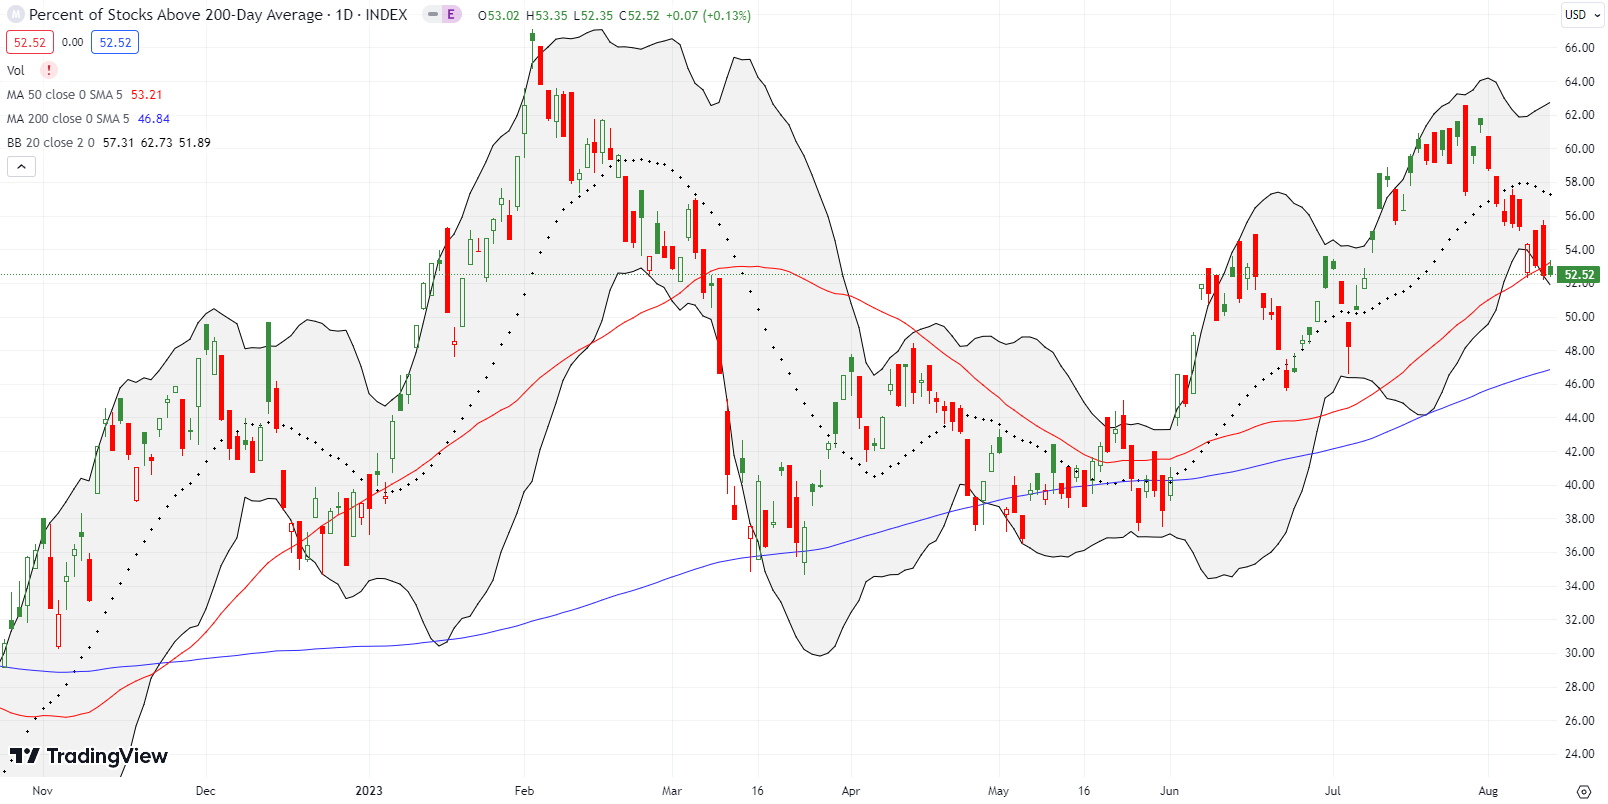
- AT50 (MMFI) = 52.5% of stocks are trading above their respective 50-day moving averages (day #3 overbought)
- AT200 (MMTH) = 52.5% of stocks are trading above their respective 200-day moving averages
- Short-term Trading Call: neutral
AT50 (MMFI), the percentage of stocks trading above their respective 50DMAs, closed at it lowest point in almost 2 months. This point also matches the breakout point at the beginning of June. So my favorite technical indicator sits right at an important juncture for the summer of loving stocks. In other words, almost every stock (figuratively) which pulled off a 50DMA breakout this summer is now back in bearish territory or fighting to stay out of it.
There conditions are very poor for bulls, and they validate my flip from bullish to neutral when I made the case for a topping in stocks with the help of AT50. Those tops now look firmer. However, I am still not taking the logical step of going bearish even after de-riskng my portfolio and now increasing trades in put options. I am deferring to the overall market uptrend and remain more focused on the opportunities in the remaining strong pockets of the market. The Federal Reserve’s confab in Jackson Hole later this month should deliver a decisive pivot for my sentiment. Jackson Hole has been a major market mover since 2019.
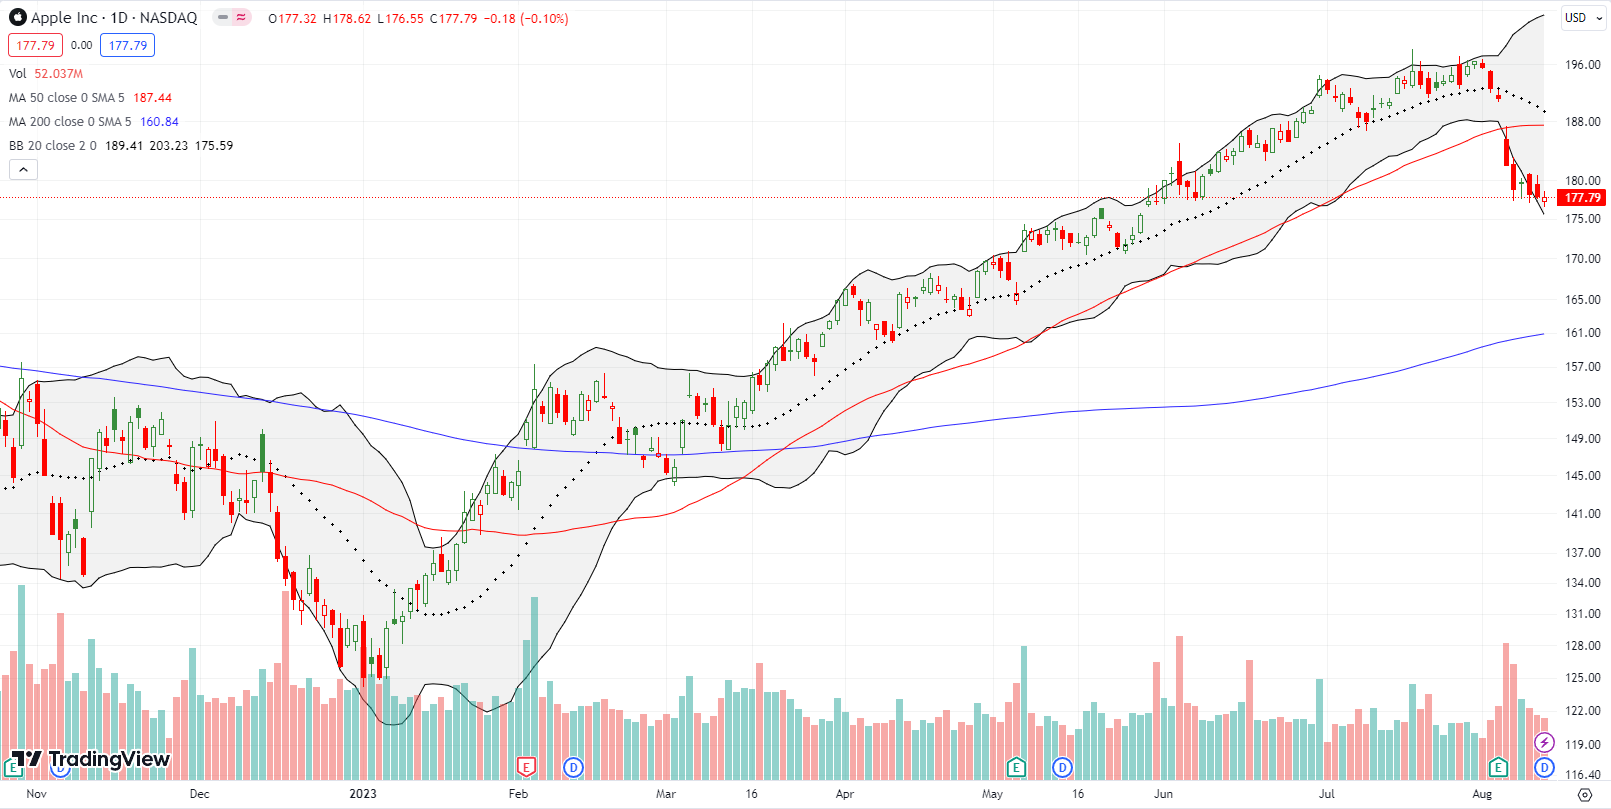
Apple Inc (AAPL) is one of the most important stocks that has lost its 50DMA support. Since a 4.8% post-earnings loss put an exclamation point on the end of overbought trading conditions, sellers have maintained the pressure on America’s biggest stock with a slide through and around the lower BB. Overall, AAPL has lost ALL of its summer gains with Friday’s close matching the price level from May 31st. Thus, AAPL is the poster child for allowing the summer of loving stocks to slip away. (Note well that another 2023 darling, NVIDIA (NVDA), confirmed a 50DMA breakdown last week).
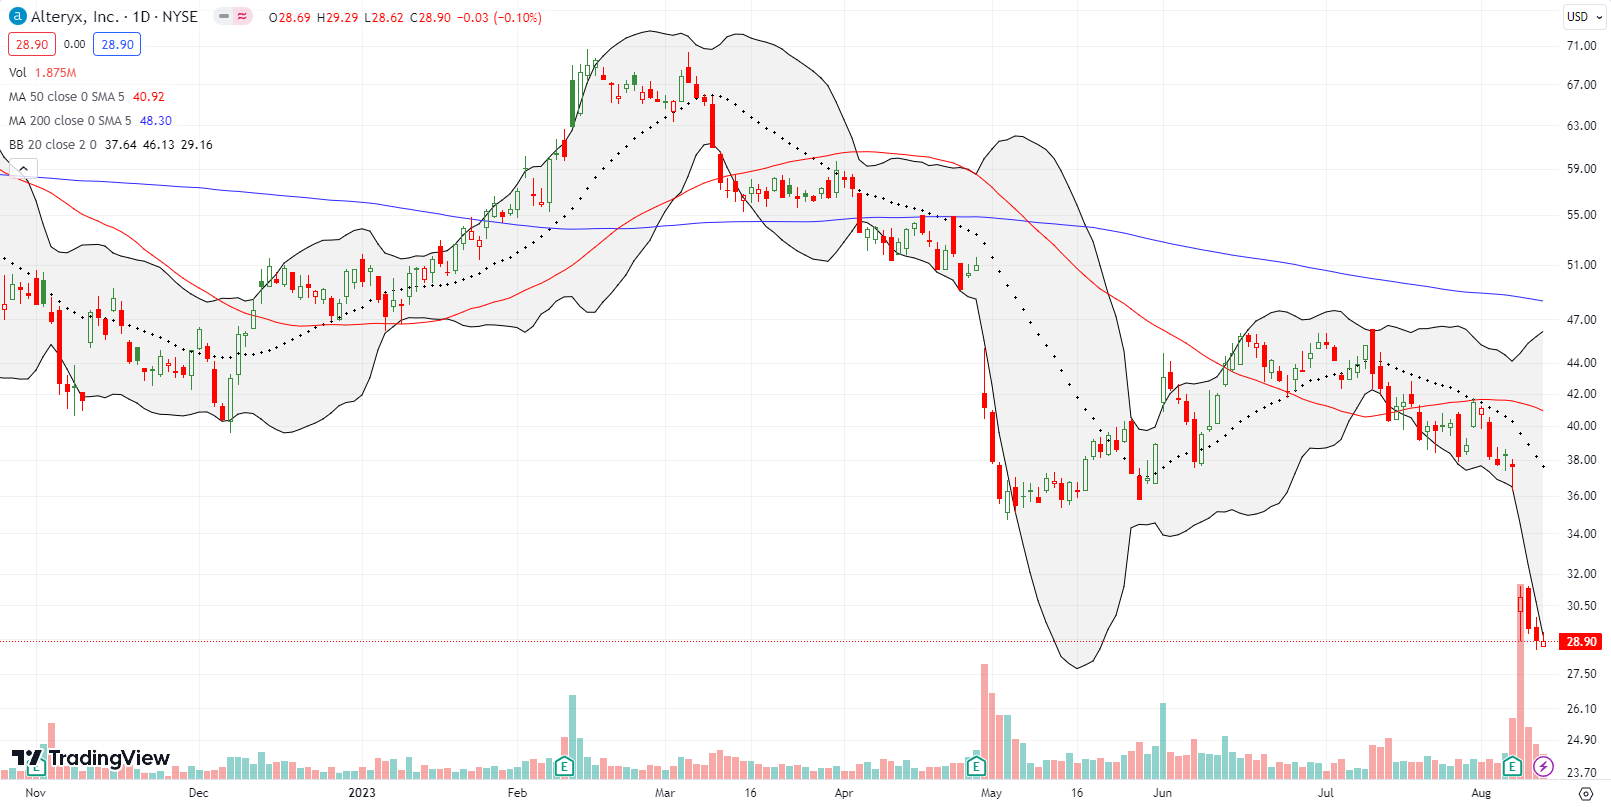
Data analytics platform Alteryx, Inc (AYX) continues to experience a rough year. The summer of loving stocks barely boosted AYX before selling resumed going into earnings. A 17.9% post-earnings loss sent the stock to a 5 1/2 year low. The stock started trading just a little over 6 1/2 years ago. This price action makes Alteryx officially look like a company in decline. I continue to monitor the stock in case the company figures out a way to turn things around.
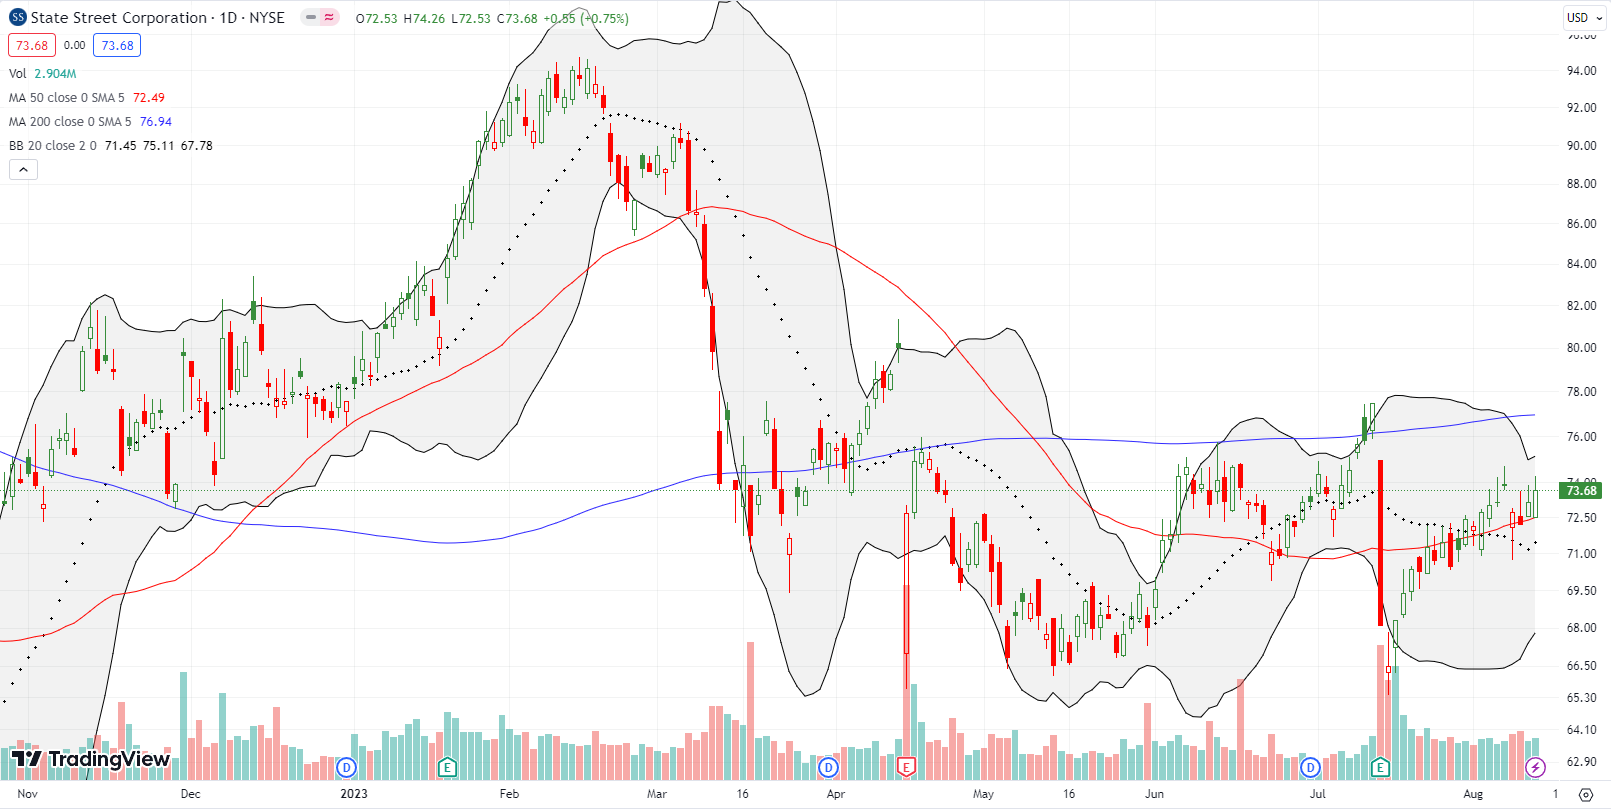
A month ago I speculated that State Street Corp (STT) would get support from a stock repurchase program. While I cannot (yet) confirm the company made those purchases, the stock proceeded to act like it got buying support. While I never bought into this bottoming pattern, I can still appreciate the confirmation of my theory. STT looks restabilized.
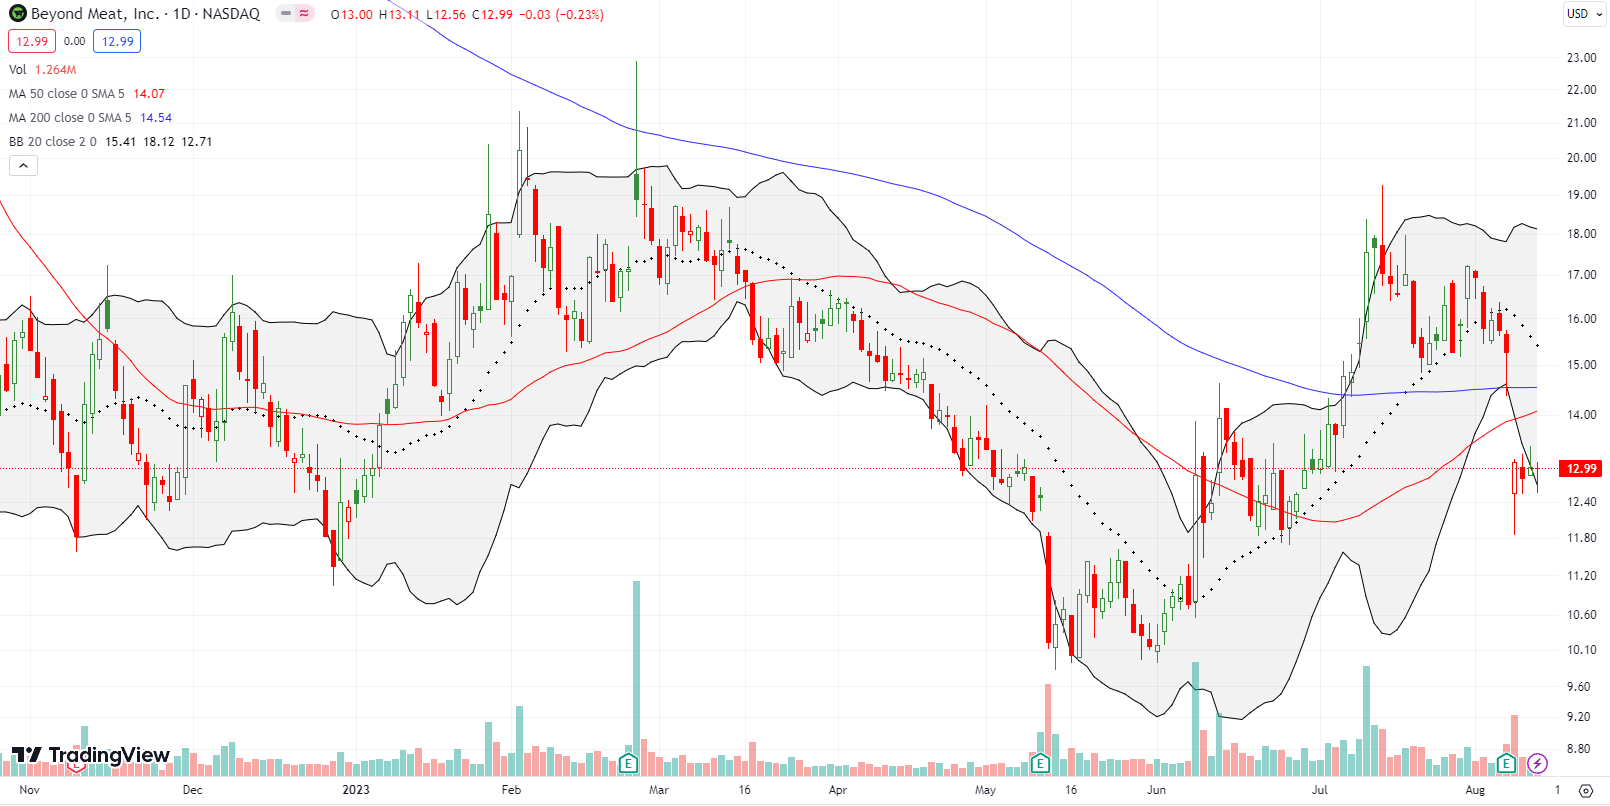
My theory about a a bullish breakout in Beyond Meat, Inc (BYND) blew up after a 14.2% post-earnings loss. I salvaged a sliver of my loss by stubbornly buying a fresh call option as BYND extended well below its lower BB and then taking profits the next day. Now I watch to see what comes after this period of stabilization.
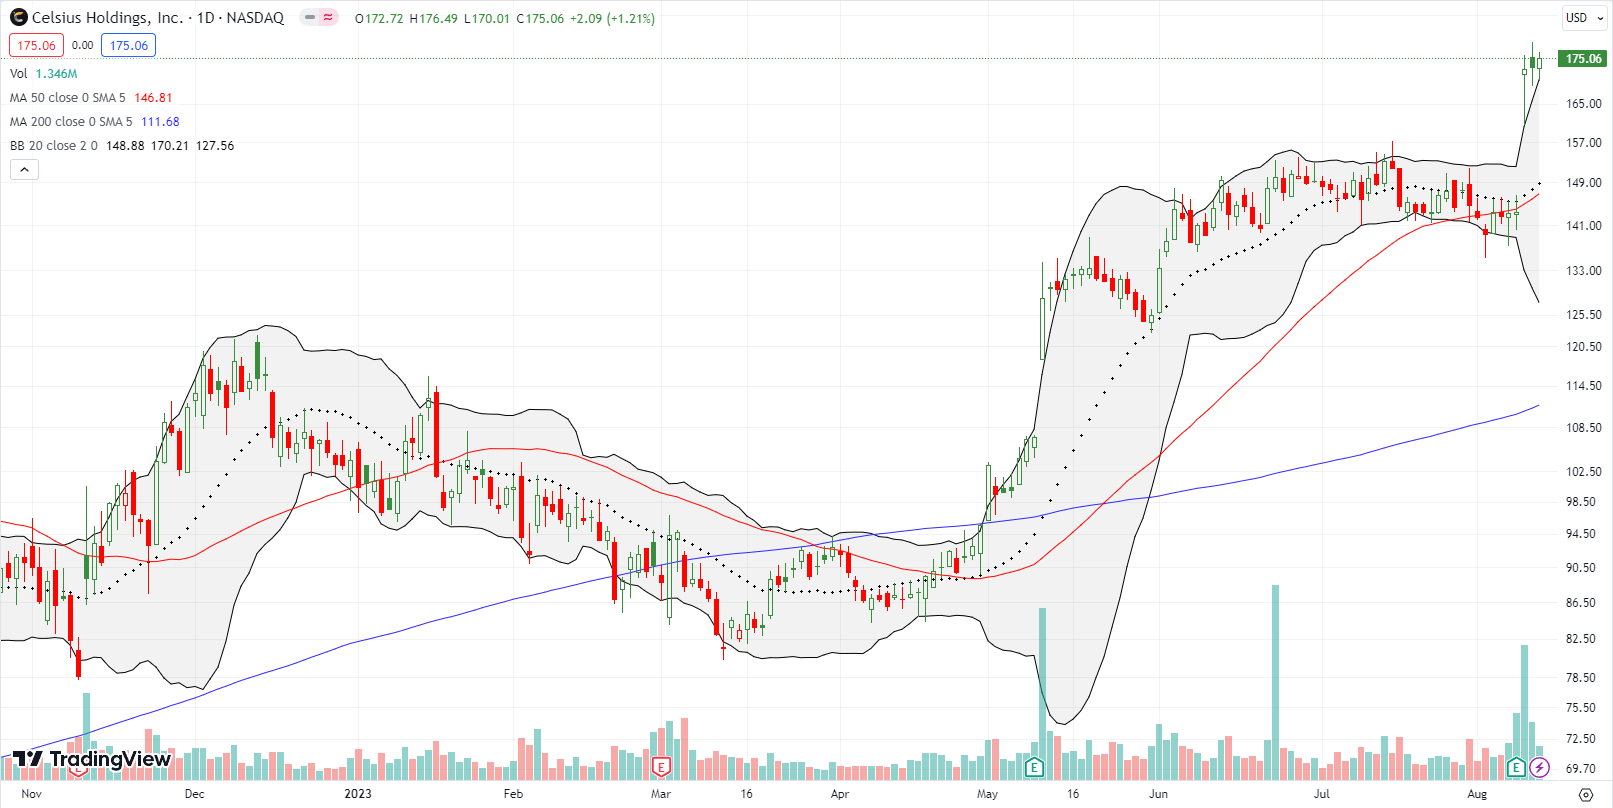
Energy drink company Celsius Holdings, Inc (CELH) made a fantastic recovery from the breakdown that caused me to give up on the stock in early in 2022. I failed to keep up with the story and failed to note the bullish 200DMA breakouts in July, 2022 and then again last April. CELH now trades at all-time highs following a bullish post-earnings surge of 20.5%. CELH might be the least talked about high performer around. The stock traded in the single digits until the early days of the pandemic.
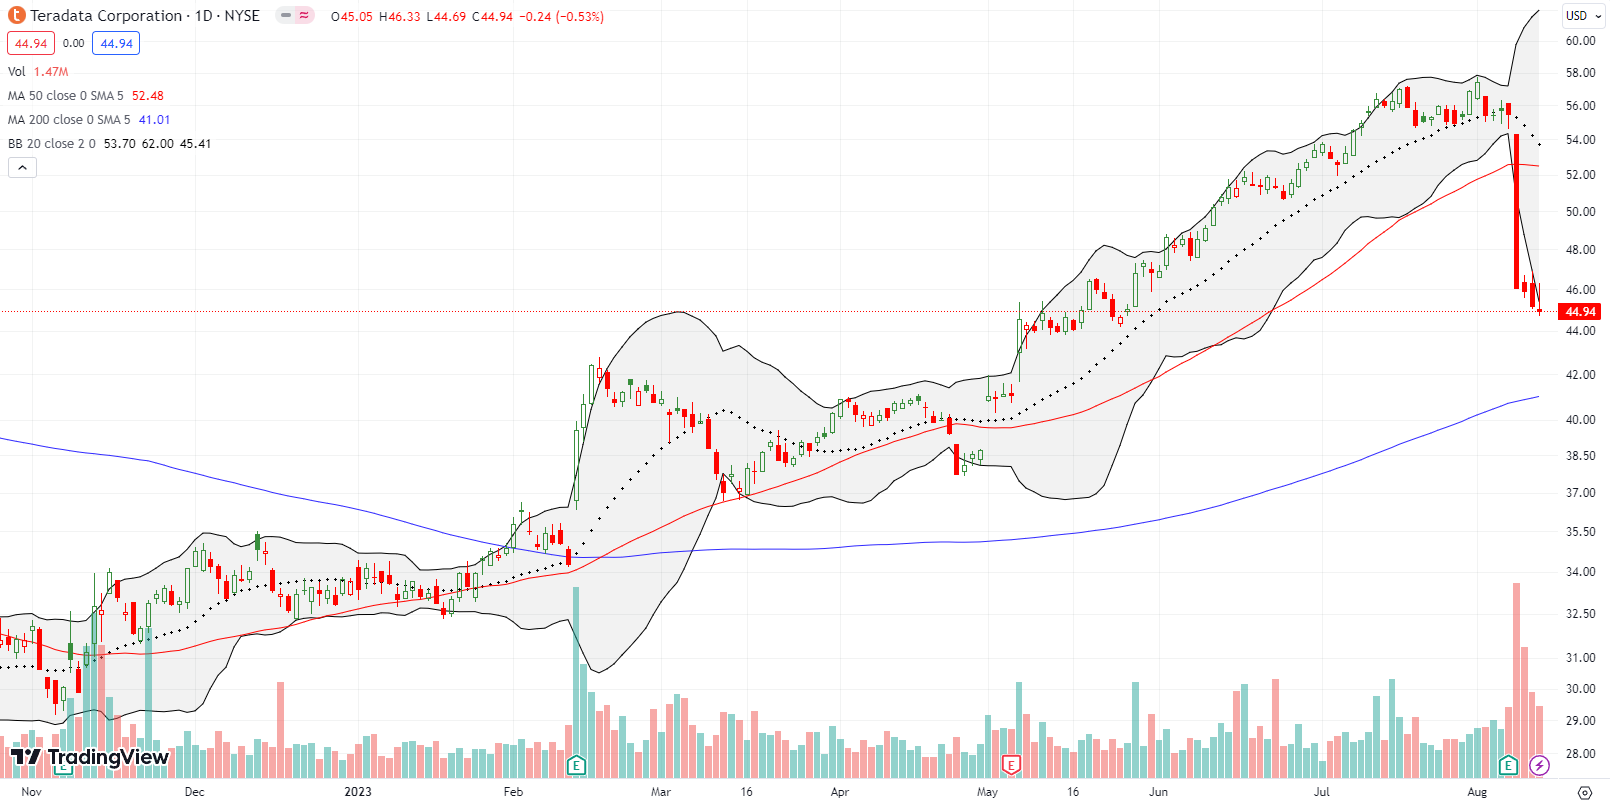
A month ago I gushed about the “quiet” run-up this year for Teradata Corporation (TDC) and looked forward to buying the next dip. Earnings delivered a bigtime dip last week and de-risked the stock quite a bit for me. After quickly reviewing the earnings report and some analyst commentary, I decided the selling was an over-reaction. I started accumulating stock and plan to buy up to a test of 200DMA support. I wrote a detailed piece about the latest earnings for Teradata Corporation in Seeking Alpha.
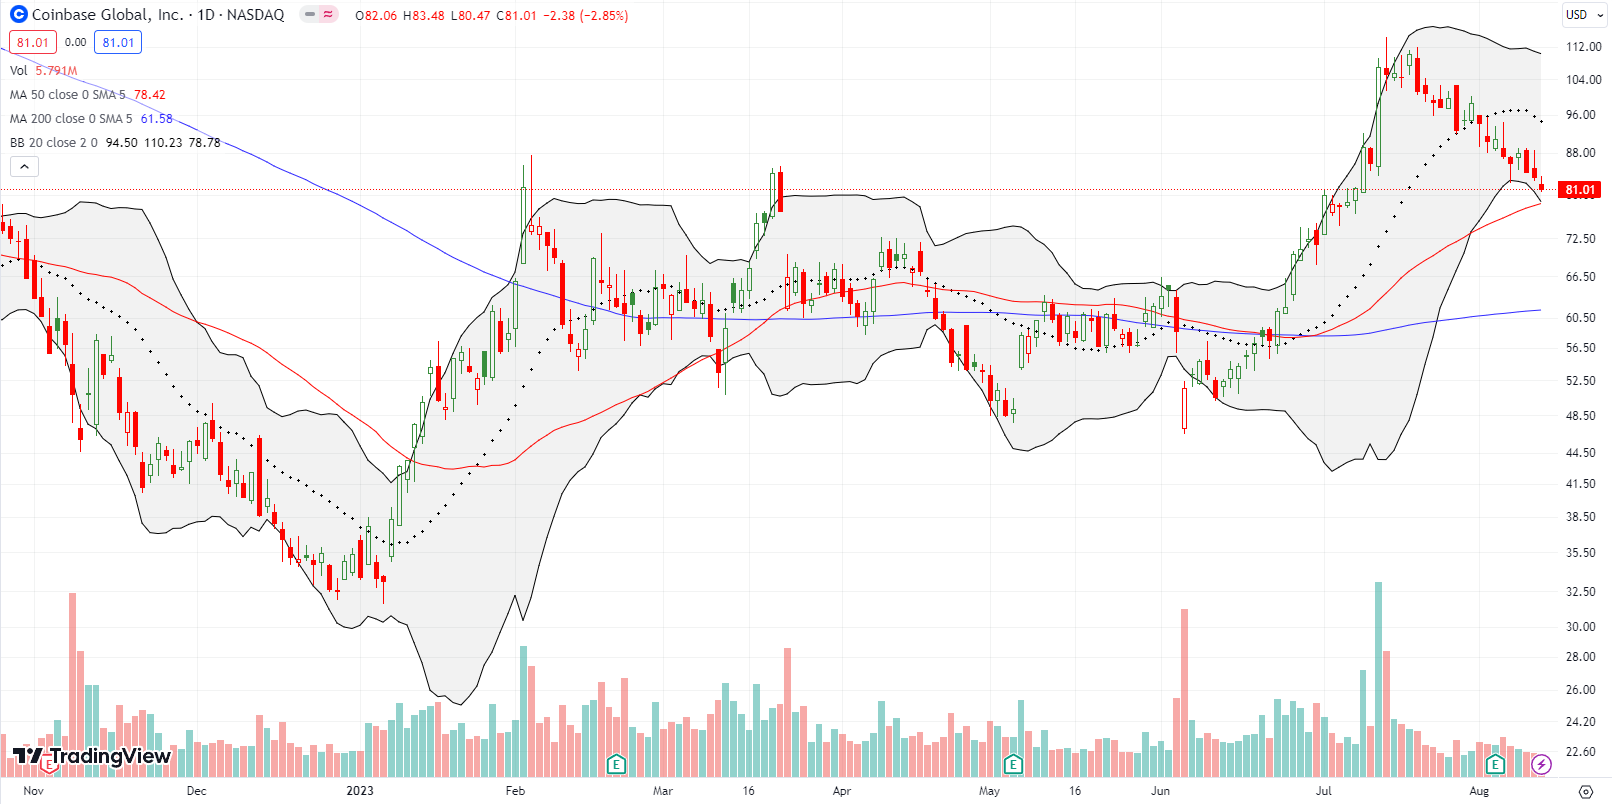
Crypto trading platform Coinbase Global, Inc (COIN) is a shell of its former self when its IPO marked out the all-time top in Bitcoin (BTC/USD). Since then, COIN has bounced from drama to drama. The latest drama is an SEC investigation into selling unregulated securities. On the day of the news, the stock gapped down 20.9%. Buyers next stepped in and sent COIN nearly straight up from there for the next 5 or 6 weeks. A favorable legal ruling for Ripple (and XRP) sent COIN surging 24.5% and, you guessed it, the stock topped out there. Sellers have been in control ever since with a slight pause for earnings earlier this month. I am looking to trade the direction following the coming test of 50DMA support. That support looks imperiled.
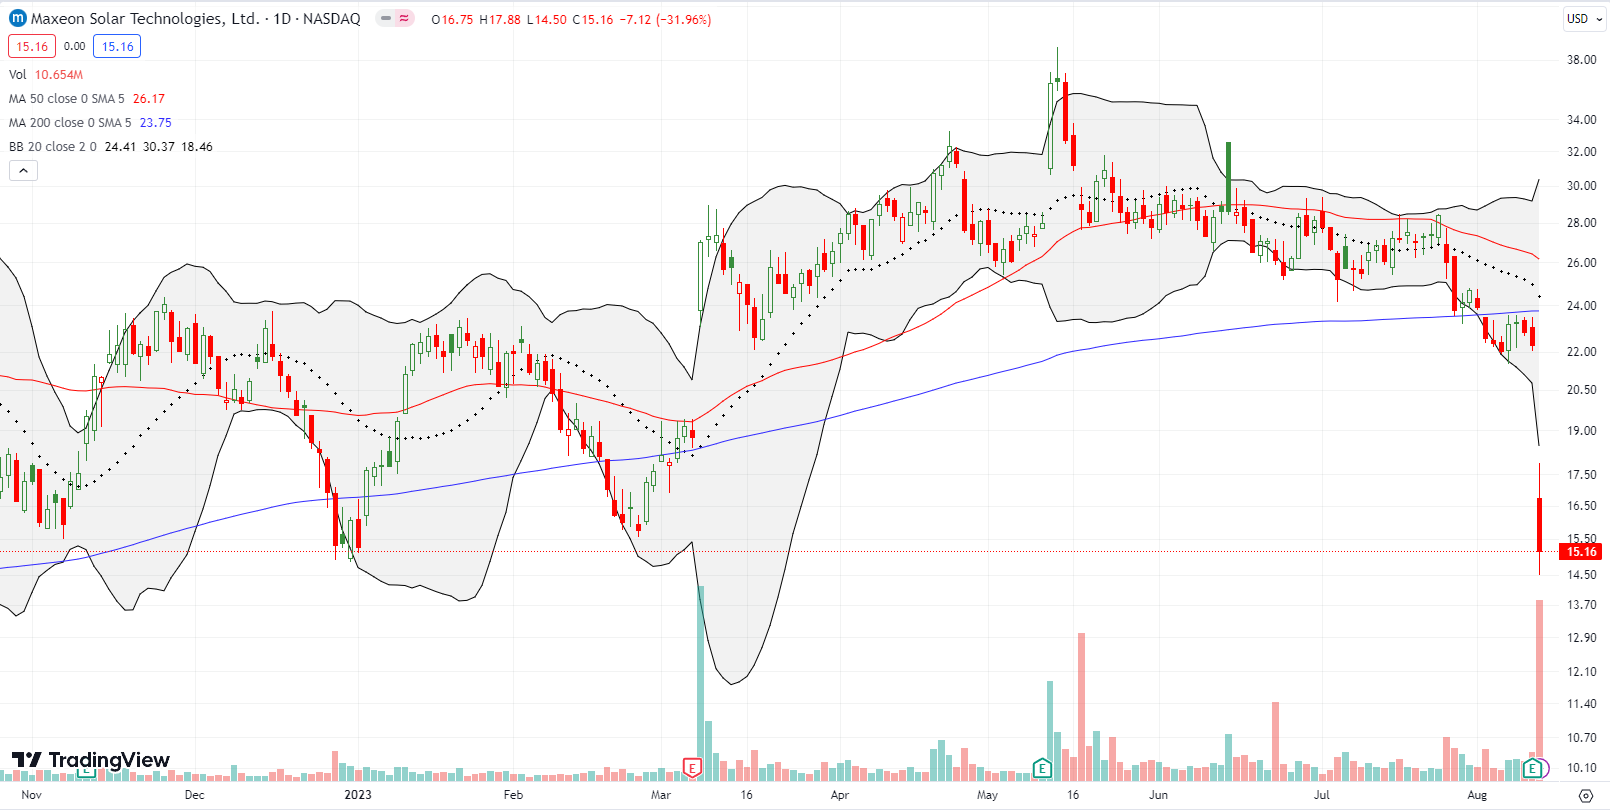
I last wrote about Maxeon Solar Technologies, LTC in early 2022 while it was struggling with all-time lows. I stubbornly held on and was rewarded with a rally in the second half of 2022. Relieved, I took profits and mostly forgot about the stock. MAXN popped into my radar again after Friday’s 32.0% post-earnings plunge. Suddenly, solar stocks are falling from the sky again. While MAXN is over-extended to the downside with the trade well below its lower BB, I am extremely wary of this dramatic confirmation of 200DMA resistance. I am content to sit on the sidelines while buyers and sellers work things out for a while.
Be careful out there!
Footnotes
Subscribe for free to get email notifications of future posts!
“Above the 50” (AT50) uses the percentage of stocks trading above their respective 50-day moving averages (DMAs) to measure breadth in the stock market. Breadth defines the distribution of participation in a rally or sell-off. As a result, AT50 identifies extremes in market sentiment that are likely to reverse. Above the 50 is my alternative name for “MMFI” which is a symbol TradingView.com and other chart vendors use for this breadth indicator. Learn more about AT50 on my Market Breadth Resource Page. AT200, or MMTH, measures the percentage of stocks trading above their respective 200DMAs.
Active AT50 (MMFI) periods: Day #94 over 20%, Day #68 over 30%, Day #65 over 40%, Day #51 over 50% (overperiod), Day #4 under 60% (underperiod), Day #8 under 70% (underperiod)
Source for charts unless otherwise noted: TradingView.com
Full disclosure: long TDC
FOLLOW Dr. Duru’s commentary on financial markets via StockTwits, Twitter, and even Instagram!
*Charting notes: Stock prices are not adjusted for dividends. Candlestick charts use hollow bodies: open candles indicate a close higher than the open, filled candles indicate an open higher than the close.


CELH reminds me of my first 100-bagger, which was also an energy drink company (MNST, originally HANS). If there are other business categories with such potential to make near-infinite profits from an easy-to-make product, I wish I knew about them. My purchase of HANS in early 2004 was inspired by admiring KO’s 24,000% gain over the previous 40 years. Little did I know HANS/MNST would pass that milestone in only 10!
A few internet-exploiting companies (Amazon, Facebook, Google, Netflix) have also grown profits to the sky – but not as easily or explosively.
When you find the formula, let me (us) know!
Hi Dr Duru,
Do you have a post summarizing your actual method for trading stocks, and, if available, any back tests you have done of your system?
I just happened to do a video on how I trade 50DMA support: https://youtu.be/iyAzWufodq4
I have a post that goes into the analytics of trading market breadth: https://drduru.com/onetwentytwo/t2108-resource-page/
Otherwise, I do not have a single post that summarizes the various things I do.
Unfortunately, I do not have any backtests. They have some value, but they can be highly biased to the particular history you chose to examine. It is also hard to account for stop-loss points and the various ways you might choose to take profits. You can easily change the results of a backtest by choosing more favorable profit points. Anyway, I find the best approach is to have rules that are backed by the collective experience of traders and staying disciplined is the best approach.