Stock Market Commentary
The summer of loving stocks is staring down its second major test just two weeks after its first major test. Like the first test, the latest test is happening in the wake of the stock market’s failure to break through the overbought threshold on market breadth. Unlike the first test, the important 20DMA supports are not holding in picture-perfect form. A swirl of economic data last week seemed to leave the market confused and unsure of how to react.
The Federal Reserve’s minutes for the June meeting reminded the Wall Street of the Fed’s case for staying hawkish. Strong services numbers on Thursday reinforced the message. Wall Street’s disappointment about the good news came in the form of soaring volatility, rising interest rates, and a stock market sinking. Friday’s softer than “expected” jobs report for June seemed to offer little consolation with small caps surprisingly outperforming the market.
The Stock Market Indices
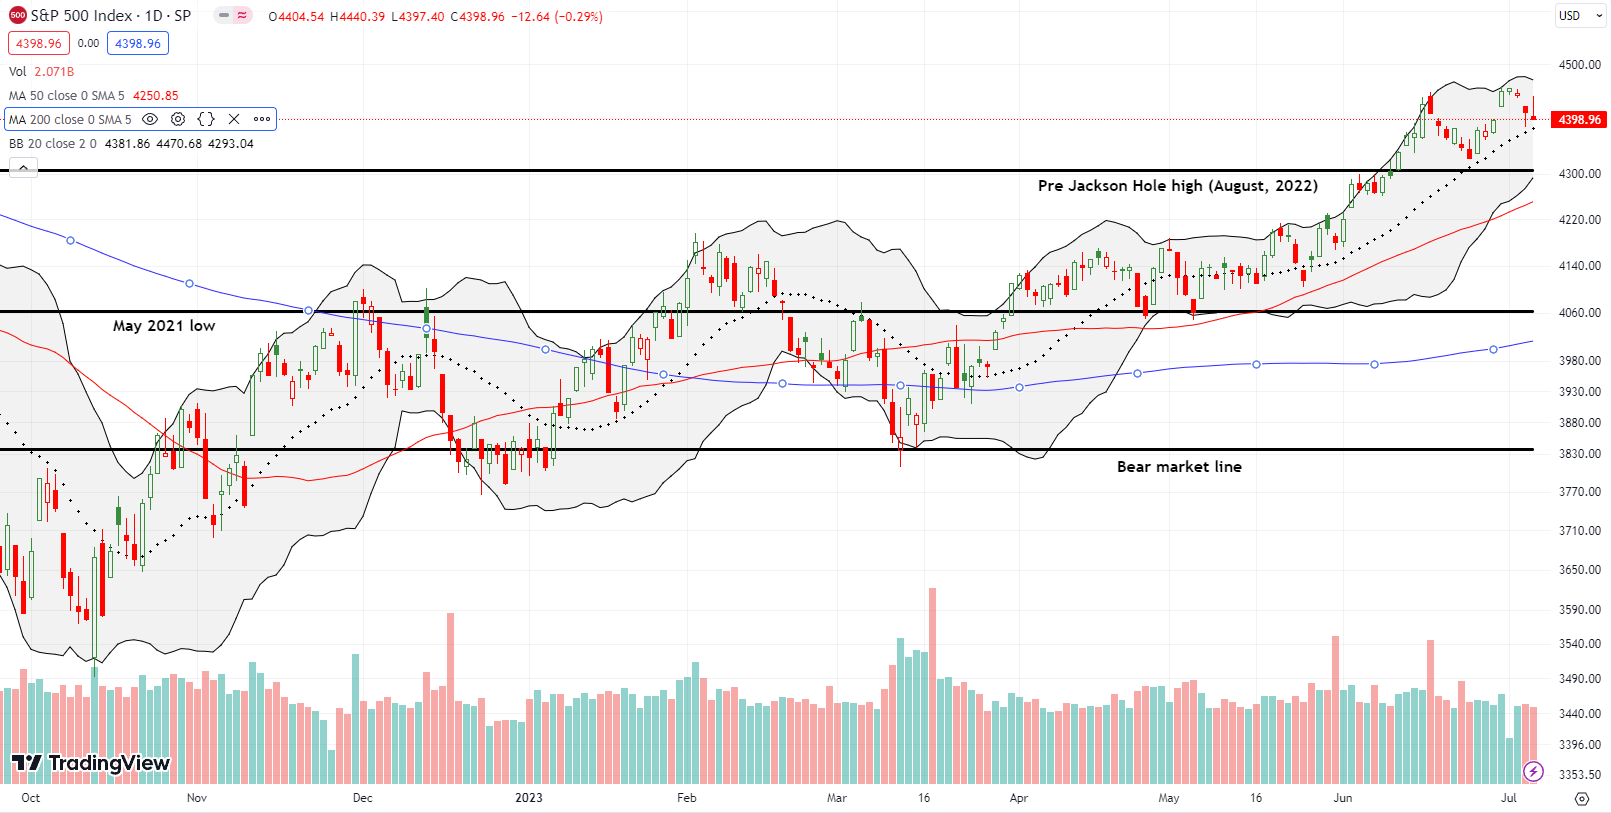
The S&P 500 (SPY) passed its first major test for the summer of loving stocks two weeks ago. At that time the index rebounded away from support at its 20-day moving average (DMA) (the dotted line) in poetic form. This time, the dynamics are messy as a picture-perfect rebound on Thursday was spoiled by a fade from the intraday highs on Friday. If buyers and bulls had held their ground, they would have confirmed another successful test. Instead, this second test of the summer of loving stocks is on the edge of failing. Such a failure would set up (short-term) bearish implications for the stock market’s latest rejection from the overbought threshold.
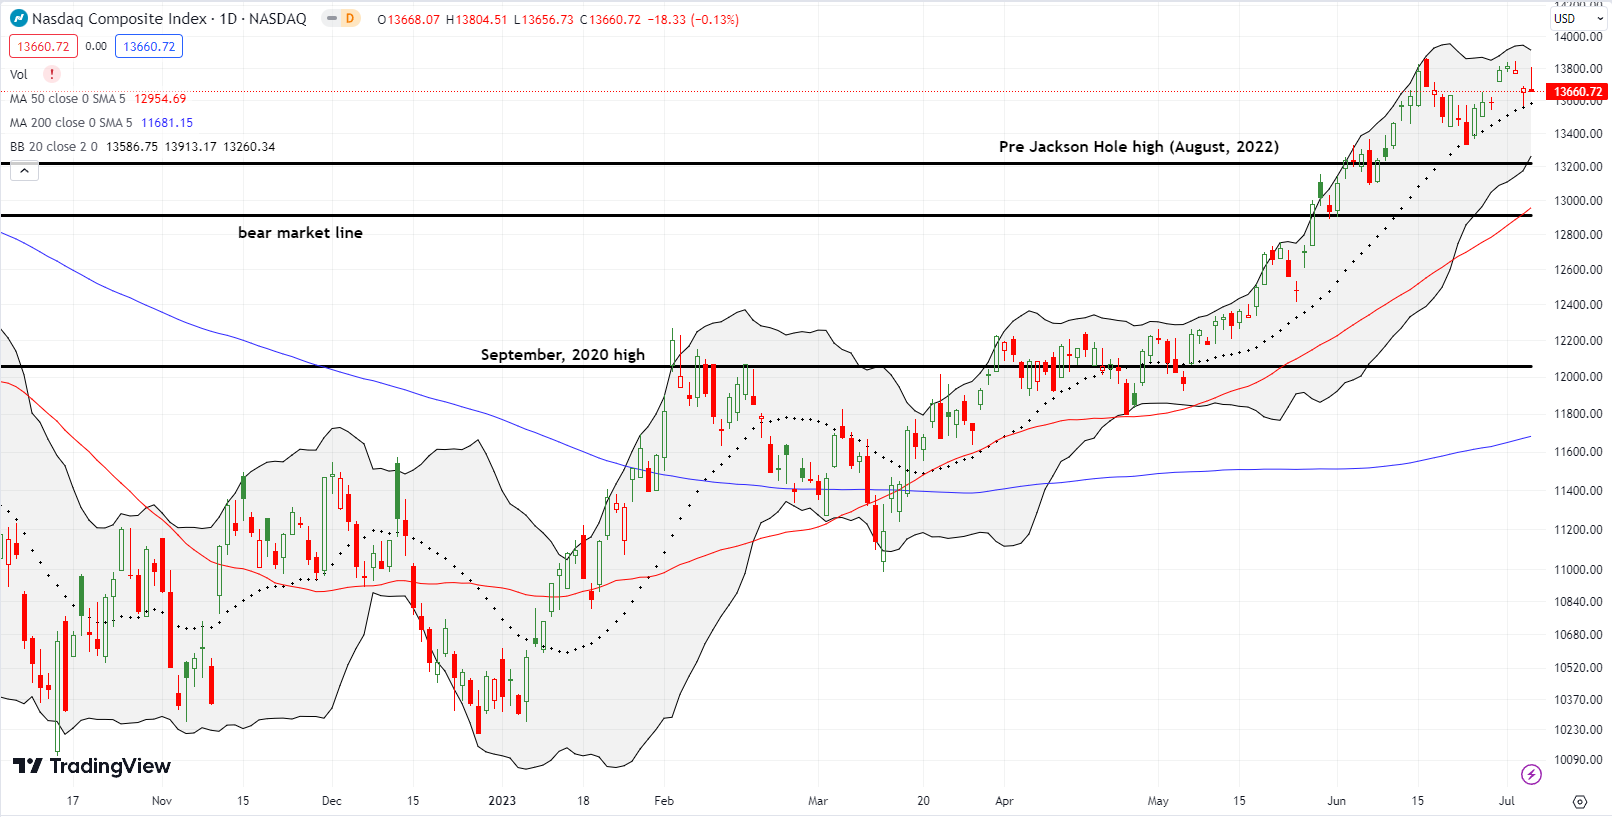
The NASDAQ (COMPQ) also pulled off a picture-perfect bounce from 20DMA support on Thursday. The tech-laden index also faded from the highs on Friday and closed marginally down for the day. This mirror image of the trading action in the S&P 500 has similar implications. Unfortunately for the NASDAQ, the failure to break out last week gives the chart a more distinct toppy pattern. This timing is ominous when combined with the stock market’s failure to break through the overbought threshold.
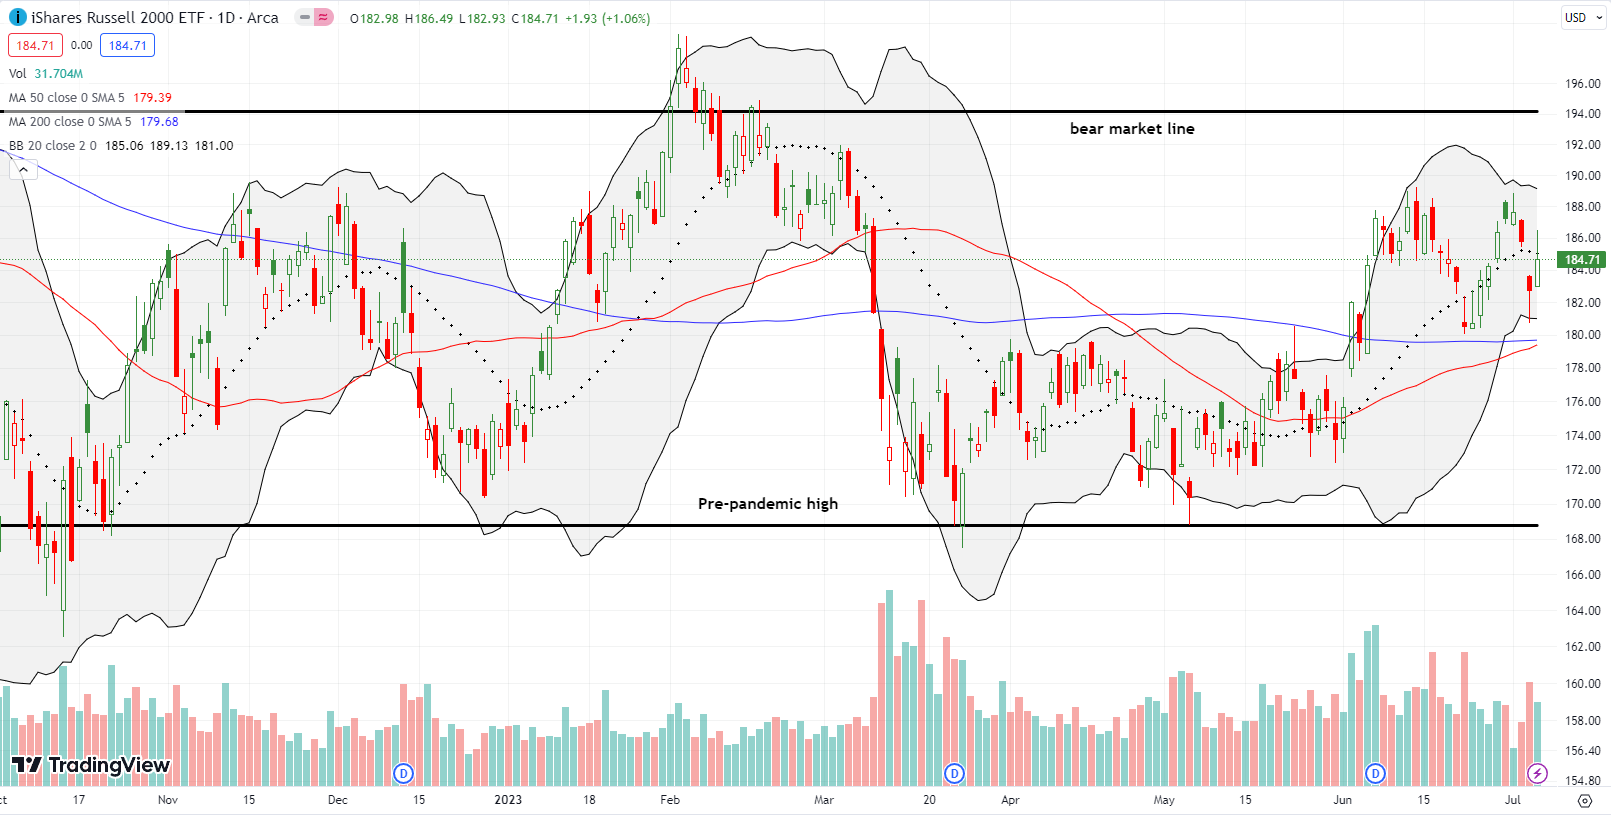
While the iShares Russell 2000 ETF (IWM) lags the other two major indices this year, Friday was a day to shine. The ability for small caps to rally added to the swirl of signals in the market. I took profits on my call spread as IWM hit 20DMA resistance. Buyers kept pressing the issue until they filled the gap from Wednesday. With enthusiasm exhausted, sellers were able to close IWM under resistance. IWM is setting up conditions for a new, extended trading range.
The Short-Term Trading Call with the Overbought Threshold
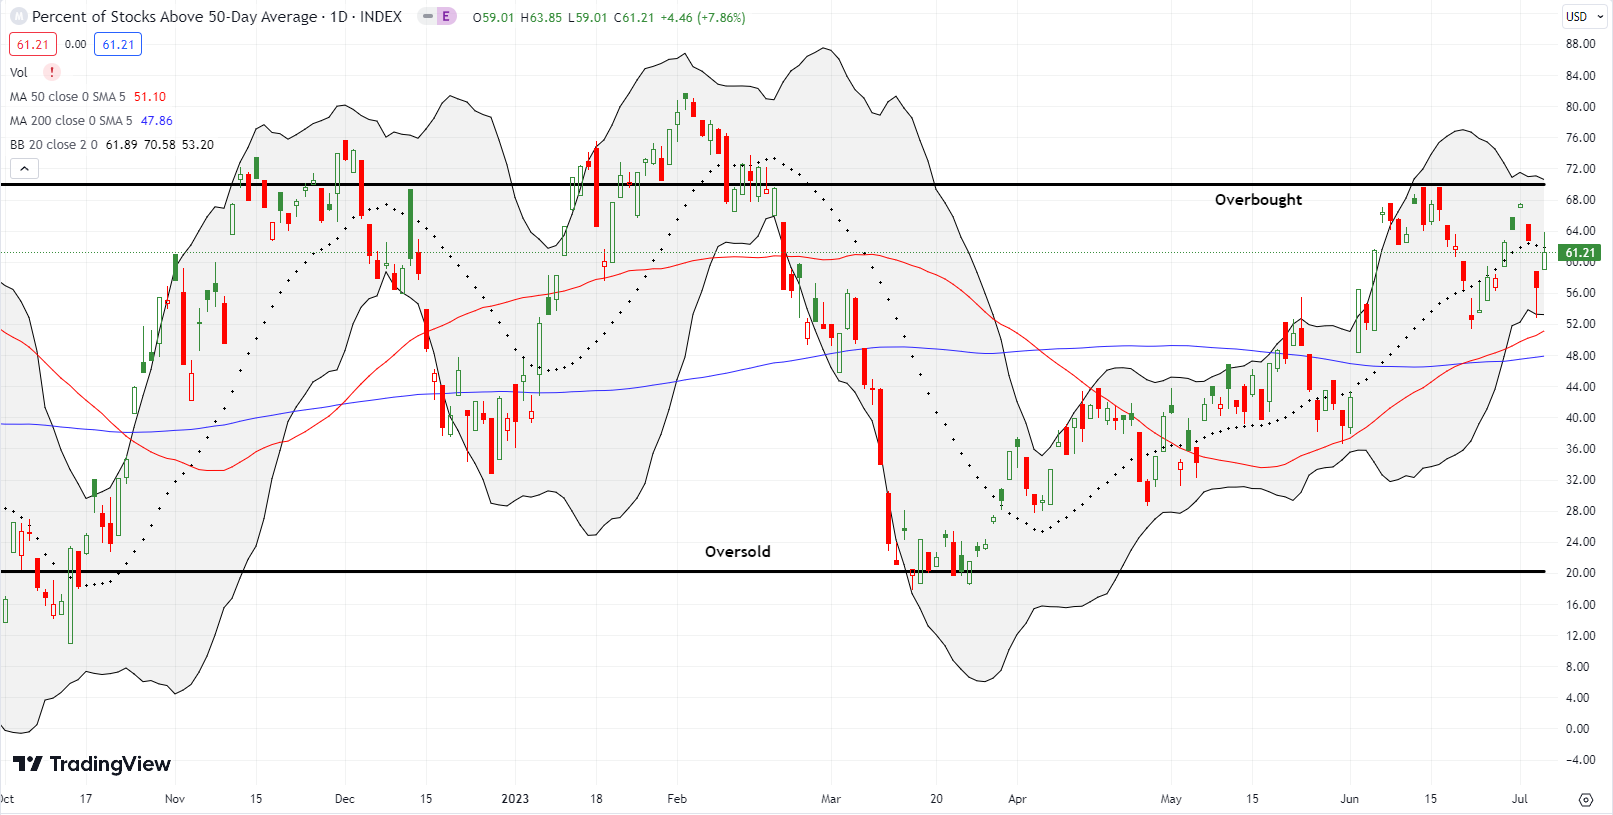
- AT50 (MMFI) = 61.2% of stocks are trading above their respective 50-day moving averages
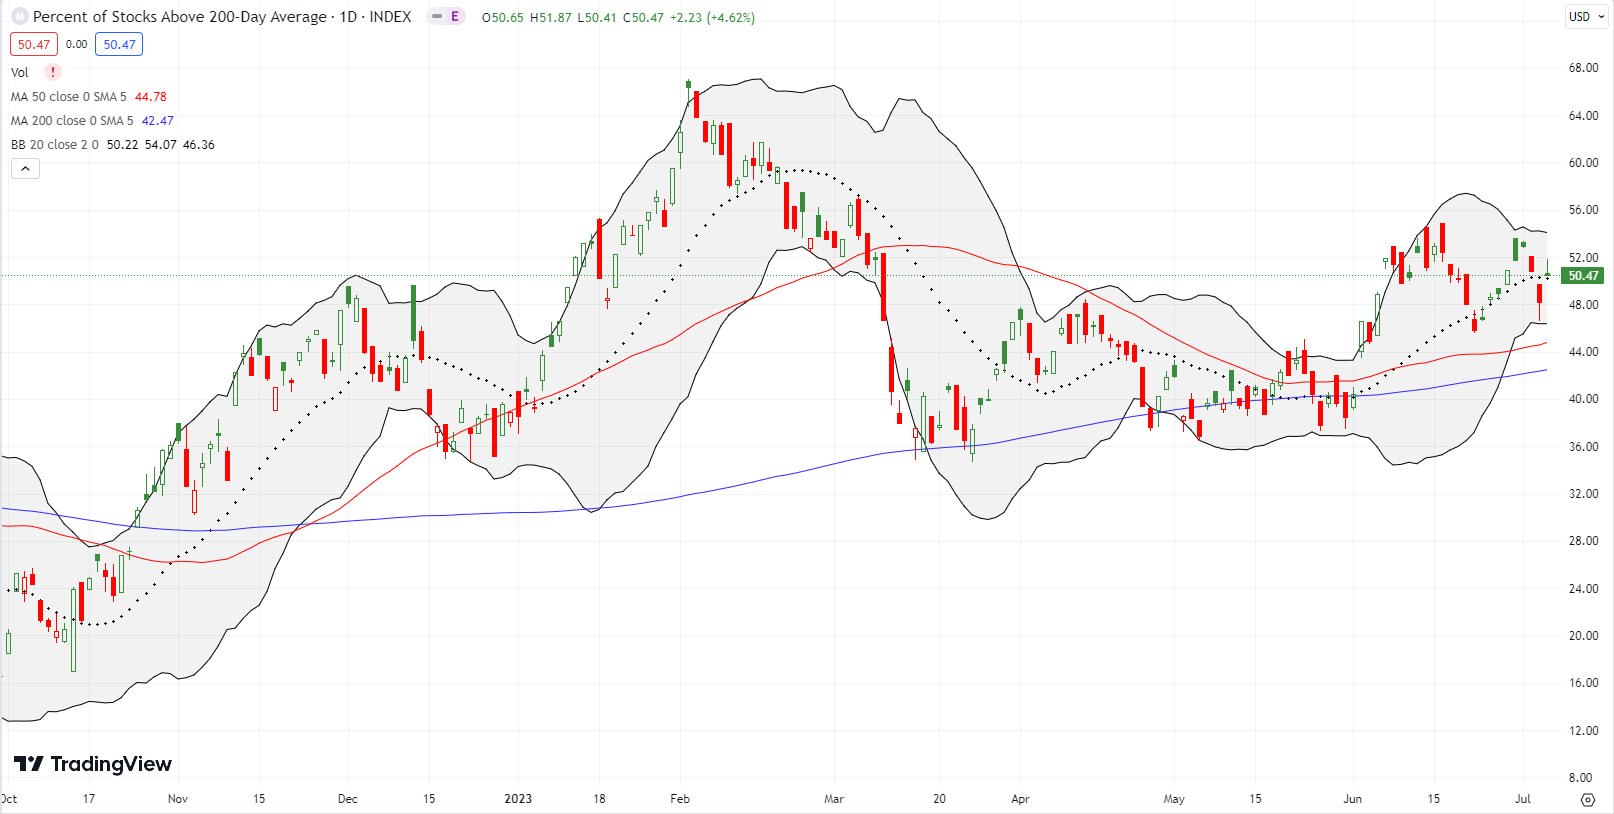
- AT200 (MMTH) = 50.5% of stocks are trading above their respective 200-day moving averages
- Short-term Trading Call: neutral
AT50 (MMFI), the percentage of stocks trading above their respective 50DMAs, closed at 61.2%. My favorite technical indicator got as high as 67.5% to start the week, right below the overbought threshold of 70%. AT50 got as low as 52.7% before rebounding intraday on Thursday. Small caps helped AT50 notch a gain on Friday. Still, this second failure in a month to break through the overbought threshold increases my sense of caution. I still prefer to buy the dips but now fading rallies into resistance looks slightly more interesting. The upcoming earnings season represents the next tell. I will be looking for the ability of buyers and sellers to sustain the initial post-earnings responses in the stocks I monitor using scans like SwingTradeBot.
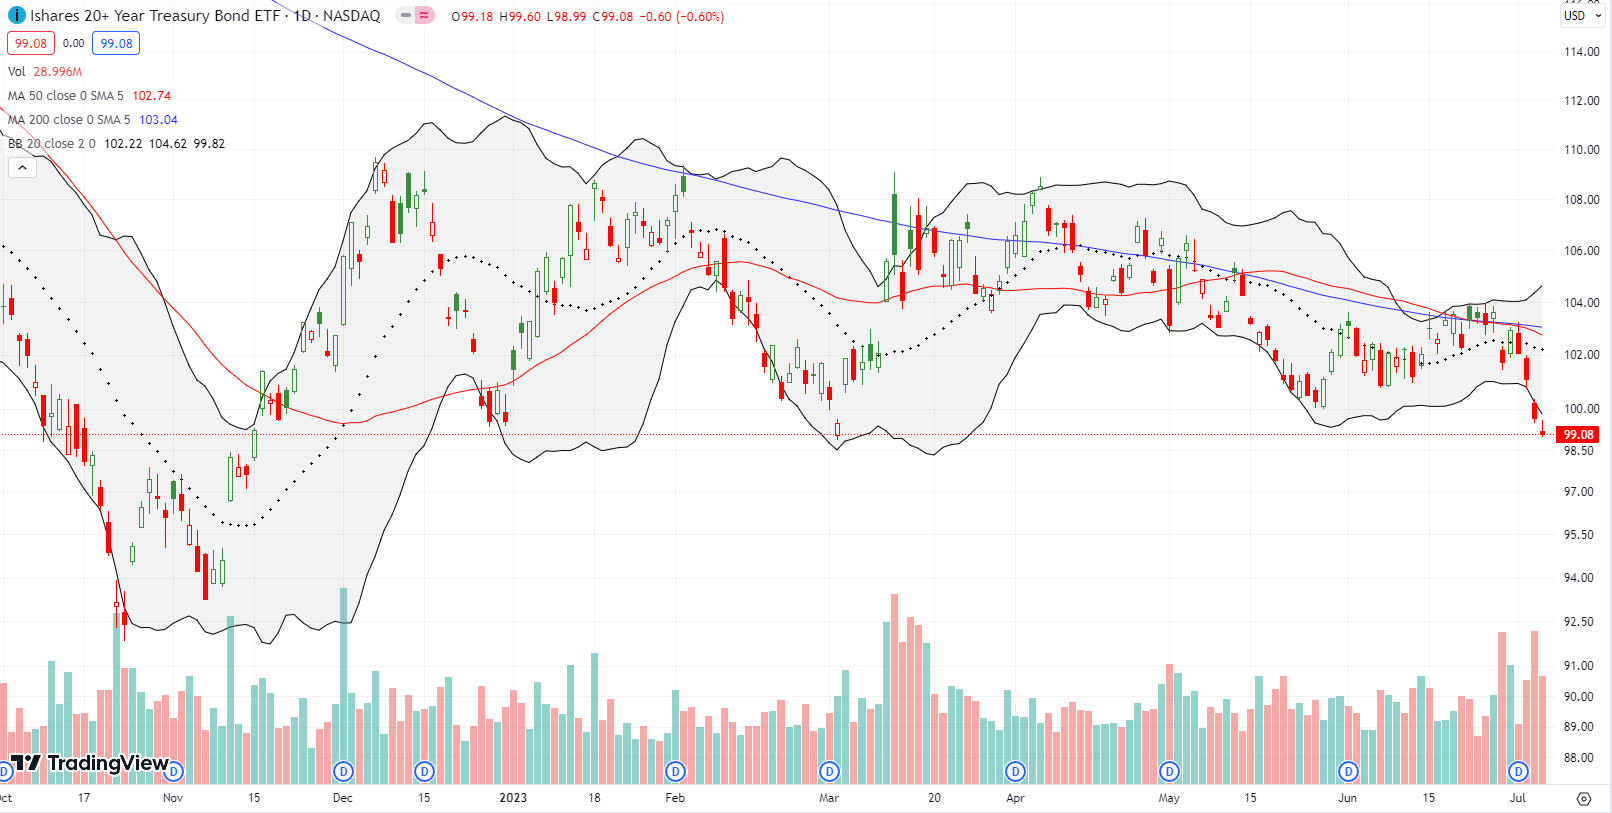
I made the case for shorting the iShares 20+ Year Treasury Bond ETF (TLT) in the wake of the debt ceiling crisis. My profits in a TLT September put spread came as TLT gapped down and closed below its lower Bollinger Band (BB). With the jobs report coming the next day, I saw poor risk/reward in continuing to hold. As it turned out, the market interpreted the softer than expected employment numbers as a reason to sell bonds. TLT now trades at an 8-month low and looks ready to slip to the lows from last October and November. I hope to fade the next rally.
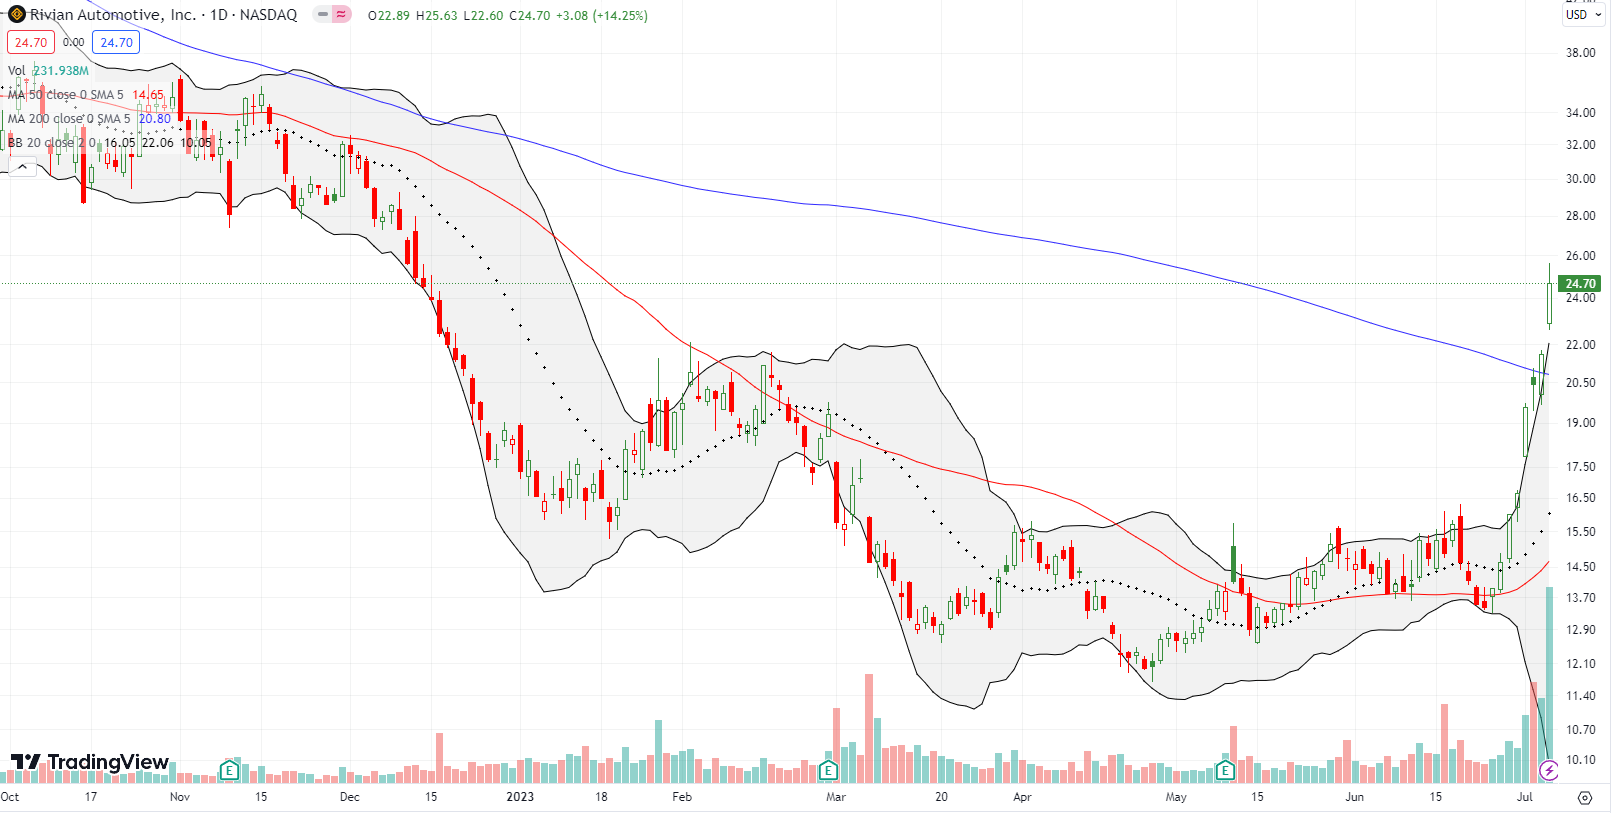
I took a loss on EV truck manufacturer Rivian Automotive, Inc (RIVN) some time ago. So it hurts a bit to see RIVN spring to life over the past 2 weeks. The breakout on June 30th ahead of production numbers was the first clue indicating a change in sentiment. RIVN soared 17.4% the following Monday in the wake of reporting Q2 production of 13,992 trucks. Buyers have been unrelenting ever since.
The Fast Money crew gave clashing arguments for sticking with the momentum versus fading. RIVN is certainly over-stretched with 5 consecutive days closing above its upper-BB. However, if I shorted RIVN here, I would keep the position on a tight leash and take profits at or near 200DMA support (the bluish line).
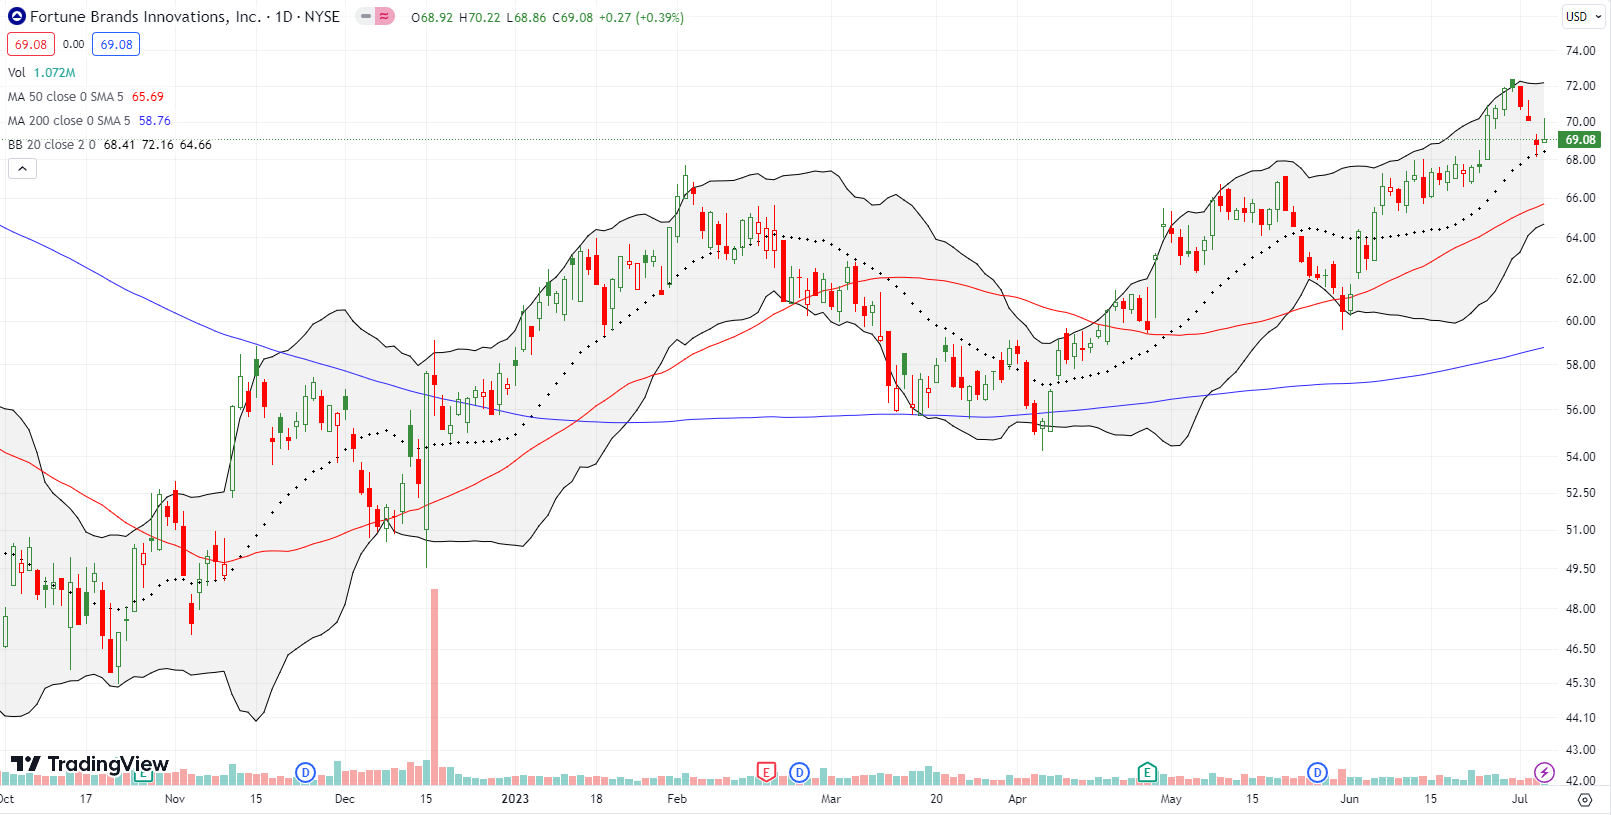
Fortune Brands Innovations, Inc (FIBN) is a building products and equipment company based in Illinois. This year’s momentum follows the fortunes of the housing market. I noticed the breakout in the previous week and waited patiently for a buying opportunity. That opportunity came on Friday as the stock moved to confirm a picture-perfect test of support at its 20DMA. The fade into the close makes this trade more tenuous, but I am optimistic for now that FIBN can hold its breakout.
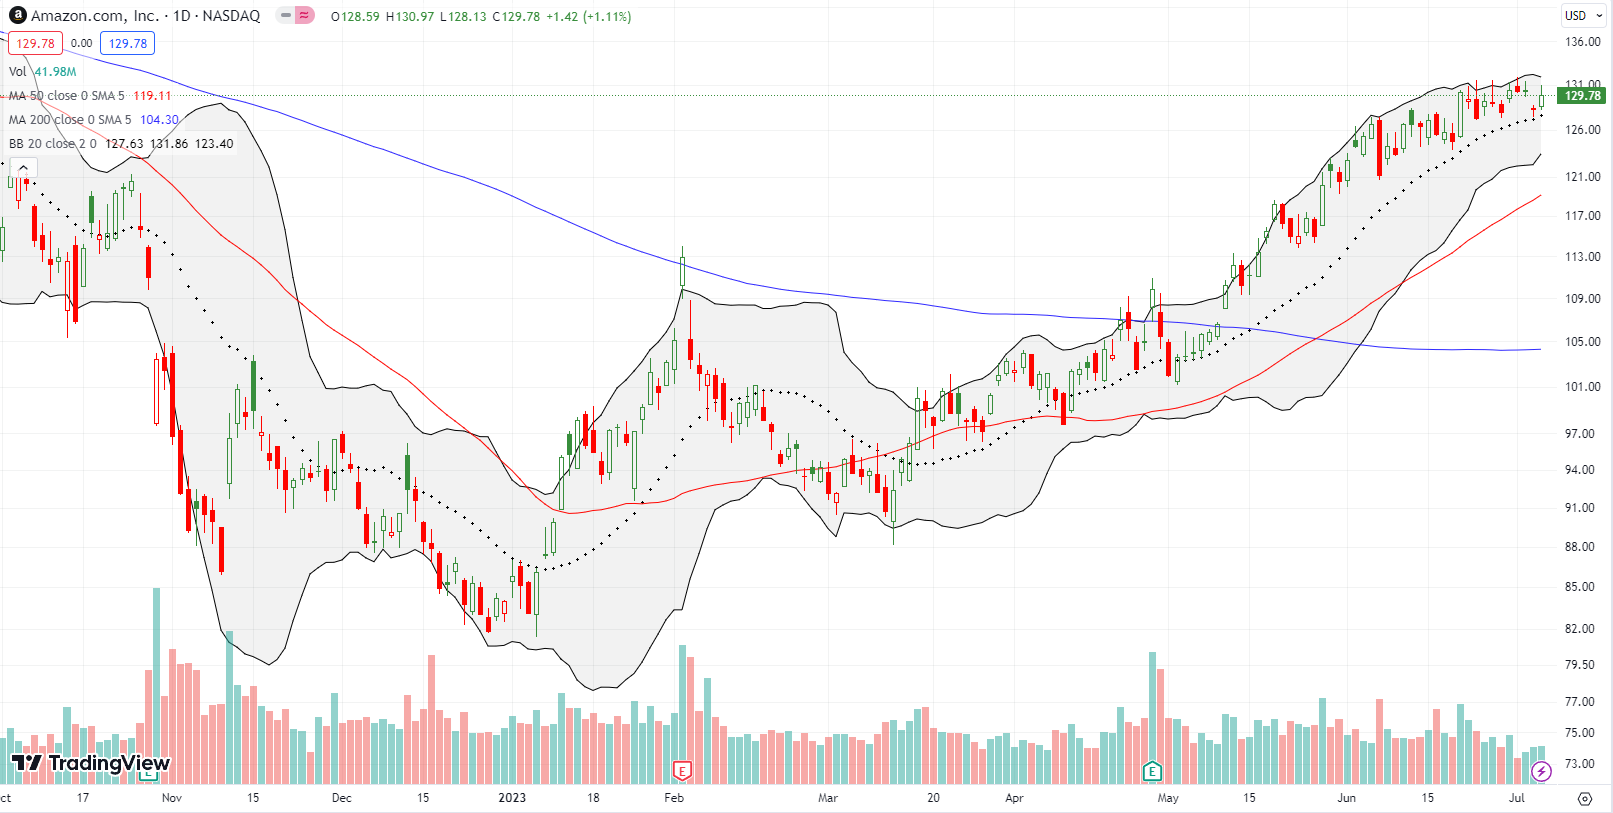
Prime Day is coming Amazon.com (AMZN) (click here for my affiliate link to start shopping). The stock looks ready to break out going into the shopping bonanza, so I bought an AMZN call spread after the stock bounced from 20DMA support. This support has held firm since March, so I am hoping to at least avoid taking a loss. Enjoy the deals!
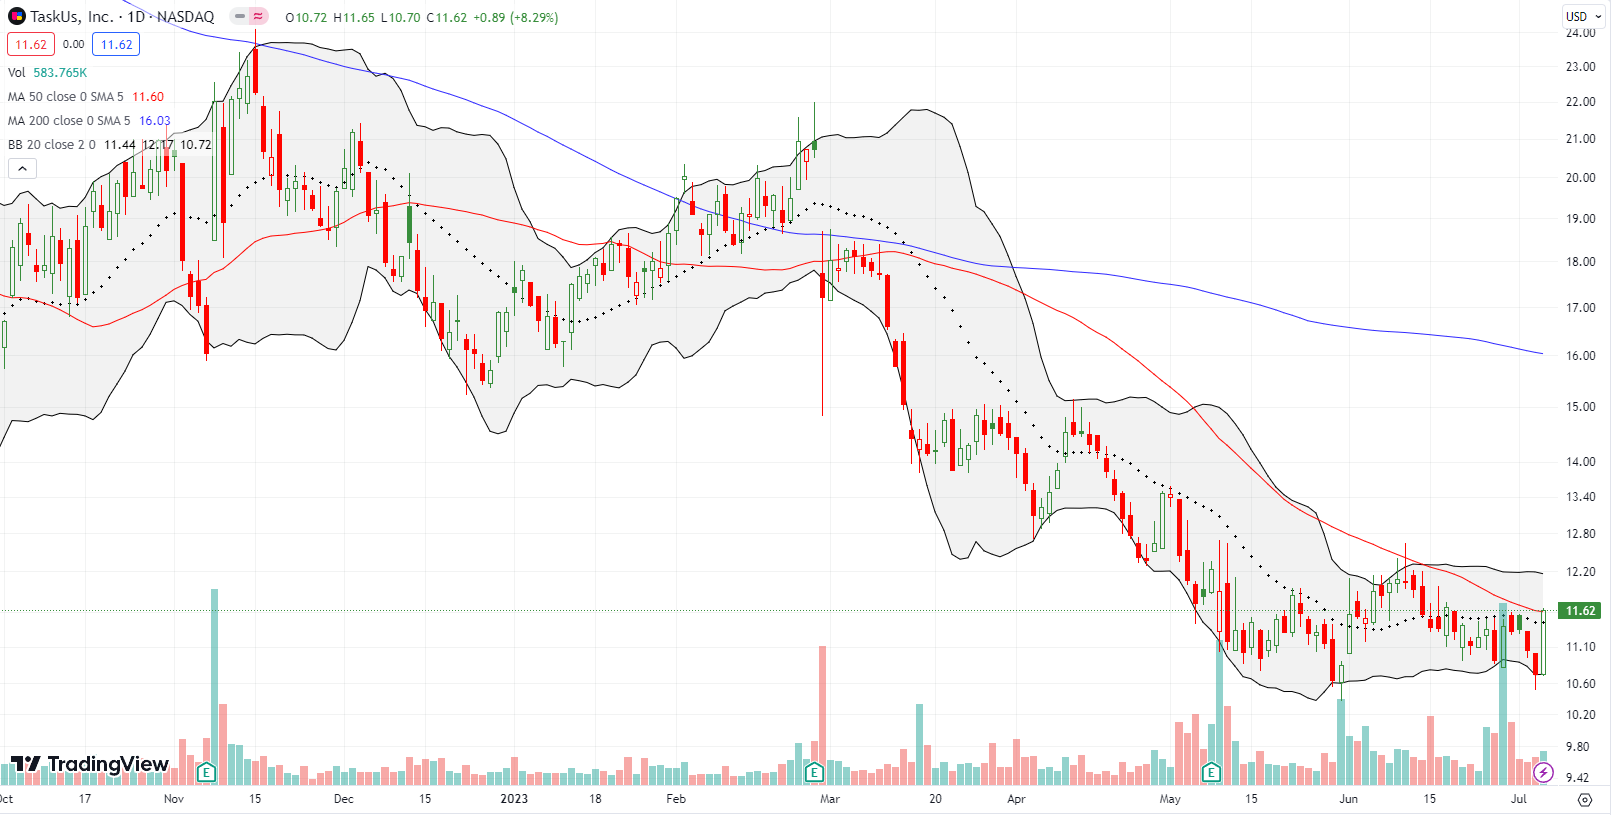
I took a flyer on buying digital marketing company Taskus Inc (TASK). TASK has had an awful year, but buyers have tried to defend current price levels since May earnings. Note in the chart below the prominence of the buying days versus the selling says (the vertical bars represent trading volume – green is buying volume, red is selling volume). I see the hints of accumulation which will get confirmed with a close above June’s high. From there, the stock could run all the way back to 200DMA resistance.
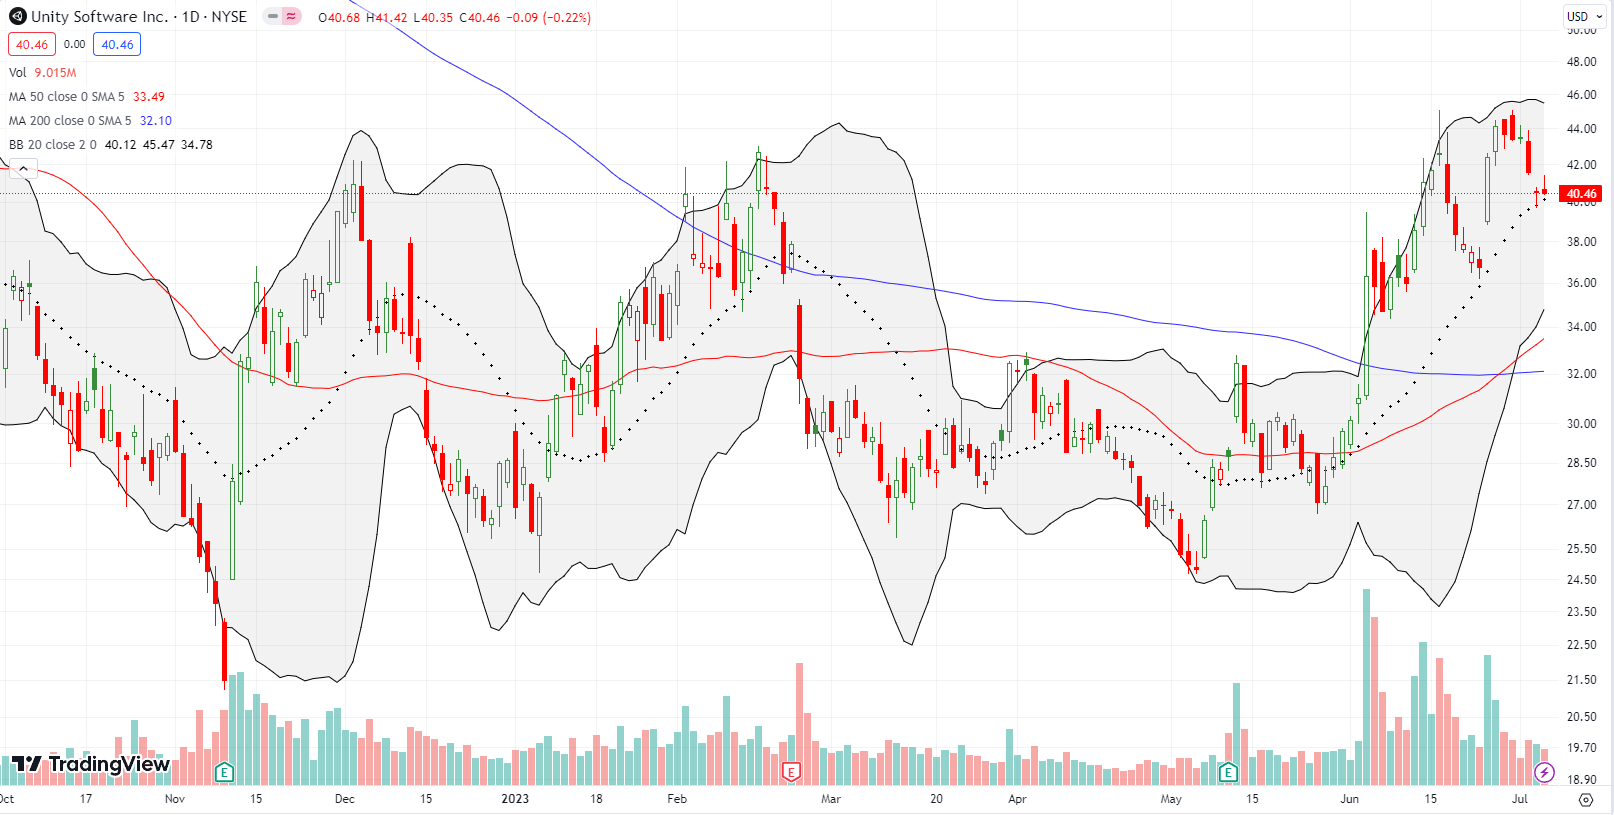
My son is using Unity Software Inc (U) this summer to program video games. Accordingly, the stock returned to my radar. I made two successful trades in U: after the last 200DMA breakout and after a picture-perfect test of 20DMA support. My third trade also triggered off 20DMA support. However, U’s chart looks similar to the NASDAQ’s. Thus, the positioning is precarious. Still, I am interested in accumulating a bigger position, so I am a buyer on a test of 50DMA and/or 200DMA support.
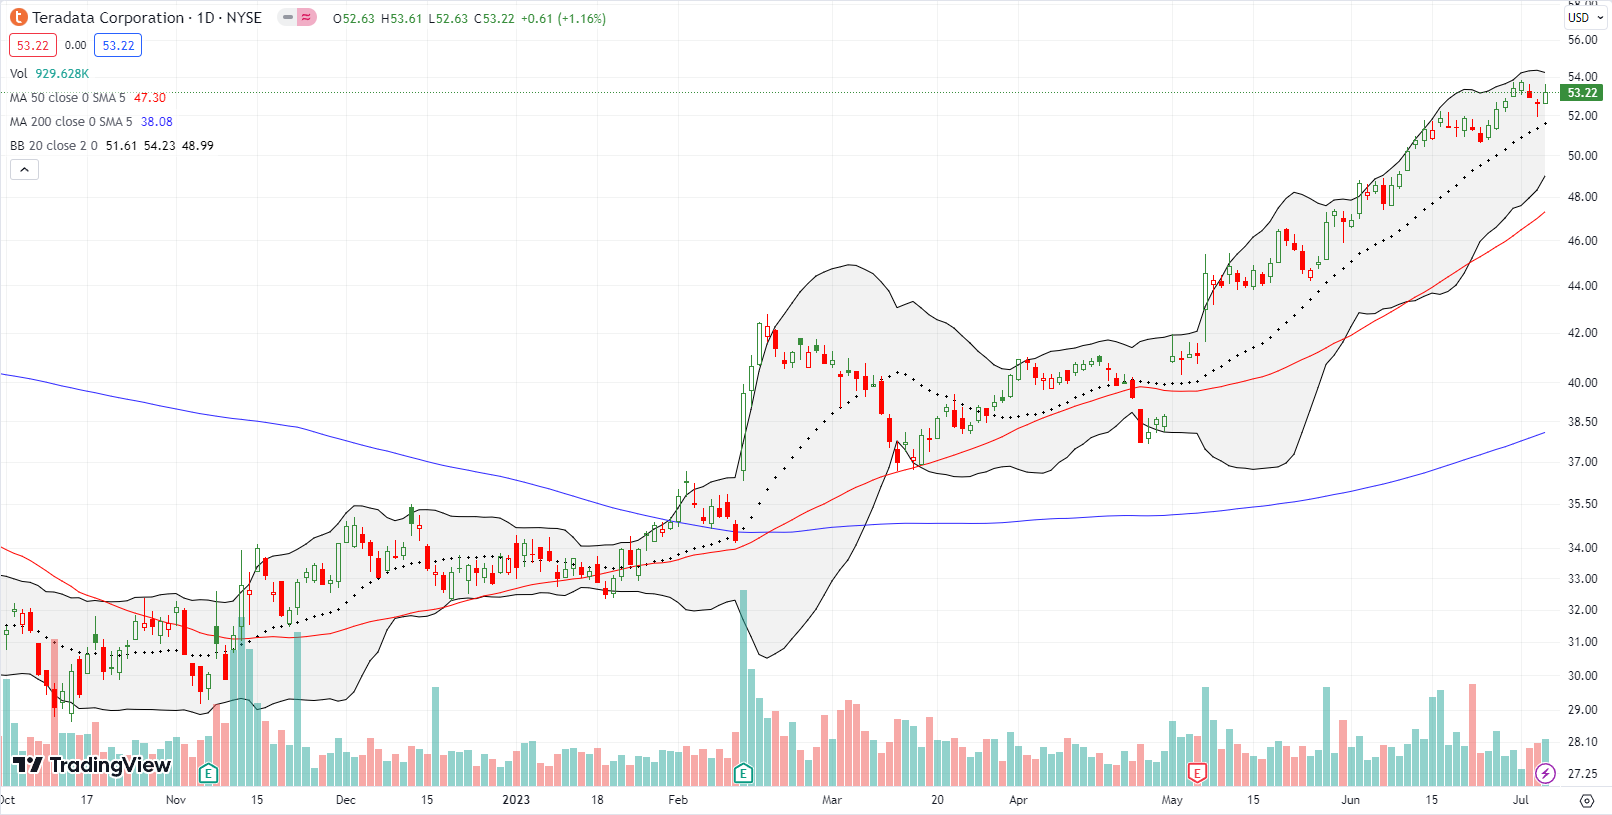
Oh so quietly Teradata Corporation (TDC) has delivered a stellar year. This old school big data software company seems to be back in favor as it markets a cloud solution for analytics. While I feel very late to the game, I am keeping TDC on my radar to buy on a dip. TDC has enjoyed three consecutive positive post-earnings responses including an 8.4% surge in May that refreshed momentum in the stock. TDC trades around a 20-month high.
Be careful out there!
Footnotes
Subscribe for free to get email notifications of future posts!
“Above the 50” (AT50) uses the percentage of stocks trading above their respective 50-day moving averages (DMAs) to measure breadth in the stock market. Breadth defines the distribution of participation in a rally or sell-off. As a result, AT50 identifies extremes in market sentiment that are likely to reverse. Above the 50 is my alternative name for “MMFI” which is a symbol TradingView.com and other chart vendors use for this breadth indicator. Learn more about AT50 on my Market Breadth Resource Page. AT200, or MMTH, measures the percentage of stocks trading above their respective 200DMAs.
Active AT50 (MMFI) periods: Day #69 over 20%, Day #43 over 30%, Day #40 over 40%, Day #26 over 50%, Day #1 over 60%, Day #94 under 70%
Source for charts unless otherwise noted: TradingView.com
Full disclosure: long AMZN call spread, long U, long FBIN
FOLLOW Dr. Duru’s commentary on financial markets via StockTwits, Twitter, and even Instagram!
*Charting notes: Stock prices are not adjusted for dividends. Candlestick charts use hollow bodies: open candles indicate a close higher than the open, filled candles indicate an open higher than the close.


