

Stock Market Commentary:
Yes. The stock market can be both complacent and oversold. A week ago I described how stocks left regional banks behind. Last week, the overall market took comfort in the on-going, yet narrowing, strength in big cap tech stocks even as industrials and other economically sensitive stocks stumbled into weakness. The resulting divergence is rare to see: market breadth dropped into “close enough to oversold” territory even as the volatility index fell to new lows. I never like a complacent market going into earnings season. So it will be interesting to see which side of the ledger wins.
The Stock Market Indices
The S&P 500 (SPY) ended the holiday shortened week holding the line at its May, 2021 low as support. As a result, the index remains well-positioned to challenge the high of the year set in early February. It is hard to reconcile that this is a chart in a nearly oversold stock market. Even if buyers exhaust themselves in the coming earnings season, sellers will have a lot of work to do to push the S&P 500 through multiple layers of support. I like buying here with a stop below the May, 2021 support. Below that, trading could be a choppy mess as the price action bounces around a crowded field of important technical levels.
")
The NASDAQ (COMPQ) started the week in a strong position. The tech-laden index had the opportunity to usher in a new bullish phase by following through on a marginal breakout to a 7-month high. Buyers were not up to the task. The NASDAQ ended the week clinging to the line at the September, 2020 high. The NASDAQ almost looks ready to push the stock market into oversold conditions. However, given the way buyers have rushed to big cap tech as “safety” trades (for example, see the stocks of “The Latest Lap On the Generative AI Trade“), the path downward will likely be slow. Moreover, both the 20-day moving average (DMA) (the dashed line) and the 50DMA (the red line) are in uptrends and support an overall bullish bias for the index.
")
The iShares Russell 2000 ETF (IWM) continues to underperform as it takes the brunt of the damage from recession fears and the woes in regional banking. IWM looks ready for oversold conditions now that it has flipped to the “bearish side” of its 20DMA. Still, I am impressed by IWM’s overall resilience. I took profits on my IWM call spread at the beginning of the week. I am a buyer again with a test of support at the pre-pandemic high during oversold trading conditions.
")
Stock Market Volatility
The volatility index (VIX) suggests market participants have very little concern or fear. The VIX’s attempt to hold the lows of the year even looks in peril. With earnings season ahead, this churn just below the 20 level is setting up the next big move in the stock market, whether up or down.
")
The Short-Term Trading Call While Complacent and Near Oversold
- AT50 (MMFI) = 29.3% of stocks are trading above their respective 50-day moving averages
- AT200 (MMTH) = 42.4% of stocks are trading above their respective 200-day moving averages
- Short-term Trading Call: cautiously bullish
AT50 (MMFI), the percentage of stocks trading above their respective 50DMAs, pulled back to 29.3% at the end of the week. The pullback was a major cooling from the surge during the previous week. The stock market slipped from the edge of a major bullish push and fell into a region which looks more like chop and churn. The good news is that this area is “close enough” to oversold. This co-existence of near oversold trading conditions and relatively low volatility means traders must pick between poison and opportunity.
In my last review of the housing market, I interpreted the technical signals and housing data as enabling one last round for the seasonally strong period for housing stocks. I used the 50DMA on the iShares US Home Construction ETF (ITB) as the swing factor. I opened a very conservative calendar call spread for starters. Unfortunately, ITB failed to follow through on its breakout move and fell back toward its 50DMA. Assuming ITB does not sell further in the short-term, I will add to that position. ITB, and the home builders in general, continue to confound the poor economic prospects that lay ahead.
")
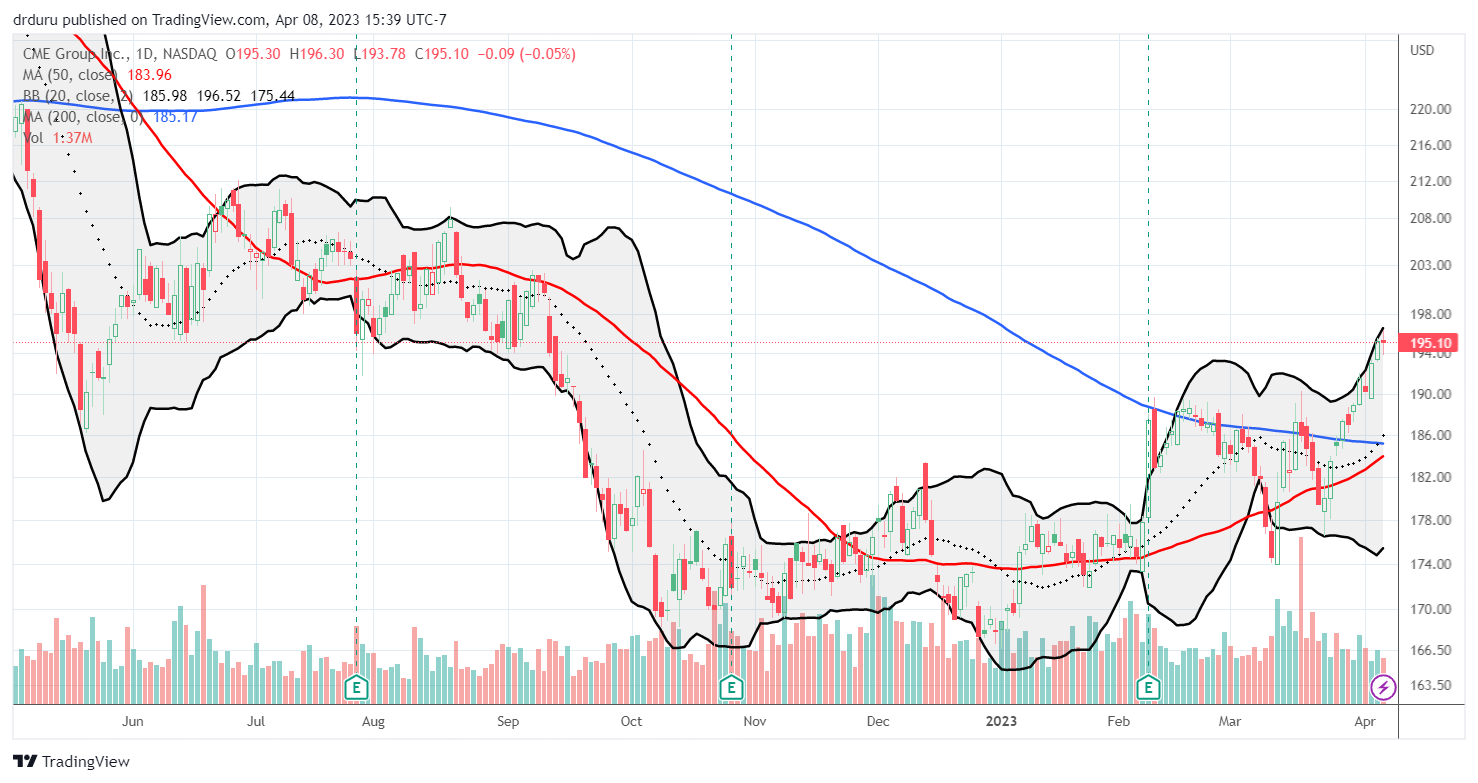
I last wrote about CME Group, Inc (CME) back in July. As an operator of contract markets for the trading of futures and options on futures contracts worldwide, I saw CME as a major beneficiary of last year’s increased volatility. However, CME never demonstrated buying interest and proceeded to sink with the rest of the market into the October lows. I finally jumped into CME after it broke out above its 50DMA in early in December. The stock proceeded to sell off with the market and made new lows for the year.
Even the path to the current breakout has been a roller coaster. The twists and turns included a 5.4% post-earnings gain that failed at 200DMA resistance (the blue line). In other words, CME has suffered from the very volatility I thought would benefit the company. While I am relieved the stock has fought back to a bullish trading mode, I am holding on to the edge of my seat!
Tesla, Inc (TSLA) is one of many stocks that benefited from a return of speculative fury at the beginning of the year. TSLA also topped out with the rest of the market. Yet, the stock’s pullback has been relatively mild with the 50DMA uptrend holding as support at its first test. The second test last week did not hold up. I tried a play for a robotic rebound with a calendar call spread. I am now riding the long side of the spread going into next week. However, Tesla announced its 5th price cut of the year on Friday. So now I am thinking this 50DMA breakdown may be the start of a change in fortunes.
")
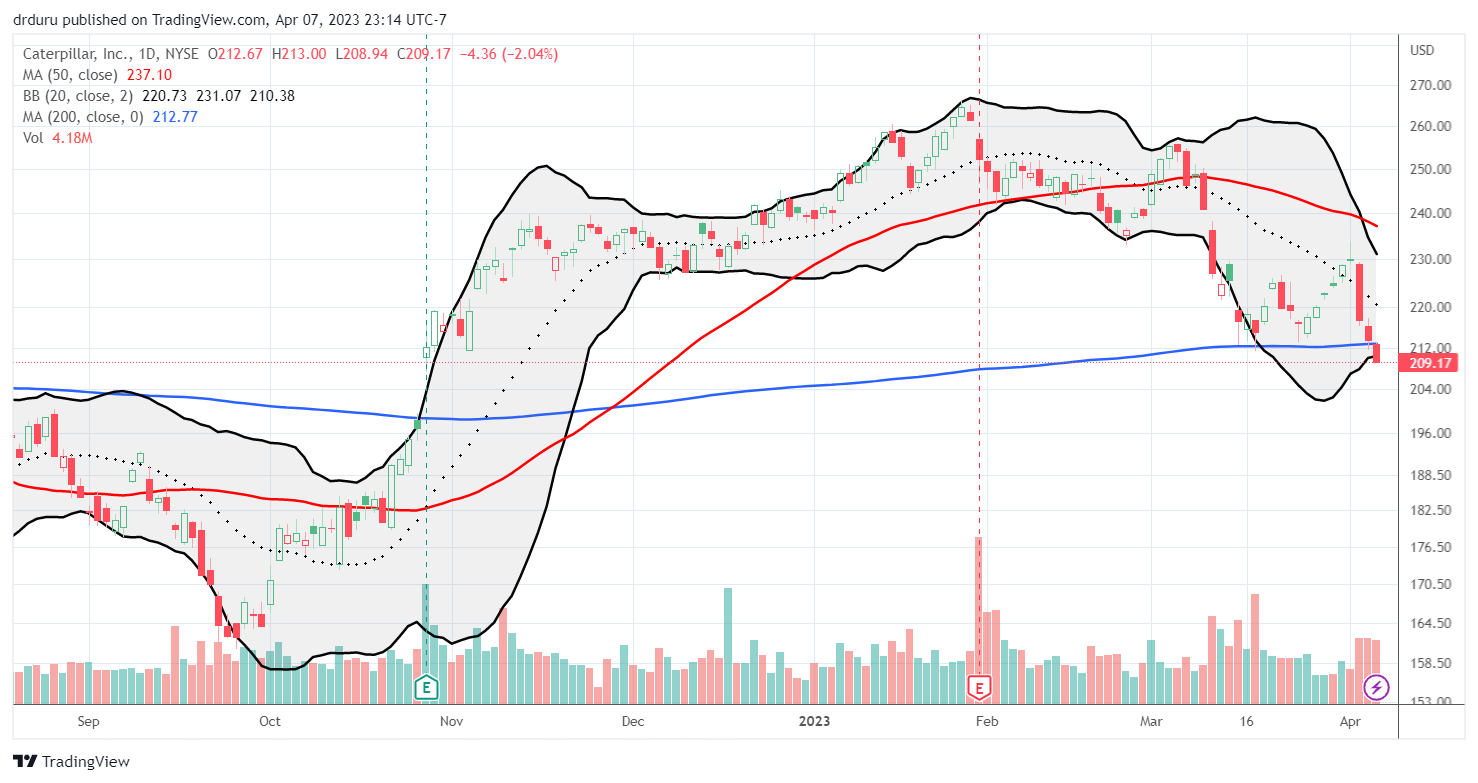
Caterpillar, Inc (CAT) represents the freshly weak part of the market. Sellers stepped into the picture the last three days and forced CAT into a 200DMA breakdown. Over the past month, buyers worked to defend the 200DMA as support. CAT now looks ready to fill its October post-earnings gap up. At the 200DMA, I took profits on a fortuitous put spread. I still hold an April $205 put.
Fabrinet (FN) is a Thailand-operated company which specializes in optical product manufacturing. FN caught my attention by making the top loser’s list for Friday. The stock’s 8.6% drop was apparently in sympathy with a poor earnings performance from peer Lumentum Holdings Inc (LITE). LITE lost 9.7% and closed near a 4-year low. FN looks much better in comparison, but the 200DMA breakdown puts FN in a vulnerable position. The stock is a short and a fade on a bounce until a fresh close above 200DMA resistance.
")
")
")
Be careful out there!
Footnotes
Subscribe for free to get email notifications of future posts!
“Above the 50” (AT50) uses the percentage of stocks trading above their respective 50-day moving averages (DMAs) to measure breadth in the stock market. Breadth defines the distribution of participation in a rally or sell-off. As a result, AT50 identifies extremes in market sentiment that are likely to reverse. Above the 50 is my alternative name for “MMFI” which is a symbol TradingView.com and other chart vendors use for this breadth indicator. Learn more about AT50 on my Market Breadth Resource Page. AT200, or MMTH, measures the percentage of stocks trading above their respective 200DMAs.
Active AT50 (MMFI) periods: Day #11 over 20% (overperiod), Day #1 under 30% (underperiod ending 4 days over 30%), Day #21 under 40%, Day #23 under 50%, Day 33 under 60%, Day #35 under 70%
Source for charts unless otherwise noted: TradingView.com
Full disclosure: long QQQ put spread, long VXX call spread, long CAT put, long TSLA call
FOLLOW Dr. Duru’s commentary on financial markets via StockTwits, Twitter, and even Instagram!
*Charting notes: Stock prices are not adjusted for dividends. Candlestick charts use hollow bodies: open candles indicate a close higher than the open, filled candles indicate an open higher than the close.