
Stock Market Commentary
Last week featured yet another episode of momentary panic proceeded by a virtual “all clear” signal. In the middle of the week, the S&P 500 (SPY) broke down just as the stock market hit extremes. Subsequently, buyers stepped into the breach. As a result, the very next day, the stock market rebounded from the brink of a real sell-off. A real sell-off would have featured an S&P 500 breaking down below its support line at the 50-day moving average (DMA) along with a volatility index (VIX) that managed to at least tag the intraday highs of the last pullback. Instead, 50DMA support and various extremes at the brink set off a broad-based buy signal for traders and investors.
The Stock Market Indices
As I noted in the previous Above 40 post, sellers had a lot of work ahead to make their case. I also noted that since last year’s April breakout above the 50DMA, the S&P 500 (SPY) closed below that line all of 15 trading days. The last time the S&P 500 spent more than a day below its key support line was the brief October pullback. Last week’s climactic pullback failed to add to the total as sellers refused to put in the necessary work. The index gapped up slightly the day after approaching its 50DMA support and never looked back. The S&P 500 closed the week at 20DMA resistance.
The S&P 500 (SPY) rebound shot right through my 4116 dividing line between neutrality and bearishness. With the index right back in the middle of the previous consolidation range, my put spreads on the index work like hedges instead of outright bearish bets. The S&P 500 effectively already hit my May target of a test of 50DMA support…just at a higher point than I anticipated.
A double top remains in place for the NASDAQ (COMPQX). However, as with the S&P 500, buyers made a case for a short-term bottom on the tech-laden index. The 13,000 level neatly served as support with the last day of the week serving as confirmation. Still, the NASDAQ needs a 50DMA breakout to seal the deal and next make a run at invalidating the double top.
A topping pattern is still slowly developing in the iShares Trust Russell 2000 Index ETF (IWM). The rebound of the last two trading days off the brink saved IWM from a breakdown and preserved the grinding pivot around the 20 and 50DMAs. I see no trade on IWM until the index of small caps breaks the spell of this trading range.
Stock Market Volatility
The volatility index (VIX) sprung to life and subsequently imploded. True to the history I noted in the last Above the 40 post, the VIX could not sustain the concentrated fear embedded in a 65% 3-day surge. Still, I was a bit surprised to see the thorough fading on the VIX. Enthusiastic stock buyers vaporized 2 days of large gains. With the VIX under 20 again, sheer momentum looks like it can carry the VIX right back toward the bottom of the previous trading range in short order.
The Short-Term Trading Call Amid the Extremes
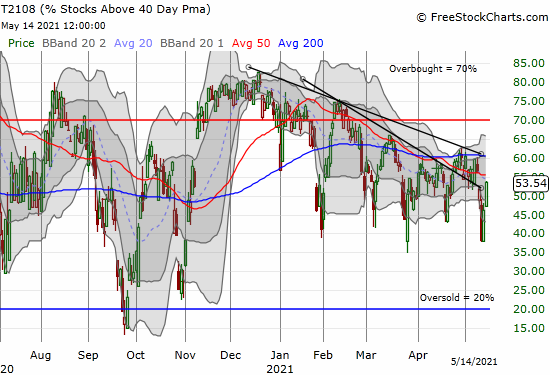
- AT40 (T2108) = 53.5% of stocks are trading above their respective 40-day moving averages
- AT200 (T2107) = 74.9% of stocks are trading above their respective 200-day moving averages (TradingView’s calculation)
- Short-term Trading Call: neutral
AT40 (T2108), the percentage of stocks trading above their respective 40DMAs, rebounded from the brink of 2021 lows. As a reminder, in a bull market, the low to mid-30s often serves as “close enough” to oversold; this year, 35-45% is turning into “close enough.” My favorite technical indicator jumped from 38.2% to 53.5% and looks poised to challenge the primary downtrend – now around 60%. That downtrend held firm as resistance the previous week and set up last week’s pullback.
The collective extremes that formed the brink – major indices closing below lower BBs, the VIX surging fast and furious, and AT40 swiftly dropping below 40% – created a difficult trading call. I switched to cautiously bearish to stay consistent with the bearish start to the week. Now, I make the difficult decision to churn the trading call right back to neutral even though I still do not like the short-term tenor of the market. I cannot be outright bearish in the middle of a rebound off extreme trading conditions. I have my sights trained on AT40’s primary downtrend as the next test. Given last week’s experience, I will be quick to flip right back to bearish if AT40 confirms that resistance again. Bracing for chop and whiplash remains the order of the day!
I managed my short-term trades by taking profits and otherwise shedding most of my bearish positions as soon as the market gapped away from the brink on Thursday. Targeted buys came from charts I showed in prior posts, and I took profits on most new positions by Friday. I am now comfortably neutral on the market.
Stock Chart Video Reviews
Stock Chart Reviews – Below the 50DMA
The Trade Desk (TTD)
The plunge in The Trade Desk (TTD) was consistent with the overall retreat from expensive growth stocks. The 26.0% post-earnings loss took TTD to a 7-month low which in turn reversed the entirety of the stock’s last breakout. Despite the destruction, buyers managed to hold the line the rest of the week. I am a buyer on a follow-through to Friday’s post-earnings high. TTD is only a short on a new low or as a fade at resistance from the 20/50/200 DMAs looming overhead (the dotted, red, and blue lines respectively).
LendingTree, Inc.
It is uncommon to find stocks that have a clear line of sight to their pandemic lows. LendingTree (TREE) is one of those stocks. Since an 11.4% post-earnings loss on April 29th, sellers drove TREE downward for 9 of the next 11 trading days. The market’s bounce from the brink reawakened buying interest in TREE. After Thursday’s stabilization, TREE surged 10.8% on Friday. The move looks like a classic “dead cat bounce.” TREE suffers from 24% of its float sold short, so I have to guess those shorts (smartly) rushed to take some profits in the face of the general market’s shift to more bullish sentiment.
Lemonade (LMND)
Speaking of lending brokers, Lemonade (LMND) has suffered alongside LendingTree. LMND tried to stabilize through much of March and April but broke down ahead of earnings. The 18.5% post-earnings plunge was perfectly timed for the stock market’s brink. LMND enjoyed the subsequent rebound and is already close to erasing all its post-earnings loss. Given the potential here for a washout of sellers, I am looking to buy after a complete reversal of the post-earnings loss. LMND is only a short on a new low or as a fade at overhead resistance from the 20/50/200 DMAs.
Snowflake (SNOW)
Despite all the IPO excitement about cloud software company Snowflake (SNOW), the stock has managed only one sustained rally in its 10-month existence. SNOW made a splash by opening at double the price of its $120 IPO. For three weeks starting in mid-November, SNOW rallied through its intraday high from opening day. Sellers have been largely in control ever since. The growth tantrum took SNOW to an all-time low in March. May’s selling set fresh all-time lows. Given the context, I look at Friday’s 11.6% surge as a dead cat bounce.
Vuzix Corp (VUZI)
My post-secondary trade on Vuzix (VUZI) only lasted a few days. Soon after I took profits, the stock printed what now stands as VUZI’s all-time high. May’s 50DMA breakdown sealed the deal on that top. A post-earnings gap down stopped right at the March low. That successful defense of support makes VUZI a buy with a stop below that intraday low. The upside target is right at 20/50DMA resistance.
Stock Chart Reviews – Above the 50DMA
Apple (AAPL)
The clearest signal of a successful turn-around from the brink came from Apple (AAPL). The stock sat right on top its 200DMA with the stock market at its brink of a real sell-off. A real sell-off should certainly include an AAPL breakdown, but the stock refused to cooperate. Indeed, the subsequent rebound pushed AAPL right through 50DMA resistance. Follow-through buying will make AAPL bullish all over again even with a declining 20DMA and looming resistance from the post-earnings intraday high.
Alphabet (GOOG)
Alphabet (GOOG) was one of the few buys I held after Friday’s close. GOOG was also one of the first buys I made after Thursday’s bullish open. The stock is attractive because it managed to hold its ground post-earnings for over a week before succumbing to the general market selling pressure. GOOG even made one more all-time high and avoided tapping 50DMA support. My 2340/2360 call spread expires this coming Friday.
Big 5 Sporting Goods (BGFV)
The chart below is a textbook uptrend. Big 5 Sporting Goods (BGFV) was a “set it and forget it” buy I wish I recognized months ago. Post-earnings the stock broke out with a 31.2% post-earnings gain and pushed higher for another 3 trading days. The stock broke through its former all-time high set in early 2005 before taking a rest. I am now looking for signs of buyer’s exhaustion. BGFV remains a buy at or around its 20 and/or 50DMA.
Harley Davidson (HOG)
A Bollinger Band (BB) squeeze is forming around Harley Davidson (HOG). I like HOG given it continues to hold all its first day post-earnings gains. The BB-squeeze sets up the potential for a big breakout once the squeeze resolves. I bought June $50 call options.
Nutanix (NTNX)
Nutanix (NTNX) suffered a breakdown during the growth tantrum. The stock actually has a reasonable valuation of less than 4 times sales, so I still like it as a buy. Accordingly, I jumped back into shares in early March just above 200DMA support. NTNX went almost nowhere from there until last week’s breakout. Now NTNX is one of the more bullish looking charts I have. I am targeting an eventual test of the 2021 highs.
BHP Group (BHP)
With the stock market descending into a more bearish mood, iron ore and diversified commodities company BHP Group (BHP) broke out well above its upper Bollinger Band (BB). Regular readers know I have a hard time holding positions which get into stretched/overbought positions. Accordingly, I took profits on my BHP shares and call options. The pullback to 20DMA support is very buyable, and I am going right back into accumulation mode. I remain firmly bullish on commodities and materials in this reflation/inflationary economic environment.
Rio Tinto (RIO)
Over the last buying cycle, I held BHP and did not pair it with iron ore company Rio Tinto (RIO) either short or long. This time around, I will accumulate both BHP and RIO.
Lowes Companies (LOW)
When I see the inexplicable burst higher in Lowes Companies (LOW), I cannot help think back to the bizarre rally in the likes of Viacom (VIAC) and Discovery (DISC). It turned out a single hedge fund drove prices higher with concentrated buying. A secondary from VIAC helped blow up that trade. LOW has earnings coming this week. Given the sharp pullback in the stock last week, I am watching VERY closely to see whether LOW can produce the results required to justify the prior run-up. The stock is a short on a 50DMA breakdown.
Microsoft (MSFT)
Redemption for big cap tech came in the form of Microsoft (MSFT). MSFT made a clean 50DMA breakout by gapping over the line and never looking back. As a result, MSFT already looks like a buy for the week. The downtrending 20DMA capped MSFT the previous week, so I am looking out for whether it becomes resistance again.
Facebook (FB)
Facebook (FB) still looks like the stock that traders love to buy on bad news. FB did not quite touch its 50DMA before gaining 4.4% in two trading days. Like so many other stocks, FB faded its post-earnings gains; sellers took seven days to do it. Yet, they could not follow-through effectively from there. The $300 level looks like important (psychological) support.
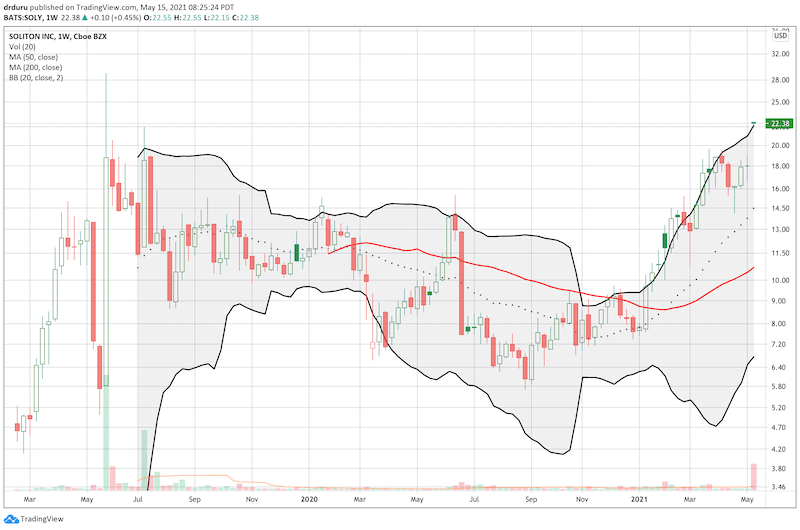
Soliton (SOLY)
The week started with great news for Soliton (SOLY). This company’s technology for tattoo removal and cellulite reduction caught the attention of Abbvie (ABBV). The company bought Soliton for $22.60. I wrote frequently about trading and investing in this company, so the acquisition validated the time and attention I spent studying the opportunity. Note that SOLY did not quite reach the double by year-end that I projected back in February. I closed out my (remaining) position on Monday.
Be careful out there!
Footnotes
“Above the 40” (AT40) uses the percentage of stocks trading above their respective 40-day moving averages (DMAs) to measure breadth in he stock market. Breadth indicates the distribution of participation in a rally or sell-off. As a result, AT40 can identify extremes in market sentiment that are likely to reverse. Above the 40 is my alternative name for “T2108” which was created by Worden. Learn more about T2108 on my T2108 Resource Page. AT200, or T2107, measures the percentage of stocks trading above their respective 200DMAs.
Active AT40 (T2108) periods: Day #131 over 20%, Day #115 above 30%, Day #2 over 40%, Day #1 over 50% (overperiod), Day #25 under 60% (underperiod), Day #44 under 70%


Black line: AT40 (T2108) (% measured on the right)
Red line: Overbought threshold (70%); Blue line: Oversold threshold (20%). Source: FreestockCharts
Source for charts unless otherwise noted: TradingView.com
Grammar checked by Grammar Coach from Thesaurus.com
Full disclosure: long UVXY calls, long SPY puts, long NTNX, long HOG calls, long GOOG call spread
FOLLOW Dr. Duru’s commentary on financial markets via StockTwits, Twitter, and even Instagram!
*Charting notes: Stock prices are not adjusted for dividends. Candlestick charts use hollow bodies: open candles indicate a close higher than the open, filled candles indicate an open higher than the close.