
Stock Market Commentary
A week ago, the stock market stretched into an extended overbought rally. The stock market proceeded to relax from that stretch. Yet, the breadth indicators barely budged and allowed the overbought rally to reach a key overbought threshold and test of the extended overbought rally. The overbought period reached 20 days in duration. Going forward, the odds become high for the overbought period to deliver gains whenever it finally ends.
The Stock Market Indices
In my last Above the 40 post, I noted how the S&P 500 (SPY) sprinted to the top of its upper Bollinger Band (BB). The index peeled itself away from that boundary and slipped to a “light” test of uptrending support at the 20-day moving average (DMA).
The NASDAQ (COMPQX) suffered a sharper pullback from its upper-BB. The flurry of selling happened all in one 1.9% down day. The tech-laden index churned from there and never touched its 20DMA support.
Stock Market Volatility
The volatility index (VIX) came back to life. The 20 level turned out to be firm support after all. The VIX increased three straight days even as the major indices stabilized the last two days. Faders took the VIX off its 25 intraday high so the surge in volatility may already be close to an end.
The Short-Term Trading Call: Key Overbought Threshold

- AT40 = 77.5% of stocks are trading above their respective 40-day moving averages (Day #20 overbought)
- AT200 = 77.5% of stocks are trading above their respective 200-day moving averages according to the Worden TC2000 measure. Going forward, I will be using TradingView’s calculation. See below.
- Short-term Trading Call: neutral
After two straight weeks closing 79.6%, AT40 (T2108), the percentage of stocks trading above their respective 40DMAs, pulled back ever so slightly to 77.5% to close last week. The resilience of my favorite technical indicator betrayed what seemed like “heavy” trading action in the major indices. As a result, last week’s mild pullback is buyable for nimble traders with stops below the intraday low.
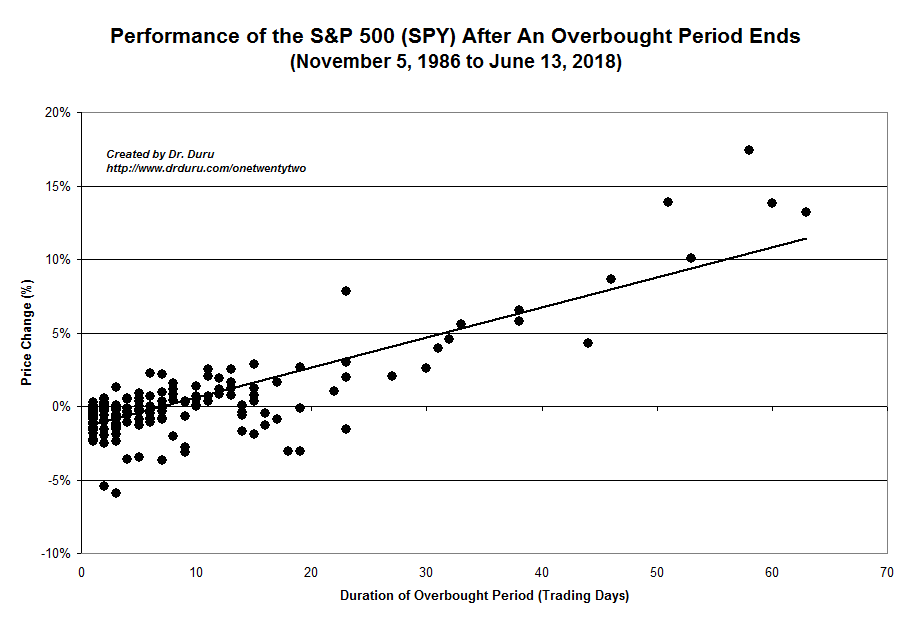
The stock market is on day #20 of overbought conditions. The index has 2.2% in gains since overbought trading resumed on November 13th. Last week’s small pullback reversed a third of the 3.2% in overbought gains the S&P 500 enjoyed previously.
The historical chart below shows that 2.2% is right around the expected gains for the S&P 500 if the overbought period ended on the 20th day. This 20th day is a key overbought threshold given the negative scenarios quickly disappear going forward. If Monday does not bring the overbought period to an end, then this rally goes into a bullish extended rally mode.
Stock Chart Reviews – Below the 50DMA
Best Buy (BBY)
The post-earnings selling pressure continues in Best Buy (BBY). I bought and sold puts for part of this pullback. The pause in selling on Tuesday convinced me to bail, and I did not try to fade BBY again. Now, the electronics retailers looks headed for a test of 200DMA support.
Lowe’s Companies (LOW)
Home improvement retailer Lowe’s Companies (LOW) rebounded quickly from last month’s post-earnings gap down. LOW never traded lower than that first post-earnings day. After some churn below 20DMA resistance, LOW gapped up 5.9% to complete the reversal of the post-earnings loss. Amazing how three weeks can completely change sentiment: LOW announced a $15B stock buyback program, reiterated its outlook for Q4, and delivered upside to its guidance for fiscal year 2020.
Splunk (SPLK)
Thanks to a 23.3% post-earnings loss, Splunk (SPLK) trades at levels last seen in mid-May. I am trading in and out of SPLK to make sure I have something in play if (when?) the stock rebounds. In this market, so many of these quality companies eventually attract fresh buying interest even after post-earnings disasters.
Stock Chart Reviews – Above the 50DMA
Autozone (AZO)
Autozone (AZO) lost 5.3% post-earnings and broke its 200DMA support. I was ready to declare AZO a bearish stock, but buyers returned the very next day. AZO ended the week with a complete reversal of the post-earnings loss. A 7-month trading range remains intact for now.
EXP World Holdings Inc (EXPI)
Somehow EXP World Holdings Inc (EXPI) escaped my radar of housing-related stocks. EXPI provides “cloud-based real estate brokerage services for residential homeowners and homebuyers.” Last week, EXPI broke out to a fresh all-time high. Just a month ago, EXPI lost 12.5% after reporting earnings. That 50DMA breakdown turned out to be a buying opportunity.
Intel (INTC)
Intel (INTC) started the month with a 50DMA breakout. That move was part of an incredible 8 straight days of closing above the upper Bollinger Band. Last week, INTC finally cooled off. With the 50DMA looking like support, I am positioned to make one more between earnings trade in call options on INTC.
Harley-Davidson (HOG)
I was riding high when Harley-Davidson (HOG) jumped 7.0% and then 4.2% to hit a fresh 2-year high. The stock cooled off from there and even closed last week below the uptrending 20DMA. The 2.7% loss almost completed a full reversal of that last breakout. A further slide will force me to close my position to preserve my remaining profits from the 200DMA breakout trade.
Martin Marietta Materials (MLM)
Ever since a downgrade forced me to take profits in Martin Marietta Materials (MLM), I have kept a close eye on the stock for a new buying opportunity. MLM has proven itself resilient. The stock jumped 6.5% after reporting earnings at the end of October. The stock has failed to make much progress since then and closed the week right above 50DMA support. I am back in if MLM survives this test.
LiveRamp Holdings (RAMP)
Continuing on the theme of post-earnings recoveries, LiveRamp Holdings (RAMP) has one of the most impressive rebounds of the bunch. RAMP tumbled 22.3% post-earnings from an all-time high. The selling did not stop until the stock confirmed a 50DMA breakdown. Since that point, RAMP is up 26.7%. I should have bought the fresh 50DMA breakout. Now I am just looking to buy the next dip.
Virgin Galactic Holdings Inc (SPCE)
I jumped back into Virgin Galactic Holdings Inc (SPCE) a month ago. I took profits after SPCE hit my target at the July high. That presumed resistance level did not slow down the stock one bit. SPCE is up another 23%+ since then!
U.S. Steel (X)
Some steelmakers have become major wins among the industrial plays. U.S. Steel (X) is up 116% since its 200DMA breakout. A post-earnings buy would have worked too. Since X soared 23% on November 23rd, I have waited for a dip to buy. I am still waiting…
Be careful out there!
Footnotes
“Above the 40” (AT40) uses the percentage of stocks trading above their respective 40-day moving averages (DMAs) to measure breadth in he stock market. Breadth indicates the distribution of participation in a rally or sell-off. As a result, AT40 can identify extremes in market sentiment that are likely to reverse. Above the 40 is my alternative name for “T2108” which was created by Worden. Learn more about T2108 on my T2108 Resource Page. AT200, or T2107, measures the percentage of stocks trading above their respective 200DMAs.
Active AT40 (T2108) periods: Day #43 over 20%, Day #27 above 30%, Day #26 over 40%, Day #25 over 50%, Day #24 over 60%, Day #20 over 70%


Red line: Overbought threshold (70%); Blue line: Oversold threshold (20%). Source: FreestockCharts
Source for charts unless otherwise noted: TradingView.com
Full disclosure: long UVXY, long HOG
FOLLOW Dr. Duru’s commentary on financial markets via StockTwits, Twitter, and even Instagram!
*Charting notes: FreeStockCharts stock prices are not adjusted for dividends. TradingView.com charts for currencies use Tokyo time as the start of the forex trading day.