
Stock Market Statistics
- AT40 = 59.0% of stocks are trading above their respective 40-day moving averages (DMAs)
- AT200 = 55.6% of stocks are trading above their respective 200DMAs (8-month high)
- VIX = 27.6
- Short-term Trading Call: cautiously bullish
Stock Market Commentary
The stock market cooling continued all of last week. After a sharp one-day pullback on Monday, the major indices churned their way into the end of the week. Sellers and buyers fought their way into a stalemate as earnings season picked up pace. A closer look shows signs of a stock market warming up.
The Stock Market Indices
The week-ending churn for the S&P 500 (SPY) produced a hold on support at the 20 and 50-day moving averages (DMAs). The S&P 500 looks like it is warming up for a fresh upward push.
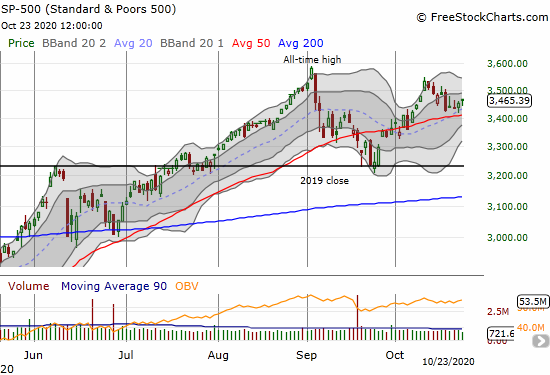
The NASDAQ (COMPQX) still looks quite similar to the S&P 500. The tech-laden index also held up 20 and 50DMA support. A stock market warming up looks like it will include tech stocks.

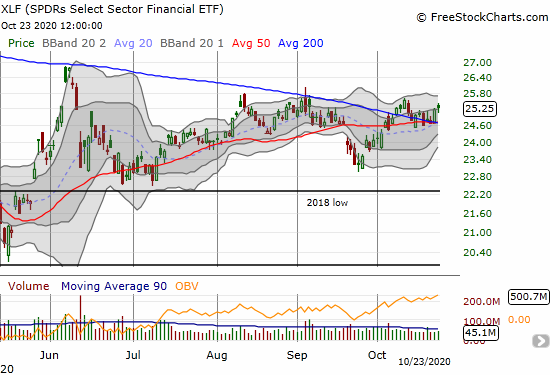
The SPDRs Select Sector Financial (XLF) provided a new piece to the puzzle for the bullish case with an earlier 200DMA breakout. The index of financials proceeded to slide into a retest of 50/200DMA support. Now, XLF is giving another run on the bullish case with a bounce away from support.
Stock Market Volatility
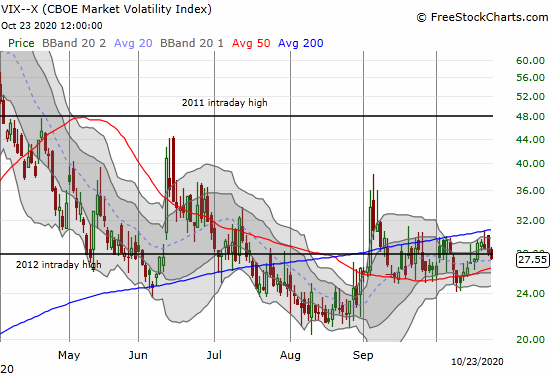
The volatility index (VIX) continues to flounder with no direction. The intraday high from 2012 has suddenly become an important pivot line.
The Short-Term Trading Call
AT40 (T2108), the percentage of stocks trading above their respective 40DMAs, dipped as low as 49% last week in the wake of Monday’s selling. My favorite technical indicator hung out in the 50%s for most of the week and kept me holding on to my cautiously bullish short-term trading call. More importantly, AT200 (T2107), the percentage of stocks trading above their respective 200DMAs, finished the week at a new 8-month high. In other words, behind the scenes of last week’s extended cooling, a few more beaten up stocks conquered a major moving average. Add more points to the bullish side of the ledger.
Stock Chart Reviews – Video Summary
Stock Chart Reviews – Below the 50DMA
ADT Inc (ADT)
ADT Inc (ADT) is in an extremely competitive industry for providing home security services. So when ADT announced a partnership with Alphabet (GOOG) on August 3rd, the company seemed to get a major lifeline. The major fade from a 99.9% gain to a 56.6% gain on the day was a major warning. Earnings two days later delivered a fresh dose of reality. As a result, ADT has not been the same since. ADT finished reversing the gap up last month and now struggles to hold on to 200DMA support.

Intel (INTC)
Once again, Intel (INTC) delivered a post-earnings disappointment. The drop back to July’s post-earnings lows provides a fresh opportunity to load up on between earnings call options. INTC is currently over-extended well below its lower-Bollinger Band (BB), so I might try the trade as early as this coming week.

U.S. Xpress Enterprises Inc (USX)
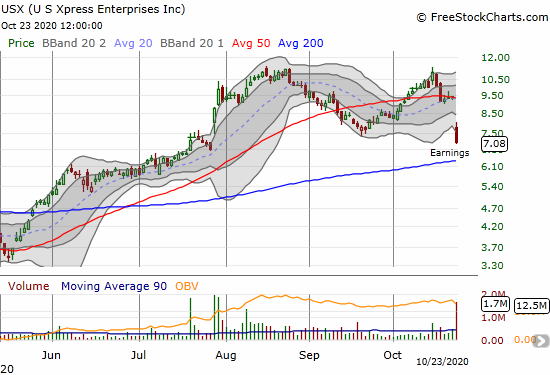
Transports have been a part of the bullish story in industrial plays. Trucking company U.S. Express Enterprises (USX) apparently disappointed expectations bigtime. However, the quote below from the earnings report suggests the future remains bright. I am watching to see what happens with a test of 200DMA support.
“The Company’s baseline assumptions for the balance of 2020 include a general sequential economic recovery that may be volatile nationally or by region at times, increasing inventory re-stocking, tight trucking capacity, and a relatively benign cost inflation outside of driver-related and insurance premium expenses. These conditions are expected to continue to support spot market rates in excess of contract rates and a strengthening contract renewal environment over the next several quarters. Based on these assumptions, the Company expects its internal initiatives around digitization and cost management, combined with continued strength in Dedicated, to have U.S. Xpress well positioned to continue improving its margins through 2021.”
Stock Chart Reviews – Above the 50DMA
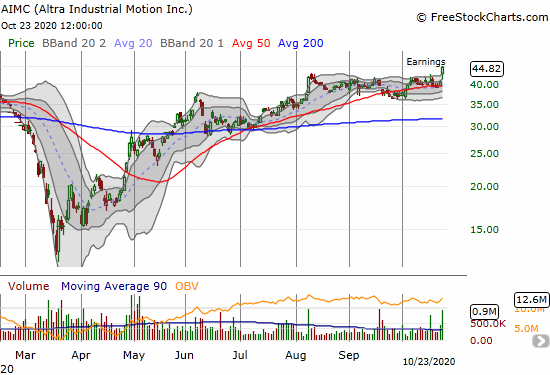
Altra Industrial Motion (AIMC)
Altra Industrial Motion (AIMC) caught my attention after a positive post-earnings response sent the stock to a 2-year high. This move represents a bullish breakout. The company makes electromechanical power transmission motion control products for manufacturing and non-manufacturing processes and falls right into my radar scanning for solid plays on the industrial economy. I plan to start accumulating shares as early as the coming week.
Snap Inc. (SNAP)
I gave up on Snap Inc. (SNAP) a long time ago. As a result, I was reluctant to get back on-board. If I simply bought into September’s 50DMa breakout and counter-market rally, I would have participated in last week’s astounding price appreciation. SNAP soared to a 28.3% post-earnings gain, and the momentum remains on-going. The stock closed the week with another 10.9% gain and fresh all-time high.

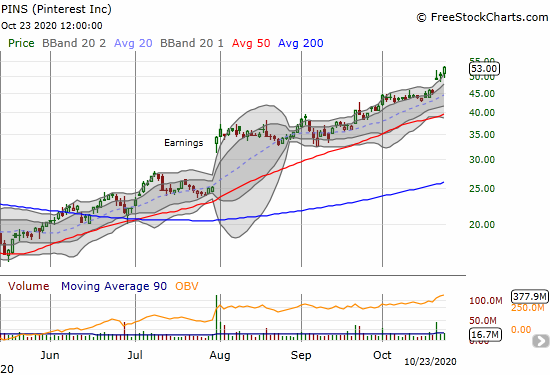
Pinterest (PINS)
SNAP’s results reverberated through many internet and social media related stocks. For example, Pinterest (PINS) rode the coattails with a 9.0% gain. Buyers are still buying.
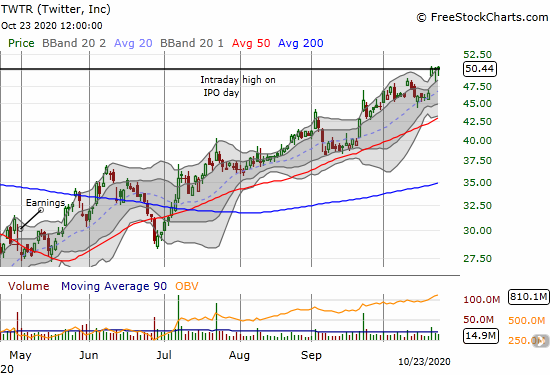
Twitter (TWTR)
Even Twitter (TWTR) caught a fresh tailwind thanks to SNAP. TWTR jumped to an 8.4% gain that finally took the stock back to its intraday high from the day of its IPO. Buyers are still trying to push through that line of resistance. I have been a long-time fan of Twitter the company and the stock. This latest push higher caught me flatfooted without a fresh trading position. I will now wait for the outcome of the next earnings report.
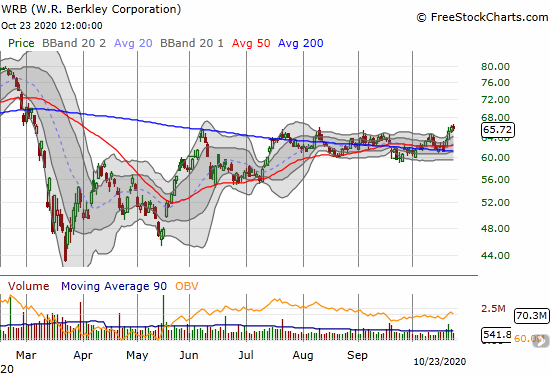
W.R. Berkley Corporation (WRB)
Commercial insurer W.R. Berkley Corporation (WRB) is one of several financials breaking out. The stock caught my attention after post-earnings momentum took the stock to an 8-month high. I plan to start accumulating here.
— – —
FOLLOW Dr. Duru’s commentary on financial markets via email, StockTwits, Twitter, and even Instagram!
“Above the 40” uses the percentage of stocks trading above their respective 40-day moving averages (DMAs) to assess the technical health of the stock market and to identify extremes in market sentiment that are likely to reverse. Abbreviated as AT40, Above the 40 is an alternative label for “T2108” which was created by Worden. Learn more about T2108 on my T2108 Resource Page. AT200, or T2107, measures the percentage of stocks trading above their respective 200DMAs.
Active AT40 (T2108) periods: Day #20 over 20%, Day #19 over 30%, Day #16 over 40%, Day #2 over 50% (overperiod), Day #9 under 60% (underperiod), Day #38 under 70%
Daily AT40 (T2108)
")
Black line: AT40 (T2108) (% measured on the right)
Red line: Overbought threshold (70%); Blue line: Oversold threshold (20%)
Weekly AT40 (T2108)

*All charts created using FreeStockCharts unless otherwise stated
The T2108 charts above are my LATEST updates independent of the date of this given AT40 post. For my latest AT40 post click here.
Be careful out there!
Full disclosure: long UVXY
*Charting notes: FreeStockCharts stock prices are not adjusted for dividends. TradingView.com charts for currencies use Tokyo time as the start of the forex trading day. FreeStockCharts currency charts are based on Eastern U.S. time to define the trading day.