
Stock Market Statistics
AT40 = 40.1% of stocks are trading above their respective 40-day moving averages (DMAs) (2-month low)
AT200 = 20.1% of stocks are trading above their respective 200DMAs
VIX = 34.7
Short-term Trading Call: neutral
Stock Market Commentary
After a one-day respite, the damage in the stock market continued. This time, the damage was more visible than the underlying signals I explained in my last Above the 40 post when the “front-lines” were trampled by sellers.
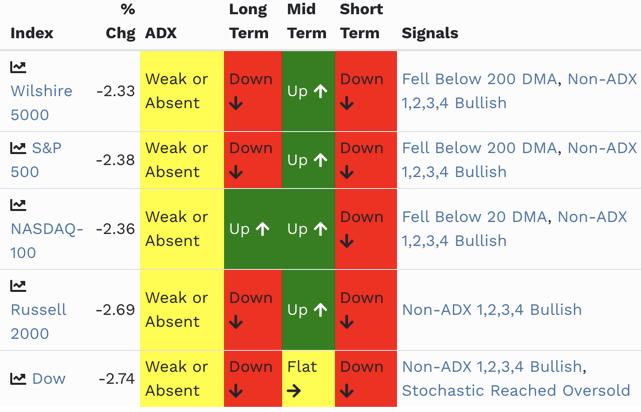
The unusually active technical signals for the day as reported by SwingTradeBot were all bearish. AT40 (T2108), the percentage of stocks trading below their respective 40-day moving averages (DMAs), fell to 40.1% and closed at a fresh 2-month low. This drop warns of an imminent visit to oversold levels or “close enough” in the low 30s. AT200 (T2107), the percentage of stocks trading below their respective 200DMAs, slipped further to 20.1%. This matched the close from the 1-day sell-off on June 11th. These levels remind me how large swaths of the market are still struggling to recover.
The selling this week likely locked in a sustainable top for the S&P 500 around the bottom of the gap down created by the selling on June 11th. Combined with a growing number of states struggling with soaring cases of COVID-19 – Texas and Florida have paused efforts to re-open their economies; California’s governor put several counties on notice for their rising cases – the stock market is effectively on the edge of return to oversold trading conditions.
The Stock Market Indices
The S&P 500 (SPY) broke down below its 200DMA yet stopped short of its closing low from June 11th. The 2.4% loss also brought the index closer to the edge, the ledge even, of an important test of 50DMA support.

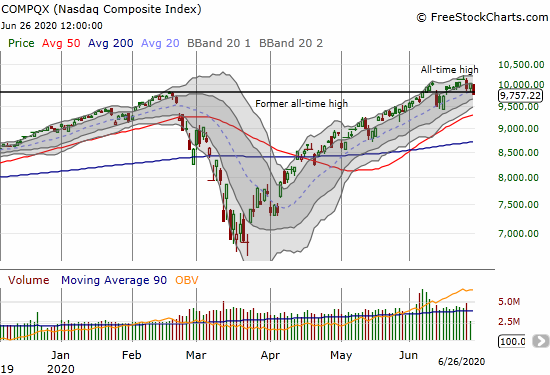
The NASDAQ (COMPQX) dropped 2.6% and closed below important support from the previous all-time high. This loss also confirmed the bearish, evening star topping pattern from Tuesday’s trading.
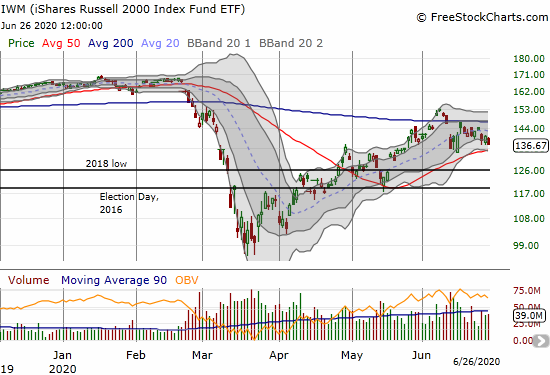
The iShares Russell 2000 Index Fund (IWM) lost 2.7% as it continues an orderly retreat back to its 50DMA support. The “good news” is IWM has yet to break the closing low for June.
Volatility
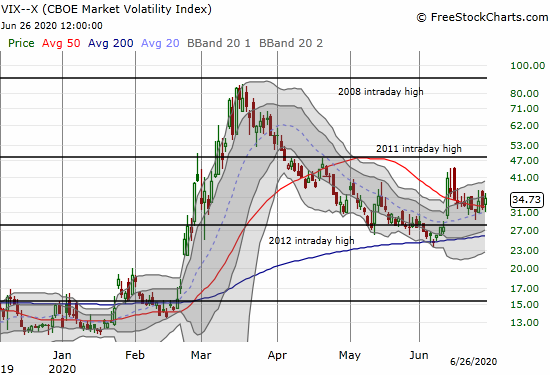
The volatility index (VIX) faded from its intraday high on Wednesday and provided the one small positive sign that preceded the small rebound in the stock market on Thursday. The volatility index came back on Friday with a 7.8% gain. The VIX is extending a consolidation range that looks increasingly and ominously like a launching pad for the next run-up in volatility.
The Short-Term Trading Call
The short-term trading call stays at neutral even as I anticipate more downside for the market. Support is too close for the S&P 500 and AT40 too low for me to be comfortable flipping bearish. I expected AT40 to drop quickly in the next bout of selling below overbought levels (70%), and AT40 is now within range of oversold trading conditions (below 20%). If the S&P 500 closes below its 50DMA, I expect AT40 to drop toward or to oversold at that point. The most compelling buying opportunities will happen in conjunction with the VIX surging higher and/or the NASDAQ surviving a test of its uptrending 50DMA support. I expect upside opportunities to be capped by recent highs.
Stock Chart Reviews: A Video Summary
Stock Chart Reviews – Below the 50DMA
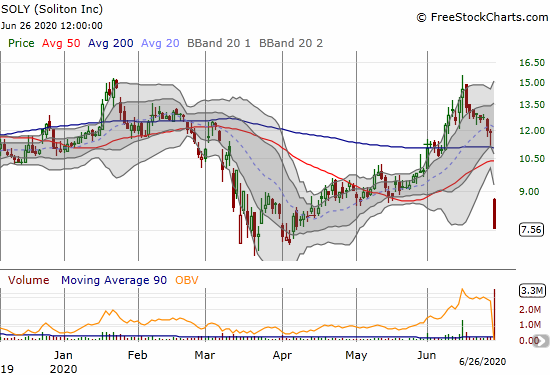
Soliton (SOLY)
Soliton (SOLY) priced a stock offering at $8.30 that will raise a gross $35M. This amount was five times greater than the ballpark amount I guesstimated, and the offering price was well below what I could have expected. I can only assume the company discovered a lack of demand for shares at the lofty levels created by the anticipation of the results from its cellulite trial. Yet, sellers were still not satisfied. SOLY closed at $7.56, well below the offering price.
Soliton created a massive dilution event. At the current stock price, the company is trying to raise the equivalent of 27% of its market cap of $128M. To put that in perspective, this offering is the equivalent of Apple asking the stock market for another $414B in cash. I departed from my strategy for trading a secondary stock offering and bought a first tranche of stock at $8.10. Per that post, I gave a case for the $7-9 range as a bottom for SOLY, so it made sense to go ahead and buy some shares below the offering price. I am prepared to buy another tranche close to $7. I am bracing for SOLY to go even lower because the poor close on Friday could (and should) force the company to lower its offering price. The poor close also reveals just how weak demand is for the stock without some fresh catalyst to get traders and investors excited and hopeful all over again.
Alphabet (GOOG)
The stall for Alphabet (GOOG) in the February gap down did not last long. Friday’s 5.7% plunge took GOOG below its 50DMA for the first time since April. I would not even considering buying GOOG until it at least tests its 200DMA. The churn through much of June looks like a thick ceiling for the stock.

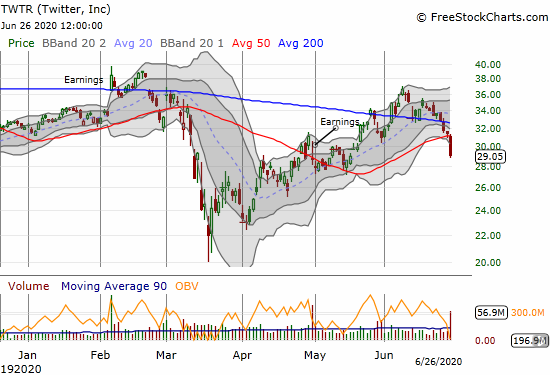
Twitter (TWTR)
While Facebook (FB) has received increased scrutiny and pressure from a growing advertiser boycott, Twitter (TWTR) came under fire again after Unilever included the social media platform with its FB boycott. Next, Coca Cola announced a pause on ALL social media advertising starting July 1st. Sellers arrived in extremely high volume. The 7.4% loss on the day delivered a bearish 50DMA breakdown. I bought call options as a play on a bounce back to 50DMA resistance. I am not hopeful for more from TWTR for the short-term.
Stock Chart Reviews – Above the 50DMA
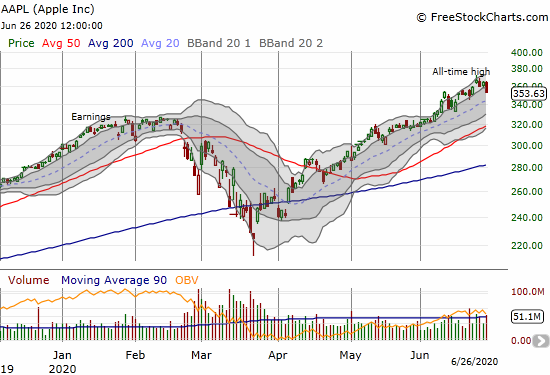
Apple (AAPL)
Apple (AAPL) lost 3.1% and fell from its upper Bollinger Band (BB) trading channel. The uptrend is wavering along with the faltering stock market. I still followed my weekly call strategy, but my expectations are low. I am looking to take profits or losses quickly Monday morning.
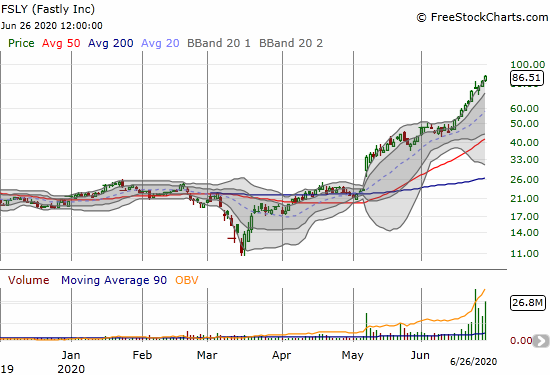
Fastly (FSLY)
Fastly (FSLY) has officially become what I like to call an “infinity stock.” Buyers are unconditionally piling into FSLY. No price is too high with this kind of momentum. I twice hopped into this momentum with successful covered call strategies. FSLY has gone so far and so fast, I do not dare jump in again until some kind of cool-off happens to create the next stable base. I am amazed at the turn in sentiment in FSLY.
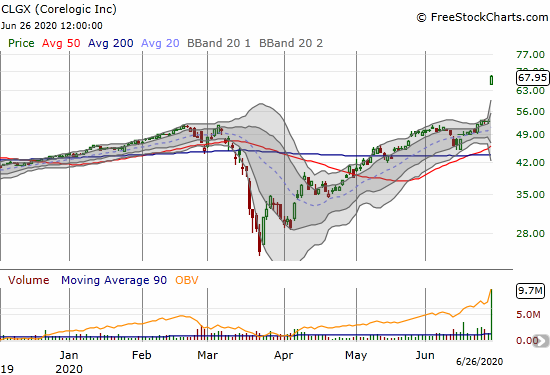
Corelogic (CLGX)
Corelogic (CLGX) received an unsolicited take-out offer that is a strong signal for the market for real estate data and services. The stock closed above the $65 offer in a sign that the market expects CLGX to look for a better offer or hold out for more. Note the offer followed an earnings report from CLGX.
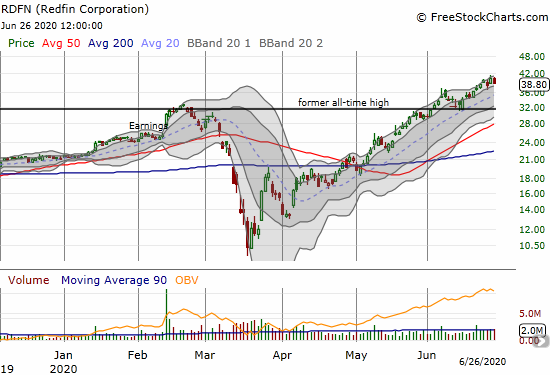
Redfin Corporation (RDFN)
Seeing CLGX makes me further appreciate the near relentless 2-month rally in Redfin (RDFN). I decided not to return to RDFN even when the stock neatly tested support at the former all-time high. The CLGX news makes me incrementally more willing to return to RDFN even at these nosebleed levels. For comparison, CLGX is now valued at 42 trailing P/E, 17 forward P/E, 2.3x sales, and 4.4x book value. RDFN has a valuation of 4.3x sales and 14x book value. With no earnings yet and a business model that includes the risk of buying and selling homes, RDFN is not nearly as attractive as CLGX.
Stock Chart Spotlight – Bullish Breakout
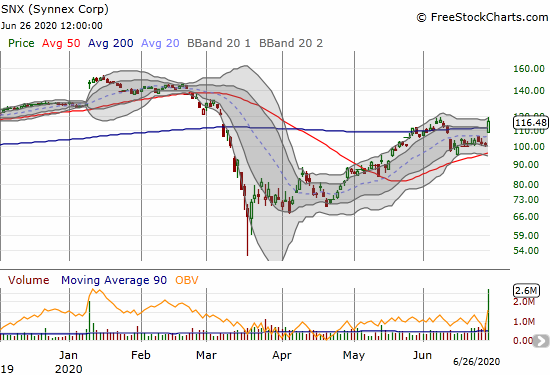
Synnex Corporation (SNX)
Synnex Corporation (SNX), an IT distribution and customer care outsourcing company, gained 14.6% after reporting earnings. The stock broke out above its 200DMA for the second time in a month. SNX closed right at its June high. A higher close will confirm the breakout and presumably provide a stronger bullish case given the positive catalyst.
Synnex is a play on the new digital, remote economy with some room to run. From the Seeking Alpha transcript of the earnings call:
“In our TS Distribution business, we were able to respond quickly to customer demand in Q2, notebooks, cloud and security products, supporting work-at-home, learn-at-home and related activities were strong throughout the quarter. We also saw positive trends in our consumer business as we supported our retail customers, primarily with e-commerce shipments.”
Note Synnex will spin off a part of its business by the end of the year. Synnex describes this segment, called Concentrix, as delivering “..high-value business services and solutions for the customer-relationship lifecycle to more than 650 clients.”
— – —
FOLLOW Dr. Duru’s commentary on financial markets via email, StockTwits, Twitter, and even Instagram!
“Above the 40” uses the percentage of stocks trading above their respective 40-day moving averages (DMAs) to assess the technical health of the stock market and to identify extremes in market sentiment that are likely to reverse. Abbreviated as AT40, Above the 40 is an alternative label for “T2108” which was created by Worden. Learn more about T2108 on my T2108 Resource Page. AT200, or T2107, measures the percentage of stocks trading above their respective 200DMAs.
Active AT40 (T2108) periods: Day #53 over 20%, Day #47 over 30%, Day #45 over 40%, Day #2 under 50% (underperiod), Day #3 under 60%, Day #6 under 70%
Daily AT40 (T2108)
")
Black line: AT40 (T2108) (% measured on the right)
Red line: Overbought threshold (70%); Blue line: Oversold threshold (20%)
Weekly AT40 (T2108)

*All charts created using FreeStockCharts unless otherwise stated
The T2108 charts above are my LATEST updates independent of the date of this given AT40 post. For my latest AT40 post click here.
Be careful out there!
Full disclosure: long TWTR shares and calls, long AAPL calls and calendar call spread, long SOLY
*Charting notes: FreeStockCharts stock prices are not adjusted for dividends. TradingView.com charts for currencies use Tokyo time as the start of the forex trading day. FreeStockCharts currency charts are based on Eastern U.S. time to define the trading day.