
AT40 = 65.3% of stocks are trading above their respective 40-day moving averages (DMAs)
AT200 = 53.0% of stocks are trading above their respective 200DMAs
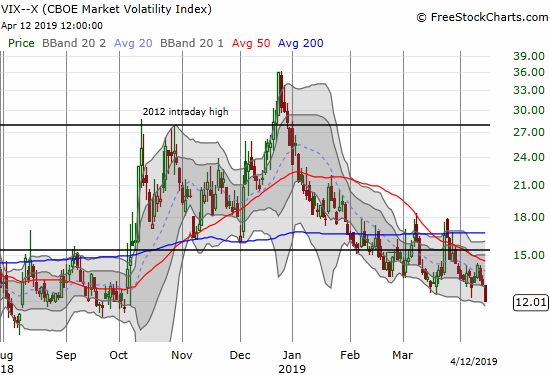
VIX = 12.0
Short-term Trading Call: bearish (caveats below!)
Stock Market Commentary
A security guard slipped and clipped the heels of Tiger Woods at the Masters this weekend. The tripping of Woods was a brief flash of concern as Woods just whisked his way to an historic title. The tripping scene is analogous to the stock market’s rise this year after its biggest push in January. Occasionally something has come along to clip the market’s wings, but it recovered quickly and continued its steady march to victory. In this case, victory comes in the form of reaching the all-time high, a milestone that is now just “inches” away.
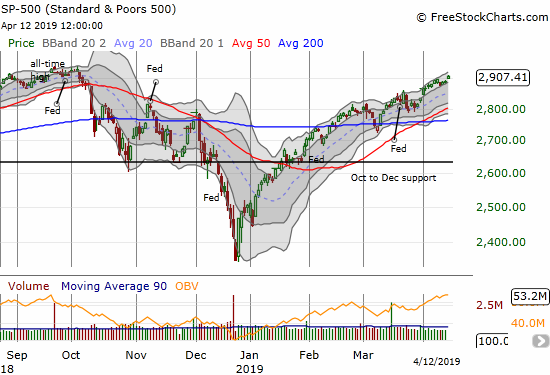
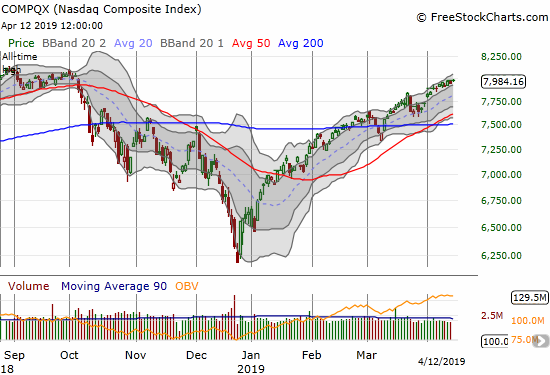
The NASDAQ (NDX) is also tantalizingly crawling toward its all-time high set last August.
Ever since the last overbought period ended, the stock market has experienced just two clear bearish signals. I thought AT40 (T2108), the percentage of stocks trading above their respective 40-day moving averages (DMAs) delivered a third bearish signal last week. The market invalidated that call so quickly I did not even have time to get in trouble with fresh short positions.
AT40 closed the week at 65.3%. It is lagging the S&P 500’s rise but not by enough of a margin for me to stick with a call of bearish divergence. Moreover, AT200 (T2107), the percentage of stocks trading above their respective 200DMAs, closed the week at a new 7-month high. AT200 is well in-sync with the major indices.
In other words, the prospects for a new (extended and bullish) overbought period look very good now. Per my methods, I am waiting for the signal to change my trading call rather than trying to anticipate the change. Of course my increasing attraction to bullish stock setups betrays my reluctance to change stripes.
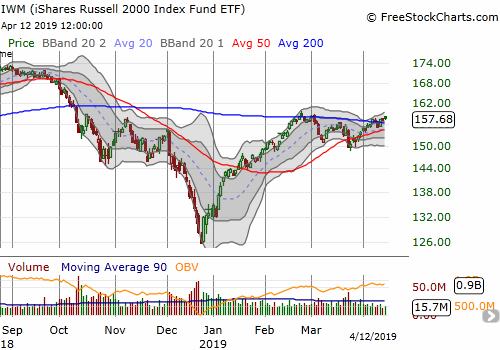
The call options I bought on iShares Russell 2000 ETF (IWM) in case of a quick rebound worked out just as I would have hoped given the circumstances. IWM rebounded right through its 200DMA resistance. I took profits. Needless to say, the confirmed (albeit minor) 200DMA breakout adds to the case for a flip into overbought trading conditions soon (recall that I consider the market overbought after AT40 closes above 70%).
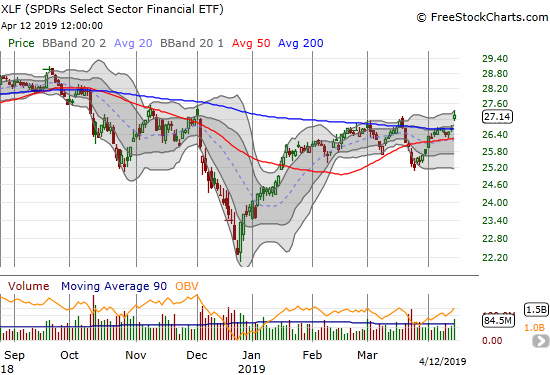
Thanks to earnings from financials, the Financial Select Sector SPDR ETF (XLF) did IWM one better. XLF gapped over 200DMA resistance and closed at a 4-month high. XLF is a buy here and down to a test of 200DMA support. I will be aggressive this week in accumulating XLF call options for May or June expiration as, for now, a hedge on my bearishness.
The volatility index, the VIX, turned an impressive 8.4% gain last Tuesday into a last gasp of strength. The faders returned with vengeance on Wednesday and closed the week with a near implosion. At this rate of decline in the VIX, I need to quickly review my analysis of the bullish implications of an extremely low VIX!
Currency markets also threw their votes in for an imminent breakout for the stock market. See my latest post on the implications of trading in the Australian dollar and Japanese yen; AUD/JPY broke out above its own long-standing 200DMA resistance.

Stock Chart Reviews
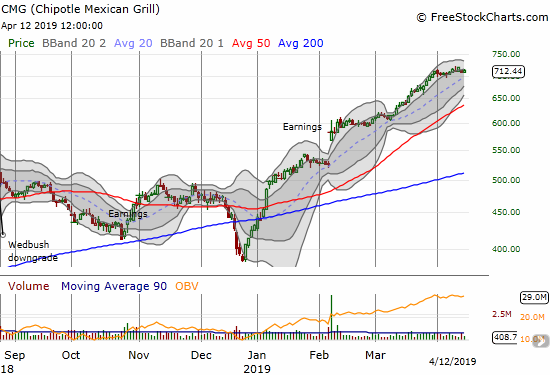
Chipotle Mexican Grill (CMG)
I bought a weekly call spread on Chipotle Mexican Grill (CMG) that I thought was the perfect play for the setup underway. A downgrade on Thursday morning ruined it. I am ready to try again this week as CMG bounced right back on Friday. I am targeting a return to the upper boundary of the upper Bollinger Band.
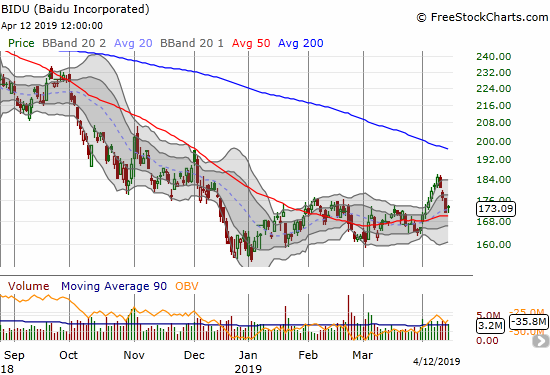
Baidu (BIDU)
I gushed about the Baidu (BIDU) breakout in the last Above the 40 post. The very next day a downgrade sent the stock tumbling. The persistence of the selling surprised me and almost wiped out my call spread position. With Friday’s small bounce, I am ready to double down with a fresh position and bet on 50DMA support holding. I am targeting a run to downtrending 200DMA resistance.
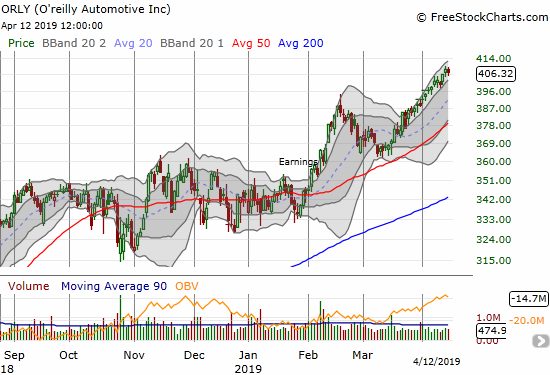
O’reilly Automotive (ORLY)
At the end of February, I worried about my position in O’reilly Automotive (ORLY). I wondered whether I should have taken profits in the previous run-up. I decided to hold. Fortunately, 50DMA support held as well. Now ORLY is back to making regular new all-time highs, and I am back to getting comfortable with ORLY as a long-term hold.
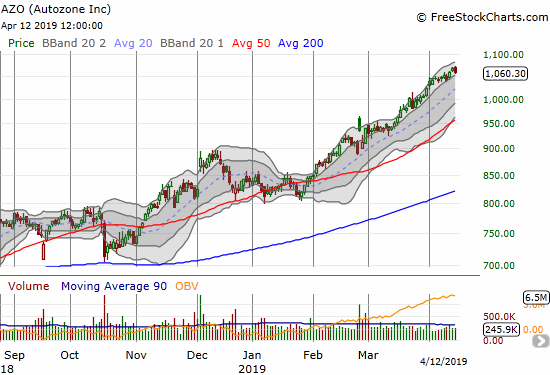
Autozone (AZO)
Autozone (AZO), my true favorite in the auto parts space, has given its investors little to worry about this year. The run-up over the past 2+ months is truly remarkable in its consistency.
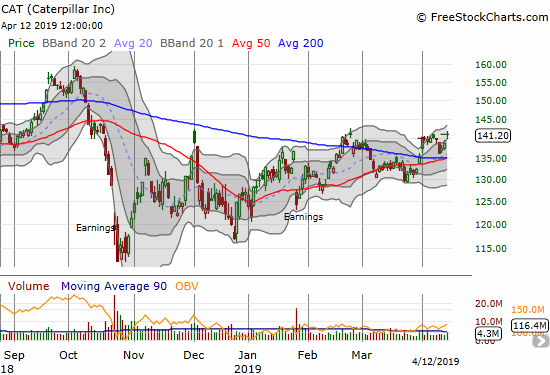
Caterpillar (CAT)
The market gave me no time to take profits on my Caterpillar (CAT) puts. The day after I wrote about my latest trading strategy, the stock rebounded. CAT ended the week right back at the resistance I thought was confirmed. Now it looks ready for an important breakout that could be part of my conversion from bearish to neutral on the stock market.
The Walt Disney Company (DIS)
I have a friend who is an unapologetic permabull on the Walt Disney Company (DIS). At the beginning of last week, he pestered me yet again about all the good news coming for DIS. He was particularly optimistic about the April 11th investor day webcast.
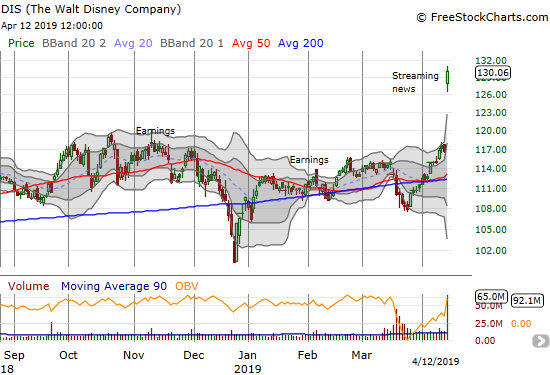
The prior week DIS confirmed a breakout from converged 50 and 200DMA supports, but it looked like it could stay stuck at or around the highs in place since October. Combining my bearishness on the stock market with a natural skepticism about the positive impact of a known news event, I paid deference to my friend’s deep DIS knowledge for a May 3 $116/$120 call spread. I chose $120 as the short side thinking that was the extent of its near-term upside potential. I reasoned that IF the coming news was so good for Disney, it should rally, albeit slowly, into earnings on May 8th, the week after the expiration of my call spread.
The chart below says everything you need to know about this trade, and the market’s reaction to the news about Disney’s streaming plans and other goodies like the Star Wars 9 teaser. The market took me out at my target profit right at Friday’s open. I could only watch the enormous amount of profit I could have had. Friday was an historic, and long overdue, day for Disney. The market has for so long yawned at all of Disney’s amazing accomplishments. Friday’s 11.5% surge was like the release of pent-up respect.
Lyft (LYFT)
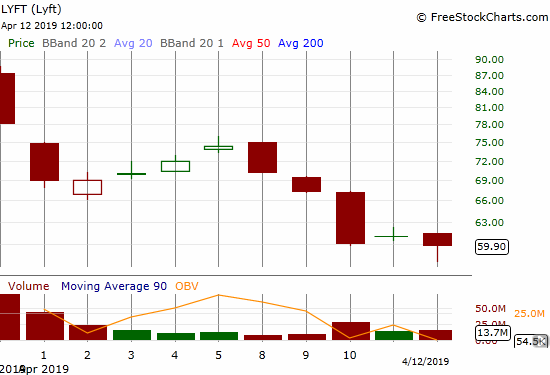
Even when Lyft (LYFT) ended a day of trading with a gain, the buying interest was unconvincing. On Friday, buyers finally showed up at the intraday low and lifted the stock two points. If buyers follow-up from here, this hapless IPO may finally demonstrate a sustainable bottom.
I jumped the gun a bit last week putting on an options trade I learned and liked from CNBC’s Options Action (I had just taken profits on my short position). On Tuesday, I sold an October $55 put and used the proceeds to buy an October $75 call. On Wednesday, I sold an October $50 put and used the proceeds to buy an October $70 call. I got much better pricing on this risk reversal than the Options Action setup, so I have some lingering expectation that I can exit the calls with profits and ride the put options into the October lockup expiration. Regardless, I am looking at holding LYFT as a long-term investment (a requirement for a promising company losing as much money as Lyft does). I am now happy I was not able to get shares at the original IPO price range ($62-68)!
— – —
FOLLOW Dr. Duru’s commentary on financial markets via email, StockTwits, Twitter, and even Instagram!
“Above the 40” uses the percentage of stocks trading above their respective 40-day moving averages (DMAs) to assess the technical health of the stock market and to identify extremes in market sentiment that are likely to reverse. Abbreviated as AT40, Above the 40 is an alternative label for “T2108” which was created by Worden. Learn more about T2108 on my T2108 Resource Page. AT200, or T2107, measures the percentage of stocks trading above their respective 200DMAs.
Active AT40 (T2108) periods: Day #69 over 20%, Day #67 over 30%, Day #66 over 40%, Day #11 over 50%, Day #3 over 60% (overperiod), Day #28 under 70% (underperiod)
Daily AT40 (T2108)
")
Black line: AT40 (T2108) (% measured on the right)
Red line: Overbought threshold (70%); Blue line: Oversold threshold (20%)
Weekly AT40 (T2108)

*All charts created using FreeStockCharts unless otherwise stated
The T2108 charts above are my LATEST updates independent of the date of this given AT40 post. For my latest AT40 post click here.
Related links:
The AT40 (T2108) Resource Page
You can follow real-time T2108 commentary on twitter using the #T2108 or #AT40 hashtags. T2108-related trades and other trades are occasionally posted on twitter using the #120trade hashtag.
Be careful out there!
Full disclosure: long UVXY calls, long BIDU call spread, long CAT puts, long LYFT calls and short LYFT puts, long ORLY
*Charting notes: FreeStockCharts stock prices are not adjusted for dividends. TradingView.com charts for currencies use Tokyo time as the start of the forex trading day. FreeStockCharts currency charts are based on Eastern U.S. time to define the trading day.