
The iShares US Home Construction ETF (ITB) has essentially reversed its entire breakdown that began in October.
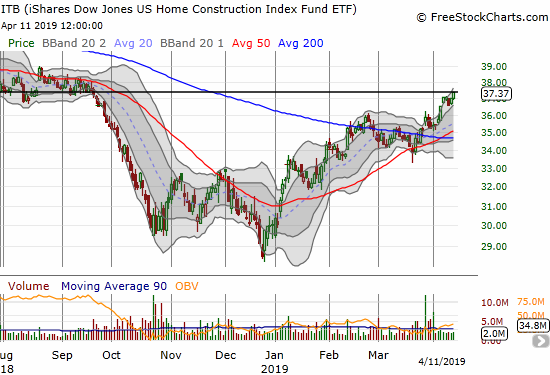
ITB is now up 24.4% for the year and up 30.9% from the December low. These gains outpace the S&P 500’s (SPY) rebound of 15.2% for the year and 22.8% since the December low. This out-performance means that the seasonal trade that favors home builders over the S&P 500 from November to March/April is alive and well (note I remain bearish on the overall market).
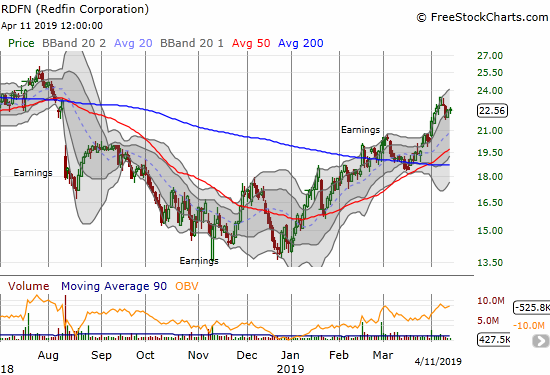
While I closed out my last trade on the seasonality of performance for home builders last week, I am still holding other housing-related positions that I have discussed across various posts. I took profits on one of those positions yesterday: Redfin (RDFN). Recall that RDFN provided the early warning on the breakdown in the housing market. The company also provided an early, albeit tentative, “all clear” signal in February. Needless to say, I now watch this company closely. Still, I decided to take profits because I did not like the way the stock sold off from the latest peak.
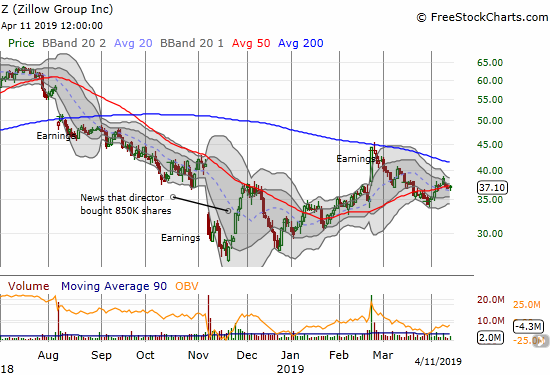
I am still holding Zillow Group (ZG), a RDFN competitor, even after Jim Cramer panned the stock earlier this week. The stock completely reversed a nice post-earnings gain from February, but I decided to ride on the large insider buying in November. The trader in me cringed at allowing those profits to evaporate…
Source for charts: FreeStockCharts
Be careful out there!
Full disclosure: long Z