
AT40 = 55.4% of stocks are trading above their respective 40-day moving averages (DMAs)
AT200 = 56.7% of stocks are trading above their respective 200DMAs
VIX = 12.6
Short-term Trading Call: neutral
Commentary
The recovery from the February swoon has been full of nearly predictable bounces: whether it was oversold trading conditions or support at the 50 and 200-day moving averages (DMAs). Such moves are the hallmarks of a bull market. At some point these bounces will not work. Last week was not that week. The 2800 level has become the latest fashionable support for the S&P 500 (SPY). I used this support level along with an AT40 (T2108) that was trading at recent lows to guess that the market was once again over-stretched to the downside.
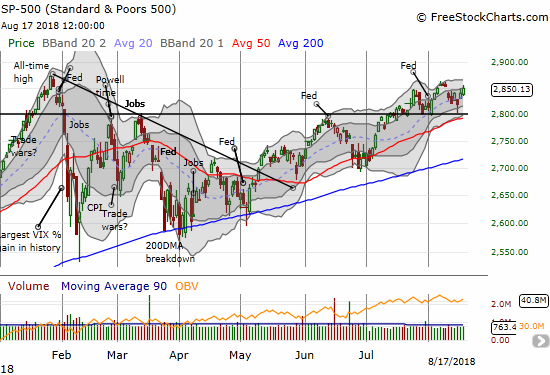
The S&P 500 closed the week strong enough to push into the previous week’s gap down. A fill of that gap will be a very bullish event because it will invalidate a bearish topping pattern as well as push the index to a long overdue new all-time high.
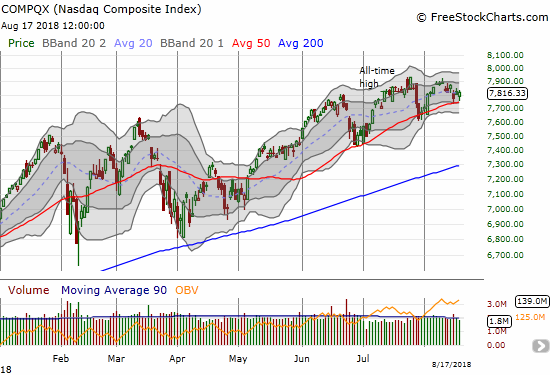
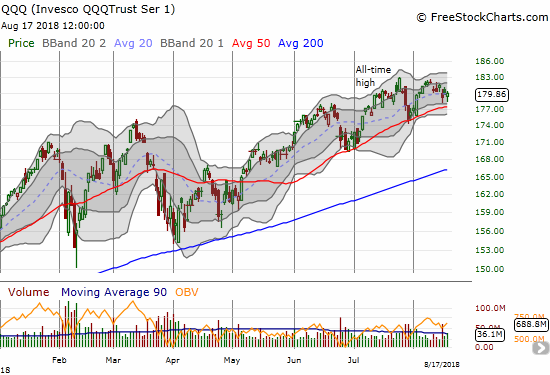
In a rare show of underperformance, the tech-laden NASDAQ and the Invesco QQQ Trust (QQQ) lagged the S&P 500 a bit by finishing the week struggling to stay aloft from their own consistent support levels (50DMAs). In fact, both indices are still in slight downtrends (short-term) from their last peaks.
The volatility index, the VIX, put an exclamation point on the market’s quick return to bullish tones. The VIX fell another 6.0% to 12.6.
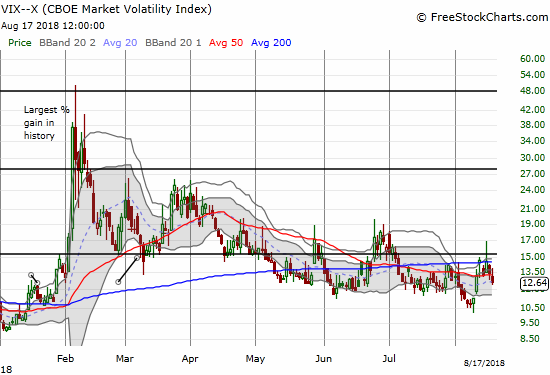
My ProShares Ultra VIX Short-Term Futures (UVXY) put options doubled in value on Thursday, and I quickly took profits. On Friday, I returned to my typical hedging trade by loading up on UVXY call options. These options are now so cheap that I extended my expiration horizon from two to three weeks. This gives me a lot of runway to take a few more risks to the long side in the short-term. I will add S&P 500 put options on the next wave of buying in the index.
CHART REVIEWS
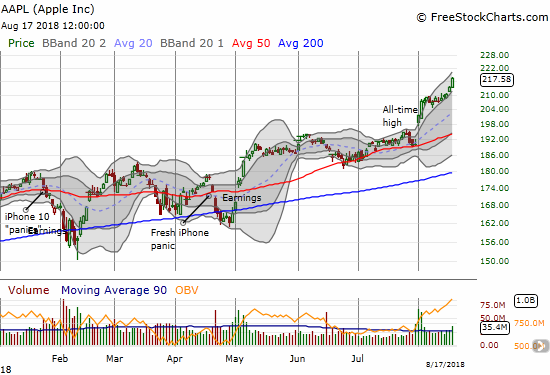
Apple (AAPL)
Remember when the usual suspects in big cap tech out-performed Apple (AAPL) and consistently left it in the dust? Well call this Apple’s revenge. AAPL gained a whopping 2% on a day when the NASDAQ and QQQ were lucky to close flat. This breakout is almost as bullish as they come and represents a smooth continuation move. I find it hard to get bearish on the market when AAPL is performing this well AND AT40 is on the upswing as well.
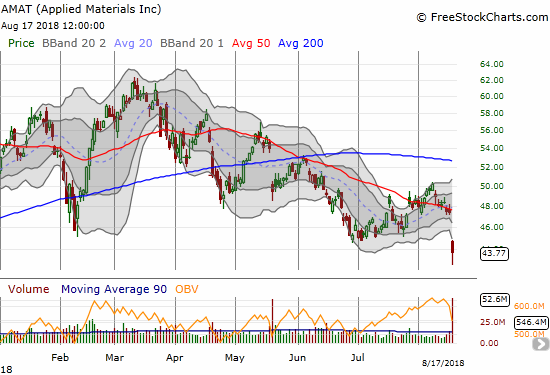
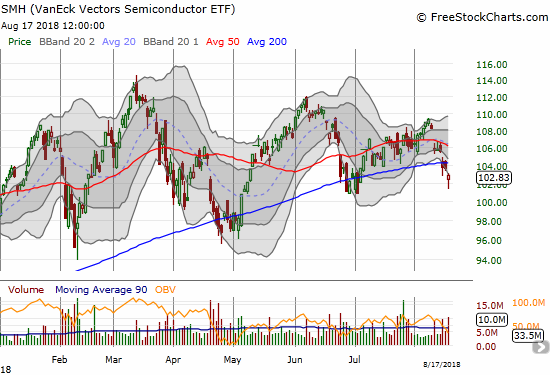
Applied Materials (AMAT) and VanEck Vectors Semiconductor ETF (SMH)
Semiconductors are on my “bear watch” list. AMAT’s post-earnings gap down and 7.7% loss to a near 52-week low confirmed 50DMA resistance and highlighted AMAT’s extended topping pattern. The chart below shows what is essentially the right side of a 10-month head and shoulders pattern.
The VanEck Vectors Semiconductor ETF (SMH) looks better than AMAT only because the ETF has managed to avoid retesting its 2018 lows set in February and May. For now, SMH looks like it is stuck in an extended trading range while AMAT points the way downward.
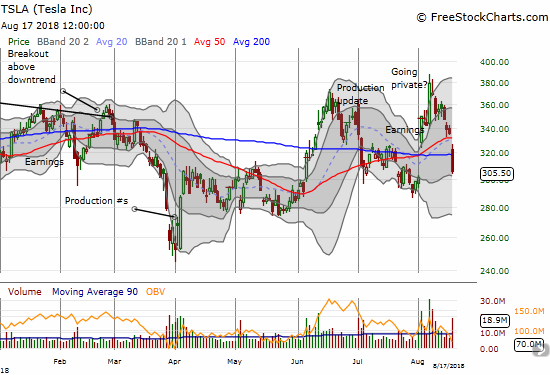
Tesla (TSLA)
Elon Musk allowed the shorts to get into his head and now his empire looks exposed. TSLA looks almost like “$420 or bust.”
In a late earnings season that seemed to feature heavily shorted stocks catching large post-earnings bids, TSLA looked like a storybook winner. TSLA enjoys a float with 29.6% of it sold short. At his last earnings conference call CEO Elon Musk decided to apologize to analysts for his rude behavior during the previous earnings conference call (from Seeking Alpha transcripts):
“I’d like to apologize for being impolite on the prior call. Honestly, I think there’s really no excuse for bad manners and I was violating my own rule in that regard. Certainly, I have some excuse. There are reasons for it in that I’d gotten no sleep and been working sort of 110-hour, 120-hour weeks. But, nonetheless, there’s still no excuse. My apologies for not being polite on the prior call.”
The stock market rewarded him and his stock with a 16.2% post-earnings gain and a 50/200DMA breakout. The momentum stopped cold there until Musk tweeted his desire to take the company private at $420 using the now infamous phrase “funding secured.”
Am considering taking Tesla private at $420. Funding secured.
— Elon Musk (@elonmusk) August 7, 2018
This tweet came just two days after Musk made fun of TSLA shorts with this tweet which includes a YouTube video using what is now a quite popular “voiceover” (with subtitles) of the 2004 World War II film “Downfall” using the scene of Adolf Hitler in his bunker with his military staff…
Dang, turns out even Hitler was shorting Tesla stock … https://t.co/RLM1VQ5O3K
— Elon Musk (@elonmusk) August 5, 2018
The video includes references to squeezing shorts and names big fund managers who have gone public with their bearishness. My guess is that the Securities and Exchange Commission (SEC) has taken due note.
After Musk effectively tagged a (short-term) $420 value on TSLA, the stock quickly gained another 11.0% and a brief brush with its all-time high. TSLA has been mostly downhill from there.
A lot of ink has already spilled over the latest TSLA drama, so I will just conclude here that the NY Times interview with Musk seems to mark a near climax. Musk made explicit what was implicit in his apology to analysts: he portrayed himself as over-worked, stressed out, and fraying at the edges. The timing of this piece was surprising considering Musk knew he and his company are under SEC scrutiny. The piece almost seemed contrived to garner sympathy. Regardless of the intent, the effort backfired as it put Musk’s leadership in question and, more importantly, once and for all confirmed that NO funding was ever secured for Musk’s $420 going private deal. The market greeted Musk’s virtual plea for mercy with another 8.9% in losses that nearly completed a full reversal of TSLA’s post-earnings gains.
NYT's @katekelly, the reporter behind the bombshell @ElonMusk interview, gives background on the story that triggered a $TSLA sell-off. pic.twitter.com/t7VqNFZjO1
— CNBC's Fast Money (@CNBCFastMoney) August 17, 2018
This is a bizarre saga for a stock and CEO that has generally curried a lot of favor and benefit of the doubt from a substantial fan base. Ironically, with a $420 going private billboard, TSLA looks like a lot of free money at this point. I have to assume that the current discount indicates significant doubt in the viability of TSLA going private or at least not for anywhere close to $420. The volatility presents bullish and bearish trading opportunities in a situation that is nearing a $420 or bust scenario.
Last week’s trading defied my imagination, and I found myself racing to keep up with the market’s growing bearishness on TSLA. I ended the week with shares, puts, and calls as I scrambled to figure out a palatable positioning for “$420 or bust.” I am currently biased long under the assumption that a reversal of post-earnings gains may have stretched the firepower of sellers. I will go back to scrambling if TSLA’s losses continue from here in trading this week. Stay tuned!
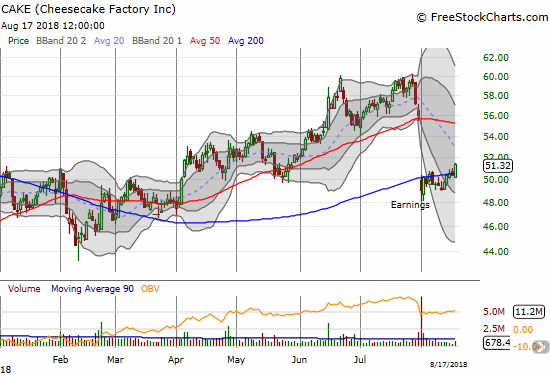
The Cheesecake Factory (CAKE)
A high short interest did not help CAKE after its latest earnings report. With 30% of its float sold short, CAKE imploded post-earnings to a 200DMA breakdown and a 12.4% one-day loss. Fortunately for CAKE, sellers have yet to make progress from that day’s disaster. Now, CAKE is quietly creeping higher in a post-earnings recovery. CAKE closed the week above its 200DMA. This breakout and post-earnings high puts 50DMA resistance in play for a swing trade. Assuming the breakout holds on Monday, I will be looking to position myself for more upside.
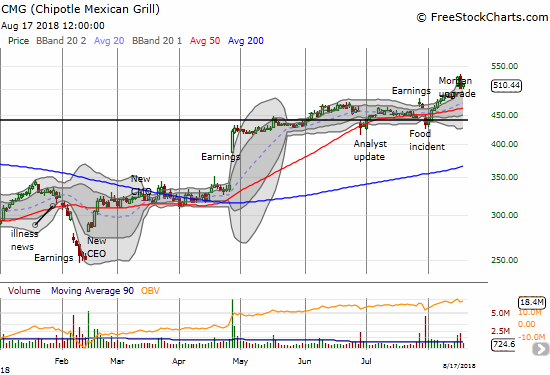
Chipotle Mexican Grill (CMG)
I thought CMG would provide a new entry point to buy into its fresh post-earnings strength. Morgan Stanley had other ideas. An upgrade sent the stock soaring this week to a fresh 2 1/2 year high. While sellers nearly reversed those gains the next day, I held off buying into the dip. The stock seems very stretched up here, so I am in no rush to jump aboard with a new swing trade: I am having trouble envisioning enough upside from here to make the risk of going long worthwhile. I will keep watching for now.
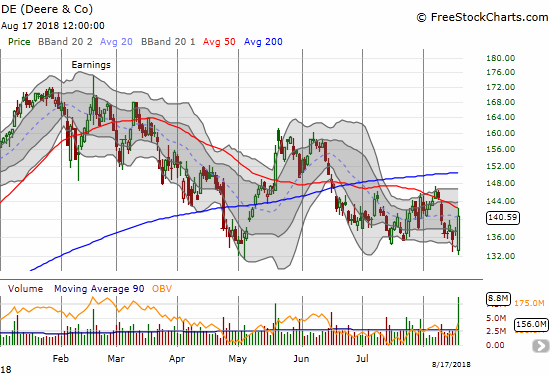
Deere & Co. (DE)
I thought this post would describe how DE’s post-earnings gap down and loss this week confirmed weakness and bearishness in the industrial sector. Instead, I am writing about a potential bottom. Despite guiding down for revenue, DE gained 2.4% on extremely high volume in a move that formed a bullish engulfing pattern. This pattern marks a reversal of prior weakness. While DE faded from 50DMA resistance at its high of the day, I am fine jumping into the stock here with a stop below Friday’s intraday low.
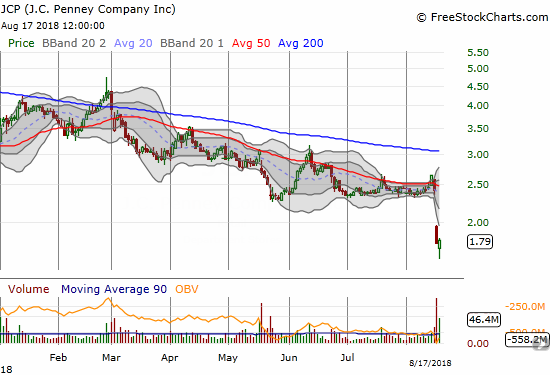
J.C. Penney (JCP)
Fifty-one percent (51%) of JCP’s float is sold short. These persistent bears have been right for a very long time. This week the death knell for JCP came in the form of a 27.0% post-earnings loss that closed the stock at a new all-time low and the notorious “dollar and change” level. While buyers stepped in to defend the intraday low on Friday, JCP still looks like it has officially enrolled in a hospice program. I hope I will be able to jack some decent threads at the bankruptcy clearance sale. It is hard to believe just two years ago I was staring at JCP above $9 and testing 50DMA support as a potential buy.
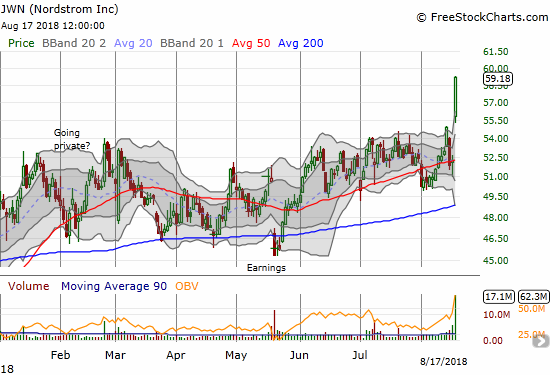
Nordstrom (JWN)
I have stayed bullish on JWN ever since it went through its own going private drama. I would like to say that the stock’s post-earnings surge is a potential lesson for TSLA, but JWN reports profits…and “only” 11.9% of its float is sold short. I just wish I had a position in play to capture JWN’s 13.2% post-earnings pop. I will be waiting and ready for a pullback…
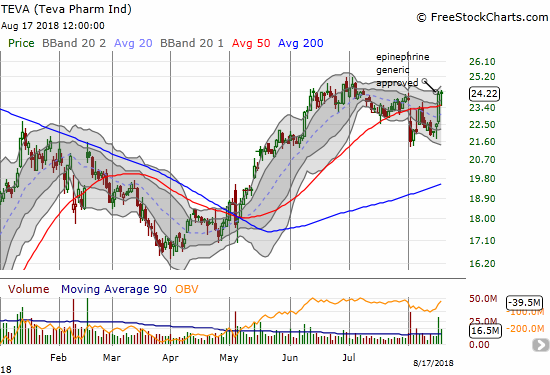
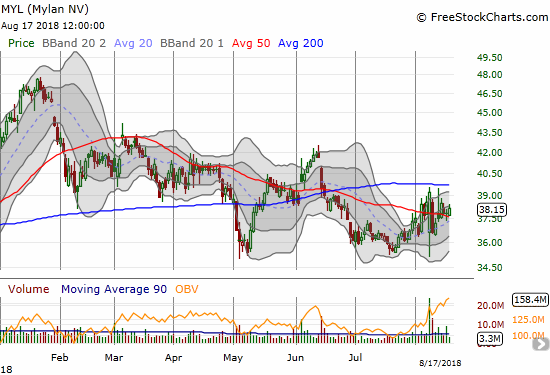
Teva Pharmaceutical Industries (TEVA) and Mylan (MYL)
My stubborn patience with TEVA is paying off in the form of an extended recovery. The latest reward came in the form of an FDA approval for TEVA’s epinephrine generic. The company can now compete head on with Mylan’s EpiPen.
MYL actually gained fractionally despite news of the new competition for its EpiPen. Then again, the EpiPen story is now very old news for MYL; it is no longer a part of the investment or trading story. What is also old news is the bet that management was up to the task of qualifying for a bonus by driving up the stock price by March of this year. Instead, MYL’s January rally was cut short by the February swoon; the stock has yet to recover. MYL is down 9.8% year-to-date.
Overstock.com (OSTK)
OSTK fit the profile of a heavily shorted stock catching a bid post-earnings. On the heels of a float sold 42.8% short, OSTK gained as much as 24.3% before settling for a 7.9% post-earnings gain. However, sellers did not stop with this ugly gap and crap that took the stock all the way back to its upper-BB. The next day all of OSTK’s post-earnings gains disappeared. OSTK ended this week scratching at its 2018 lows. I have OSTK on the radar.

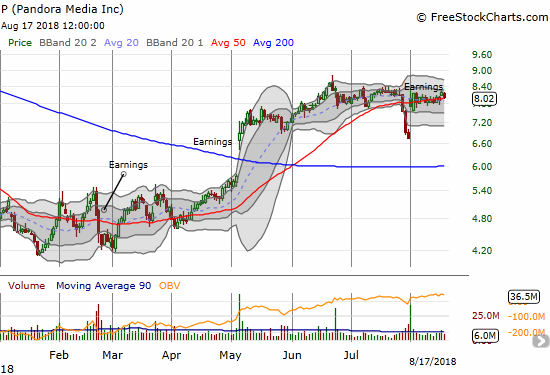
Pandora (P)
A little over two months ago, I started looking for an entry point to jump into Pandora’s breakout. The entry point never came except for a pullback so sharp and abrupt I would not have touched the stock if I had been paying attention. The 3-day 16.7% loss ahead of earnings looked like an ominous warning. Instead, P jumped right back after earnings. With the stock resting on top of its 50DMA, it looks tempting for a buy. There is still the issue of the float which is 24% sold short…
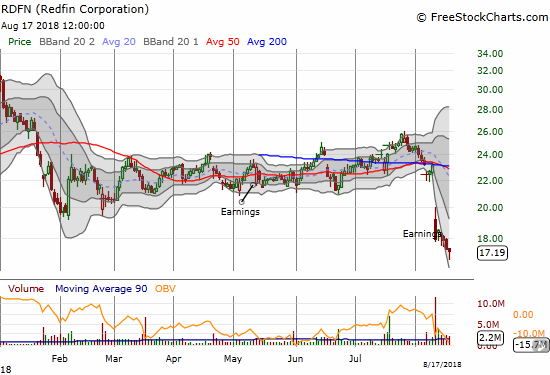
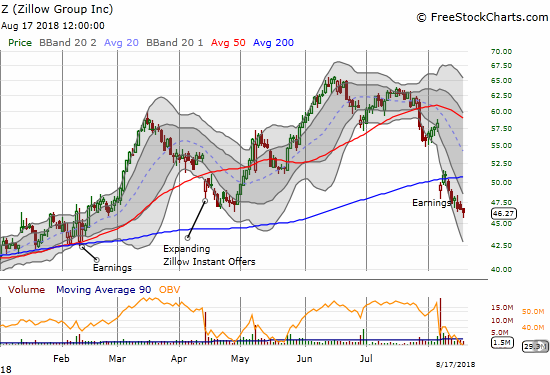
Redfin (RDFN) and Zillow Group (Z)
The post-earnings pain continued for RDFN and Z. I kicked off my pairs trade idea long RDFN and short Z just as buyers finally showed a little sign of life in RDFN. Z is also attempting to print a bottom with a smaller hammer pattern than RDFN’s bottoming attempt. For both stocks, the bottom must be confirmed with follow-up buying and a higher close.
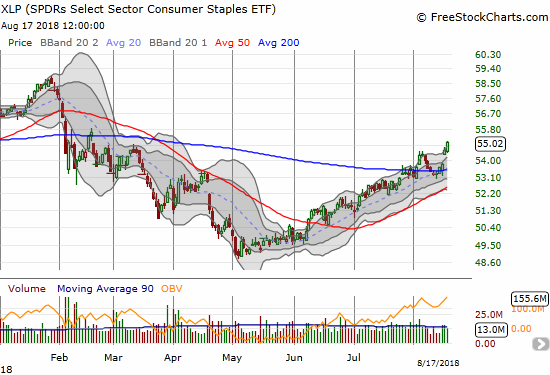
Consumer Staples Select Sector SPDR ETF (XLP)
XLP is pushing ahead and confirming its new bullish momentum. Walmart’s (WMT) post-earnings explosion is the latest positive catalyst for XLP. One of my main plays in the space, Campbell Soup (CPB), is now getting left behind as it stalls out waiting for its next catalyst. Another play, General Mills (GIS), looks like it has formed a base from which to break out and join the XLP momentum. My short in Walgreens Boots Alliance (WBA) is on the edge of its own breakout (gulp!).
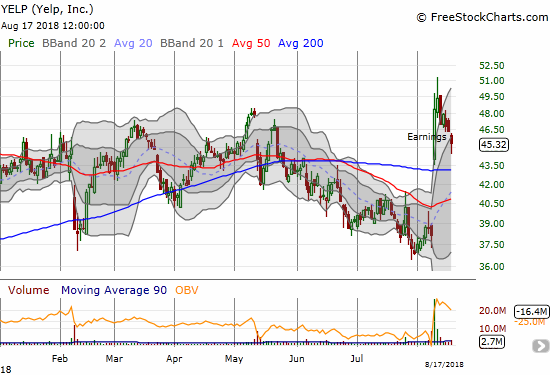
Yelp (YELP)
YELP returned to my radar after a huge post-earnings gap up above 200DMA resistance that ended with a 1-day 26.7% gain. The stock is pulling back and looking like a strong setup for accumulation. I plan to start as soon as YELP closes higher than Friday’s close.
— – —
FOLLOW Dr. Duru’s commentary on financial markets via email, StockTwits, Twitter, and even Instagram!
“Above the 40” uses the percentage of stocks trading above their respective 40-day moving averages (DMAs) to assess the technical health of the stock market and to identify extremes in market sentiment that are likely to reverse. Abbreviated as AT40, Above the 40 is an alternative label for “T2108” which was created by Worden. Learn more about T2108 on my T2108 Resource Page. AT200, or T2107, measures the percentage of stocks trading above their respective 200DMAs.
Active AT40 (T2108) periods: Day #125 over 20%, Day #94 over 30%, Day #89 over 40%, Day #2 over 50% (overperiod), Day #28 under 60% (underperiod), Day #45 under 70%
Daily AT40 (T2108)
")
Black line: AT40 (T2108) (% measured on the right)
Red line: Overbought threshold (70%); Blue line: Oversold threshold (20%)
Weekly AT40 (T2108)

*All charts created using freestockcharts.com unless otherwise stated
The charts above are my LATEST updates independent of the date of this given AT40 post. For my latest AT40 post click here.
Related links:
The AT40 (T2108) Resource Page
You can follow real-time T2108 commentary on twitter using the #T2108 or #AT40 hashtags. T2108-related trades and other trades are occasionally posted on twitter using the #120trade hashtag.
Be careful out there!
Full disclosure: long GIS, short WBA, long CPB call spread, long AAPL calendar call spread; long TSLA shares, calls, and put spread; long TEVA, long UVXY calls, long RDFN calls, long Z puts
*Charting notes: FreeStockCharts.com stock prices are not adjusted for dividends. TradingView.com charts for currencies use Tokyo time as the start of the forex trading day. FreeStockCharts.com currency charts are based on Eastern U.S. time to define the trading day.