
Last year, 2017, featured an incredibly low number of days with big price moves for the S&P 500 (SPY). In particular, there were only eight (8), days when the S&P 500 gained at least 1% or lost 1% or more (for ease of explanation I will call this concept “days with at least 1% changes”). Since 1951, only TWO years delivered fewer such days: 1963 at 7 days and 1964 at 8 days. The only other year in the single digits was 1965 at 9 days. Last year’s low extreme in daily price changes came along with 19.4% gain on the S&P 500. It turns out that extremes in the occurrence of days with at least 1% changes are highly correlated to the S&P 500’s annual performance.
In other words, in years when the S&P 500 experienced few days with price changes of at least 1% in magnitude, the index tended to deliver gains. The three top performing years (1954, 1958, and 1995) each had very low number of days with at least 1% changes. The reverse was also true. In years when the S&P 500 experienced an extremely high number of days with price changes of at least 1% in magnitude, the index tended to deliver losses. The three worst performing years (1974, 2002, and 2008) for the index each had extremely high number of days with at least 1% changes.
The chart below provides a visual of this relationship (data available in Excel). The y-axis shows the S&P 500’s annual performance for a given year. The x-axis normalizes the count of days with at least 1% moves by calculating the percent of trading days in the year that meet the condition. Years can have different numbers of trading days ranging from 226 in 1968 to 254 in 1970, 1992, and 1996. Two colored vertical lines define the low (green) and high (red) extremes. I drew these lines manually starting from the furthest left and right and then moving inward until the S&P 500 was no longer dominated by gains on the lefthand side or by losses on the righthand side. Conveniently, these lines ended up on 10% and 35% of trading days. Arguably, I could have drawn the red line further out at 40%, but I decided the near-zero performances were poor enough for inclusion even as they forced the inclusion of a strong year. In between the green and red lines the S&P 500’s performance is well-distributed across gains and losses. I show the current year’s performance to-date as a slightly larger and orange dot (look right in the middle of the area between the green and red lines).
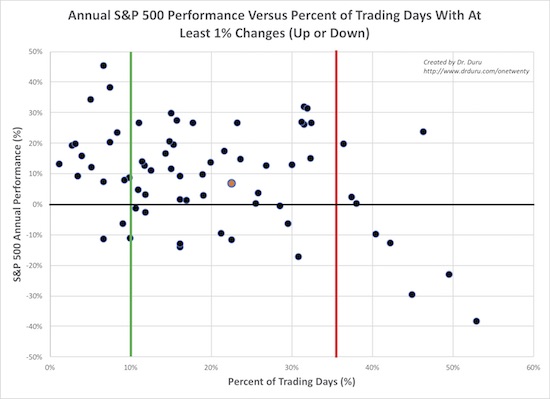
Source of Prices: Yahoo Finance
As is true with so many S&P 500 price studies, the relationship over the full range of time and variables is poor to non-existent. Other conditions are required to uncover interesting relationships. In this case, the interesting regions are at the extremes. I also like to note in these studies the strong skew the S&P 500 has for positively performing years. Since 1951, 50 of 67 (75%) years have delivered gains for investors; so the hurdle is very high to come up interesting drivers of annual S&P 500 performance.
So far, this year is unremarkable. With a little less than 100 trading days left in the year, the S&P 500 would need to produce 1% days for around half of the remaining trading days in the year to drive towards another one of those historically bad years.
Source of Prices: Yahoo Finance
Be careful out there!
Full disclosure: no positions