
AT40 = 62.5% of stocks are trading above their respective 40-day moving averages (DMAs)
AT200 = 52.7% of stocks are trading above their respective 200DMAs (a near 4-month high)
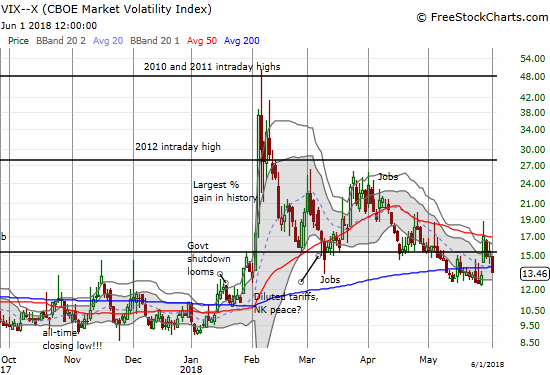
VIX = 13.5 (down 12.8%)
Short-term Trading Call: neutral
Commentary
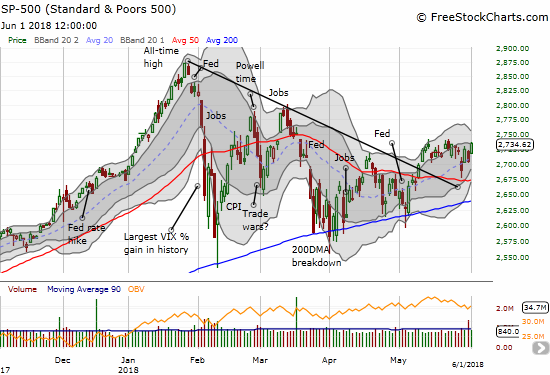
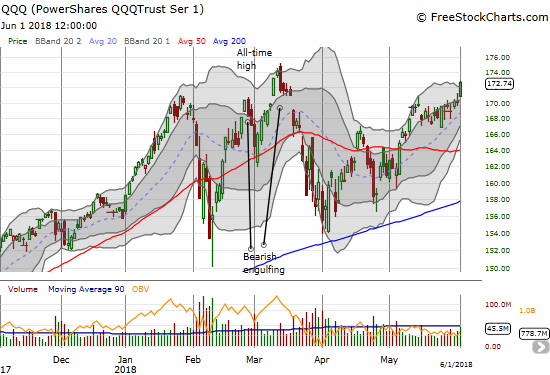
A day like this past Friday makes me want to be bullish about the entire stock market. The volatility index, the VIX, plunged solidly below the 15.35 pivot. The S&P 500 (SPY) regained some momentum with a 1.1% gain. The tech laden indices rallied just short of new all-time highs with the NASDAQ and PowerShares QQQ ETF (QQQ) jumping 1.5% and 1.6% respectively.

The week ended in spectacularly manic fashion compared to the angst that greeted the start of holiday-shortened trading in the U.S.
Still, as has been the case for some time, there are enough caveats preventing me from flipping the short-term trading call to bullish. Rallies in the stock market continue to expose uncomfortable divergences. Most importantly, AT40 (T2108), the percentage of stocks trading above their respective 40-day moving averages (DMAs), barely budged on Friday’s big rally day: AT40 only gained less than 2 percentage points from 60.7%. My favorite technical indicator ended the week at 62.5% which is below where it ended the previous week at 64.0%. AT40 is still struggling to broaden the rally above the overbought threshold (70%). So from my perspective, the rally in the major indices still sits on very tenuous footing.
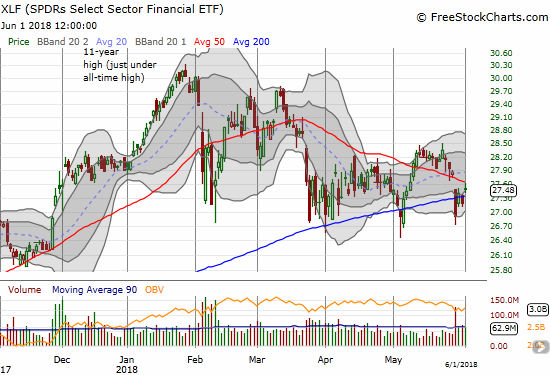
Next, the financials as a whole continue to languish suspiciously. The Financial Select Sector SPDR ETF (XLF) gained 1.1% to barely nudge to a high for the week. However, XLF did not fill Tuesday’s major gap down, and it faded from its downward trending 50DMA.
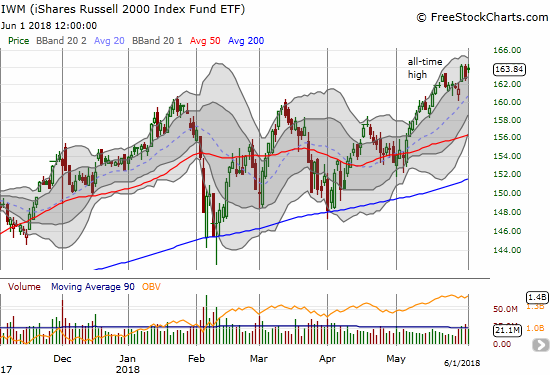
Small caps have been a bright spot with relative out-performance. Yet, the iShares Russell 2000 ETF (IWM) sold off sharply on Thursday’s down day, and the index gained less than 1% on Friday while fading slightly from the all-time high. This trading action is not bearish; it just does little to confirm or support overall market bullishness.
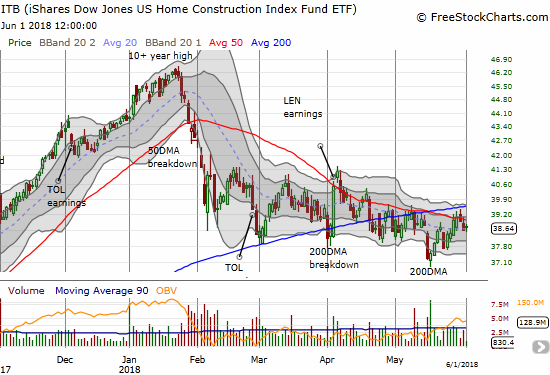
And then there is the iShares US Home Construction ETF (ITB). While the market celebrated another strong U.S. jobs report (with an early hint from President Trump that countered government practices), ITB hesitated. The index at one point traded back to the low of the week and only gained 0.4%. The further ITB falls behind the S&P 500, the more suspicious I get about ITB AND the underlying health of the stock market recovery itself.
This week’s trading was as mixed as the week was mixed. On Friday, I moved in two directions. I hedged with a fresh round of call options on ProShares Ultra VIX Short-Term Futures (UVXY) and repositioned my put on Caterpillar (CAT). See below for additional trades.
CHART REVIEWS
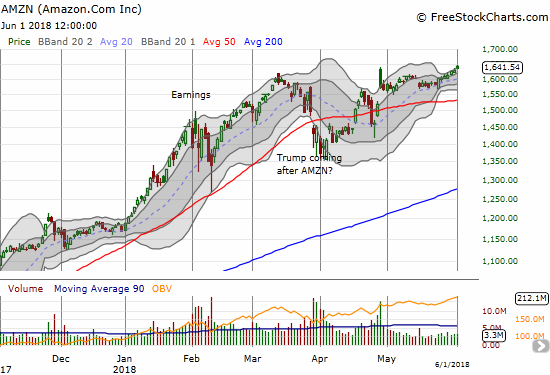
Amazon.com (AMZN)
AMZN is creeping higher again. It ended the week with an all-time high. AMZN is clearly one of the big cap tech-related stocks that continues to soak up a lot of investor’s funds. I am still holding my calendar call spread.
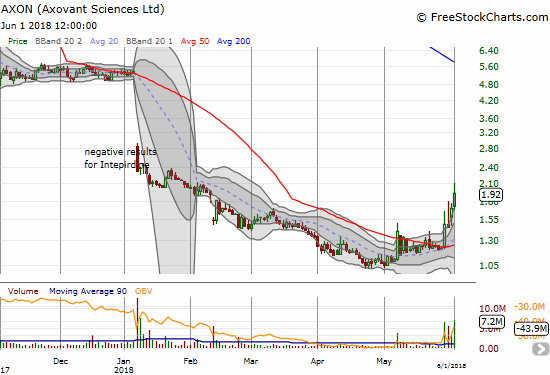
Axovant Sciences Ltd. (AXON)
I must be a glutton for punishment. I am back in AXON as momentum from the lows builds in this stock. I have written optimistically before about AXON only to be disappointed. This time, the stock seems to be benefiting from a major restructuring of the company. This action is like hitting the reset button. The technicals are also encouraging with periodic waves of strong buying volume. This week’s 50DMA breakout even received follow-through buying. The 50DMA breakout itself was a bullish resolution of a multi-week consolidation triangle.
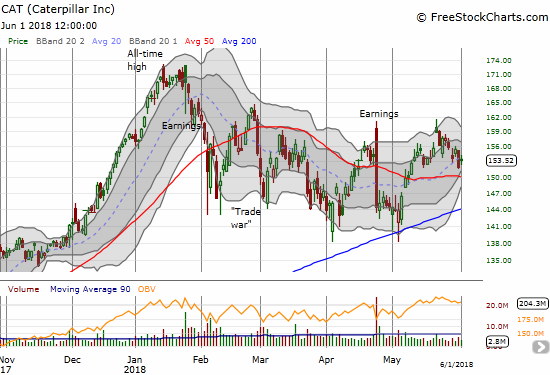
Caterpillar (CAT)
CAT did not benefit from the market’s magical turnaround from the angst and turmoil from Tuesday. The stock ended the week with a loss and barely avoided the lows of the week. With interest waning again, CAT looks like its best bet is to bounce around an extending trading range.
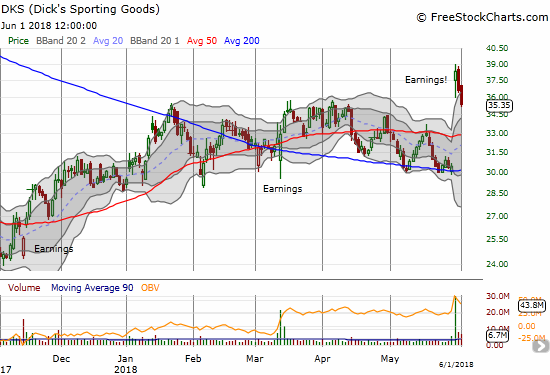
Dick’s Sporting Goods (DKS)
The early post-earnings optimism on DKS is waning fast. DKS is starting to fill its post-earnings gap. Now my rush to salvage my call option looks like a fortuitous move. It also looks like my covered call just might expire worthless after all and allow me to hold onto the stock for another similar trade.
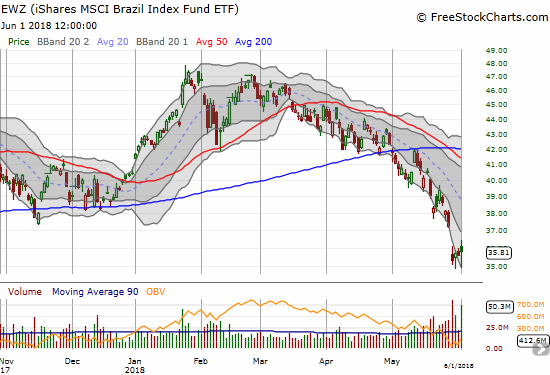
iShares MSCI Brazil Capped ETF (EWZ)
With emerging markets continuing a downward trend from the January top, I started checking in on my favorite play in the space, EWZ. This week’s gap down triggered my “buy on a 20% dip” rule for EWZ. The selling was so bad that EWZ actually reversed at one point on Friday while the U.S. market was rallying. I took that opportunity to nibble on my first tranche of shares at a 25% discount to the last high. EWZ is near a 52-week low and back into the large gap down that occurred when Brazil’s President was accused of bribery a year ago.
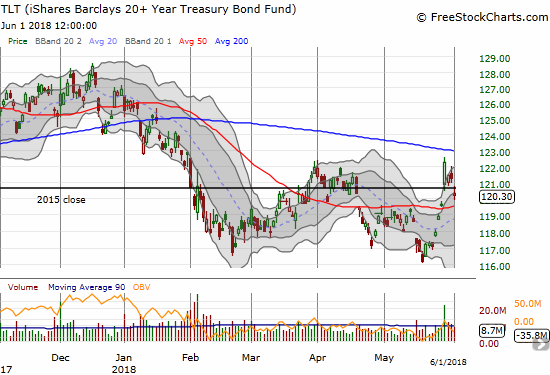
iShares 20+ Year Treasury Bond ETF (TLT)
As expected, interest rates are on the rise again even though I did not expect THIS swift a reversal of Tuesday’s gains. TLT looks like it has topped out again. I am expecting at least a retest of recent lows. I suspect that the next trip for the 10-year U.S. Treasury above 3% will not generate nearly the kind of angst it generated the last two trips…should be interesting!
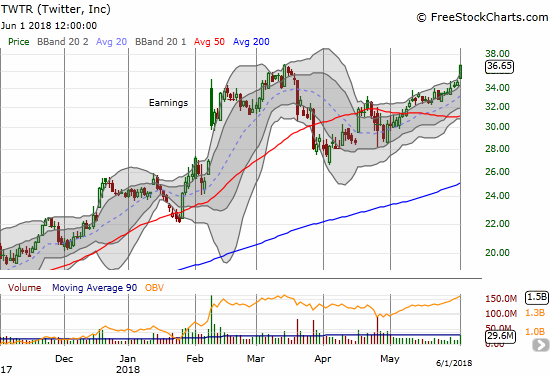
Twitter (TWTR)
I have stayed stubbornly bullish on TWTR even as my trading actions have not matched my convictions. My latest misses were failing to buy once the last post-earnings gap up filled and then failing to buy after (either) 50DMA breakout. So I can only cheer from the sidelines as TWTR punches through for a 2-year high.
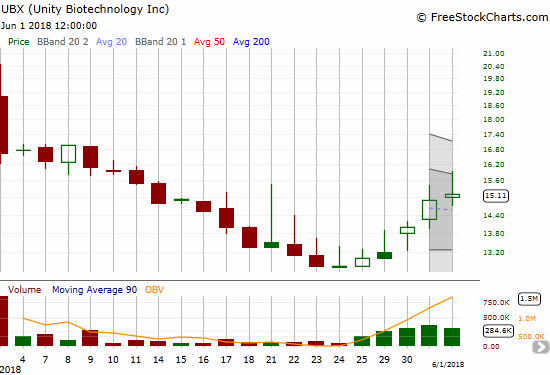
Unity Biotechnology, Inc. (UBX)
Like AXON, UBX is a promising small bio-tech company. The company’s IPO was underwhelming: the stock priced at $17, opened at $19, and closed at $16.65. A close below the IPO price is almost always a red flag. In three more weeks UBX closed at its all-time low of $12.76. Starting the 25th, buyers finally started showing up in force. The stock has gained every day since then as analysts have initiated coverage: Goldamn neutral target @ $17, Morgan Stanley overweight target @ $25, Citigroup buy target @ $32. The stock faded all the way from $16 on Friday. I held back on buying as I want to see whether there is any “sell the news” action after the annual meeting of the American Society of Clinical Oncologists (ASCO) ends on June 5th. I am a buyer on a dip to $14 or so.
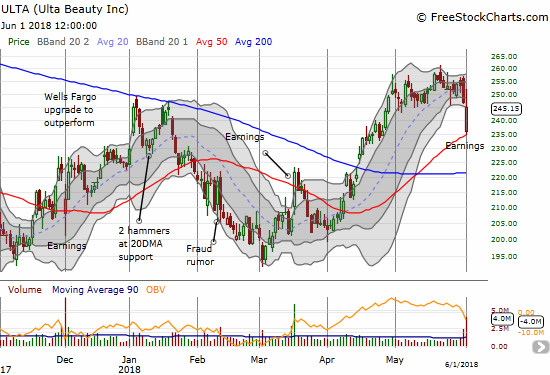
Ulta Beauty (ULTA)
Looks like I did good to take profits in ULTA ahead of earnings. The company disappointed “expectations” with a curious mix of downward guidance for earnings and revenue for Q2, reaffirming revenue growth for the year, and increasing EPS guidance for the year. It is tough for any expensive stock to survive earnings and a lot tougher when the company presents any chinks in the armor. I was impressed by the picture-perfect bounce from 50DMA support, but after the stock closed the gap I decided to fade with a put option. ULTA is bullish again on a breakout above the last highs.
— – —
FOLLOW Dr. Duru’s commentary on financial markets via email, StockTwits, Twitter, and even Instagram!
“Above the 40” uses the percentage of stocks trading above their respective 40-day moving averages (DMAs) to assess the technical health of the stock market and to identify extremes in market sentiment that are likely to reverse. Abbreviated as AT40, Above the 40 is an alternative label for “T2108” which was created by Worden. Learn more about T2108 on my T2108 Resource Page. AT200, or T2107, measures the percentage of stocks trading above their respective 200DMAs.
Active AT40 (T2108) periods: Day #73 over 20%, Day #42 over 30%, Day #37 over 40%, Day #19 over 50%, Day #2 over 60% (overperiod), Day #87 under 70%
Daily AT40 (T2108)
")
Black line: AT40 (T2108) (% measured on the right)
Red line: Overbought threshold (70%); Blue line: Oversold threshold (20%)
Weekly AT40 (T2108)

*All charts created using freestockcharts.com unless otherwise stated
The charts above are my LATEST updates independent of the date of this given AT40 post. For my latest AT40 post click here.
Related links:
The AT40 (T2108) Resource Page
You can follow real-time T2108 commentary on twitter using the #T2108 or #AT40 hashtags. T2108-related trades and other trades are occasionally posted on twitter using the #120trade hashtag.
Be careful out there!
Full disclosure: long ULTA put, long UVXY calls, long EWZ, long TLT puts, long AMZN calendar call spread, long CAT put calendar spread, long AXON shares
*Charting notes: FreeStockCharts.com stock prices are not adjusted for dividends. TradingView.com charts for currencies use Tokyo time as the start of the forex trading day. FreeStockCharts.com currency charts are based on Eastern U.S. time to define the trading day.