

The Market Breadth Summary
- Equity rebounds are struggling to hold as AI-driven panic triggers broad-based selling and weakens overall market breadth.
- The S&P 500 continues to pivot around its 50-day moving average, reflecting ongoing indecision.
- The NASDAQ trends below declining short-term moving averages, increasing the risk of a test of longer-term support.
- Market breadth indicators signal deterioration.
- Financial stocks broke below major technical levels, reinforcing concerns about sector-specific vulnerability and failed rebounds.
- Select post-earnings surges generate sharp countertrend rallies, but some key rebounds faded quickly under overhead resistance.
- Rising volatility and weakening breadth suggest that any sustained rebounds will require stronger internal participation across sectors.
Stock Market Commentary
The major indices closed marginally lower for the week, but market conditions deteriorated notably beneath the surface as the AI panic continued to weigh on stocks. The week started off with broad-based selling in the wake of an AI doomsday post from a little known research group called Citrini. The formula is now very familiar: release any early preview of the future AI Apocalypse and financial markets instantly panic and sell. The stock market is particularly vulnerable because software’s version of AI Panic, the Saaspocalypse is immediately palpable and enduring since last year. In this latest episode of AI Panic, cooler heads prevailed for a 3-day bounce with a few key names surviving Friday’s pullback in the wake of hot inflation numbers from the Producer Price Index (PPI). Now with the U.S. and Israel in an all-out war against Iran, the market may struggle to preserve the surviving rebounds.
In the middle of the week, Nvidia reported earnings. The highly anticipated report failed to deliver, and the ensuing fade symbolized an increasingly exhausted AI trade.. All the pieces are in place for a rough and volatile March.
The Stock Market Indices
S&P 500 (SPY)
The S&P 500 continues to chop in its journey to nowhere that started in October. The thrashing has recently focused on pivoting around its 50-day moving average (DMA) (the red line). While the index closed the week below its 50DMA, this trading range keeps the S&P 500 out of true bearish territory. Until the 6800 level gives way to further selling, the index is essentially waiting around to meet its uptrending 200DMA (blue line). I have an on-going hedge using a SPY March 660/640 put spread. I added an attempt at a trade range trade with a weekly calendar call spread at the $700 strike that is now a long $700 call expiring on Friday.
")
NASDAQ (COMPQ)
The NASDAQ is definitively bearish with a double-top at all-time highs looming as an ongoing reminder. The tech-laden index traded below its 50DMA for nearly all of February. Both its 20DMA (the dashed line) and 50DMA are trending downward. A test of 200DMA support looks imminent within the next few weeks at the current rate of trading. However, the test could be anticlimactic without a break below the NASDAQ’s extended and wide trading range dating back to October with the November low around 22,000.
")
iShares Russell 2000 ETF (IWM)
IWM closed out February hanging on to bullish technicals, successfully testing 50DMA support, and outperforming the S&P 500 and the NASDAQ. This reliable trading helped me to profit a few times from my IWM call buying strategy (simply buy dips to or near support and sell a subsequent bounce). Even with IWM’s relative bullishness, the ETF of small caps is starting to develop a trading range going back to the January breakout to all-time highs.
")
The Short-Term Trading Call With Rebounds
- AT50 (MMFI) = 50.9% of stocks are trading above their respective 50-day moving averages
- AT200 (MMTH) = 58.6% of stocks are trading above their respective 200-day moving averages
- Short-term Trading Call: neutral
AT50 (MMFI), the percentage of stocks trading above their respective 50DMAs, closed the week at 50.9%. It was a doubly bearish week for my favorite technical indicator. The Citrini report created widespread damage in the stock market and sent AT50 careening to a near 3-month low. A subsequent rebound recovered all the losses in three days, but Friday’s renewed selling took AT50 right back down. At least it stopped short of the lows of the week as some rebounds clung to life. Still, those rebounds with remaining life look tenuous.
AT200 (MMTH), the percentage of stocks trading above their respective 200DMAs, closed the week at 58.6%, short of the 2-month low it set to start the week. This longer-term indicator of the health of market breadth is looking more and more tired as a short-term downtrend has emerged from the recent peak.
Combine the steady retreat in AT200 with AT50’s freshly bearish breakdown and with a volatility index (VIX) that continues to trend higher, and the market looks increasingly vulnerable to a real pullback that would definitively bring last week’s rebounds to an end.
")
In case you missed it…
I pointed how my trade on insider buying GoPro (GPRO) failed to work. Interestingly, GPRO finally rallied off the important $.80/share mark. Earnings are coming up soon. I also created a short video version of my case for buying International Business Machines (IBM) in the wake of a vicious hit from fresh AI Panic.
Financial Select Sector SPDR Fund (XLF)
Description: Financial Select Sector SPDR Fund (XLF) is an ETF that seeks to provide investment results that, before expenses, correspond generally to the price and yield performance of publicly traded equity securities of companies in the Financial Select Sector Index.
Technical status: State Street Financial Select Sector SPDR ETF (XLF) broke down below its 200DMA. Failed rebound attempts have created churn below resistance.
Trade commentary: XLF confirmed its bearishness with two failures at resistance from its 200-day moving average (DMA). I saw a lot of alarming headlines (rising panic) about financials, including concerns about overextended private equity and capital markets extending loans to software and AI-related companies that could go bad. The technicals suggest that financials are in the early stages of a large correction. I am looking to fade rallies until a 200DMA breakout.
")
JPMorgan Chase & Co. (JPM)
Description: JPMorgan Chase & Co. is a global financial services firm providing investment banking, commercial banking, asset management, and consumer financial services.
Technical status: JPMorgan Chase & Co (JPM) broke down below its 50DMA and continued to tumble, now just barely clinging to 200DMA support.
Trade commentary: JPM is one of the few financials clinging to 200DMA support. Given the damage across financial stocks, I expect JPM to eventually give up that support. There is growing panic around private equity, extended capital markets lending, and exposure to AI-related loans. If financials are in the early stages of a larger correction, JPM will not be immune…even with Jamie Dimon at the helm with his eyes wide open criticizing some of his peers for “doing dumb things.”
")
Goldman Sachs Group, Inc. (GS)
Description: Goldman Sachs Group, Inc. is a global investment banking, securities, and asset management firm serving corporations, financial institutions, and governments.
Technical status: Goldman Sachs Group Inc (GS) confirmed converged 20DMA and 50DMA resistance after plunging 7.5% on heavy volume.
Trade commentary: GS is another financial stock still above its 200DMA, but its short-term technical condition is still poor with a significant pullback from 50DMA resistance (red line). Sentiment changed in February with the stock suddenly falling to a 3-month low. GS closed Friday well below its lower Bollinger Band (BB), so I fully expect some kind of rebound in coming days. However, I want to fade such a rebound.
")
KKR & Co. Inc. (KKR)
Description: KKR & Co. Inc. is a global investment firm specializing in private equity, credit, infrastructure, and alternative asset management strategies.
Technical status: KKR & Co Inc (KKR) dropped alongside its lower Bollinger Band, eventually falling 6.3% and closing at a two-year low.
Trade commentary: KKR sits at the center of a panic in financials. The stock has slid relentlessly with high trading volume indicating distribution. KKR is down 31% year-to-date and is a flagship stock warning about conditions for financials.
")
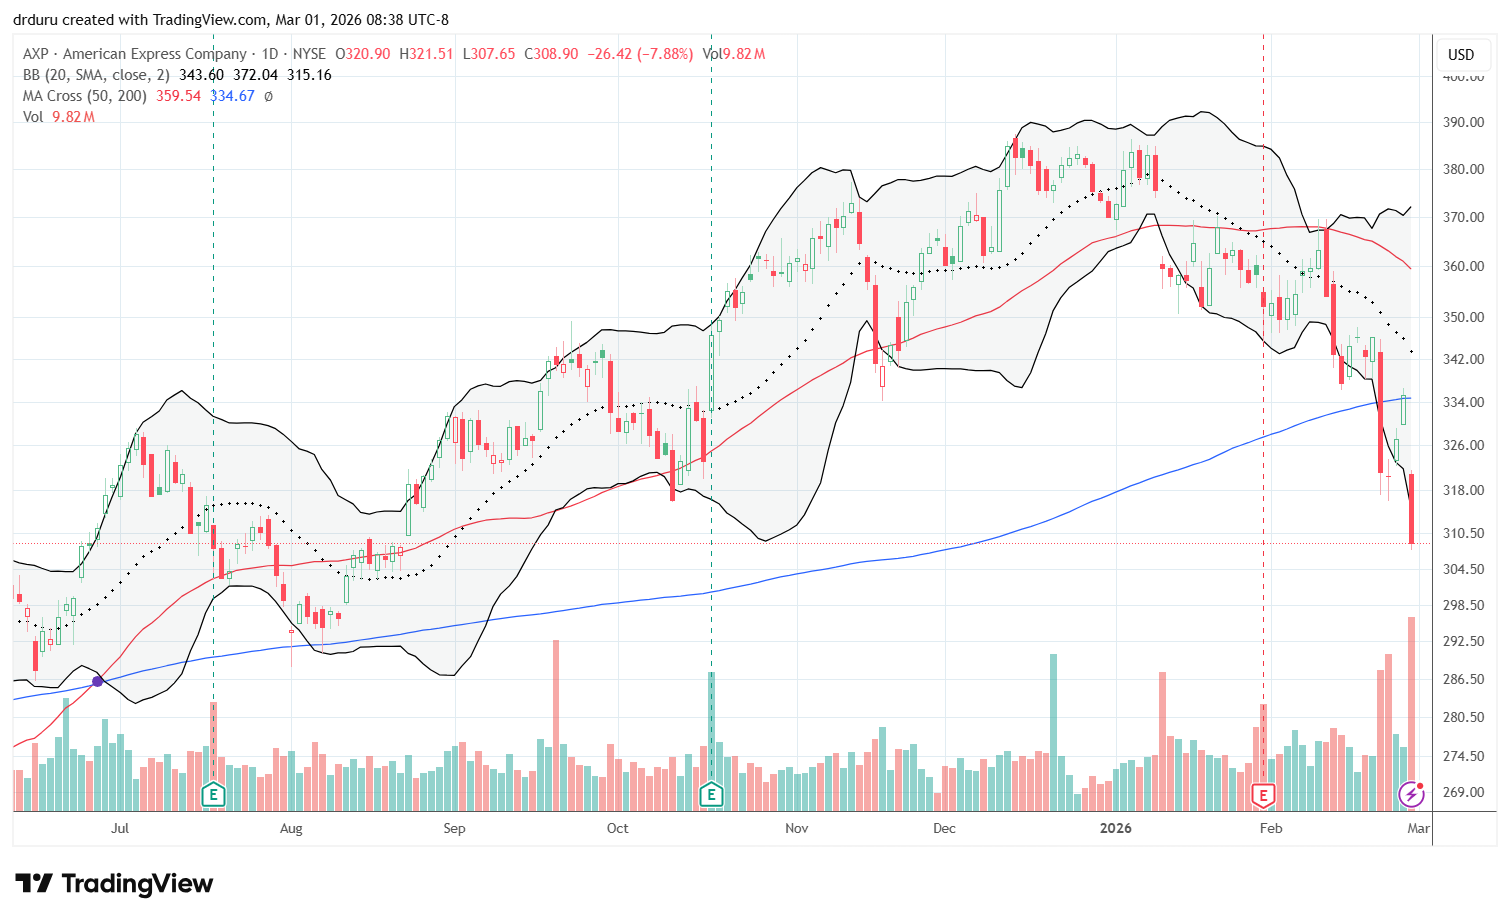
American Express Corporation (AXP)
Description: American Express (AXP) is a globally integrated payments company that provides consumers and businesses with access to products, insights, and experiences.
Technical status: American Express (AXP) fell deeper into bearish territory after a 200DMA breakdown and then a rebound that failed at 200DMA resistance. AXP closed the week at a near 7-month low.
Trade commentary: If I had been watching financials last week, I would have targeted AXP for a short. The stock made a classic oversold bounce followed by a classic failure at 200DMA resistance. Like the rest of the sector, I am looking to fade bounces until a 200DMA breakout.
Block, Inc. (XYZ)
Description: Block, Inc. provides payment processing solutions, financial services, and commerce tools through platforms such as Square and Cash App.
Technical status: Block Inc (XYZ) surged 16.8% post-earnings, surging away from year long lows with a 50DMA breakout.
Trade commentary: The market cheered layoffs and headcount reductions, viewing them as efficiency improvements from AI. However, I suspect some of the AI efficiency narrative is masking deeper business issues given the company’s headcount grew parabolically in recent years. The layoffs bring that growth to a linear trajectory. Still, the 50DMA breakout is a positive development even with the stock going nowhere since 2018. I would not buy the stock below its 200DMA, and I would short it below its 50DMA.
")
Circle Internet Group, Inc. (CRCL)
Description: Circle Internet Group, Inc. is a financial technology company focused on stablecoin infrastructure and digital payment systems.
Technical status: Circle Internet Group, Inc. (CRCL) broke out above its 50DMA after a 35.5% post-earnings surge, confirming the breakout with a second higher close.
Trade commentary: CRCL is finally technically bullish. I am looking to buy the dips from here as long as CRCL remains above its 50DMA. Note that stock is worth less than a third of its all-time closing high. However, stablecoins appear positioned as future payment rails, so I want to follow this company and its peers.
")
NVIDIA Corporation (NVDA)
Description: NVIDIA Corporation designs graphics processing units (GPUs) and computing platforms used in gaming, data centers, artificial intelligence, and autonomous systems.
Technical status: After suffering a 5.5% post-earnings loss, NVIDIA Corp (NVDA) broke down below its 50DMA and dropped close to a long overdue test of 200DMA support.
Trade commentary: NVDA has gone nowhere since July despite its premier position in financial news. The post-earnings fake breakout and heavy volume reversal are concerning, especially given NVDA was up as much as 3% in after hours following its earnings report. A long overdue test of 200DMA support is likely days away, but the technical drama may be anti-climactic given the test will happen above the lower bounds of NVDA’s trading range. NVDA hits the dangerzone below $165 or so. However, at that point I will be much less interested in shorting NVDA and more interested in significantly reducing my exposure to AI-related trades.
")
International Business Machines Corporation (IBM)
Description: International Business Machines Corporation provides hybrid cloud, AI solutions, consulting services, and enterprise technology infrastructure.
Technical status: International Business Machines Corporation (IBM) declined throughout February and dropped 13.2% to a 13-month low after an AI Panic. The subsequent 3-day rebound fell short of reversing Monday’s loss.
Trade commentary: I bought IBM at Tuesday’s open. The stock gapped up from the previous day’s close which signaled the potential for a “bear trap”. The trade was even more compelling given Monday’s historic plunge driven by AI Panic. This trade was a classic contrarian play. I took profits on the third day after noticing a significant fade from the highs of the day. Like many stocks last week, IBM printed a classic 3-day bounce from oversold conditions. Now, I am a buyer on dips unless the stock manages to break below Monday’s close ($223.35). For now, I am assuming the technical damage is bad enough that IBM will struggle to overcome overhead resistance from its converging 50DMA and 200DMA.
")
Adobe Inc. (ADBE)
Description: Adobe Inc. develops software for digital media creation, marketing, document management, and creative design.
Technical status: Adobe Inc (ADBE) rebounded from new multi-year lows and gained 1.3% on Friday despite an initial gap down. This outperformance versus tech is a potential bottoming sign.
Trade commentary: ADBE finally climbed toward the top of my watch list. While trading volume was lower than in previous weeks, I like the outperformance against tech and especially the ability on Friday’s down day to battle back from a gap down to a small positive gain. I am a buyer on a close above the 20DMA with a tight stop below the 20DMA. First profit target sits at resistance from the declining 50DMA.
")
Dell Technologies Inc. (DELL)
Description: Dell Technologies Inc. provides computer hardware, enterprise infrastructure solutions, servers, and storage systems.
Technical status: Dell Technologies Inc (DELL) surged 21.9% post-earnings and reclaimed strong momentum, breaking out above its 200DMA.
Trade commentary: I sold my large DELL position in January after a confirmed 200DMA breakdown. I wanted to preserve my remaining profits. Surprisingly, DELL stopped going down and instead churned in a wide range going into earnings. The big post-earnings breakout reestablishes DELL on my generative AI buy list. The stock is a buy on the dips. Currently, DELL is well over-extended above its upper Bollinger Band.
")
Elastic N.V. (ESTC)
Description: Elastic N.V. develops search-powered solutions that enable organizations to search, analyze, and visualize data in real time.
Technical status: Elastic N.V. (ESTC) confirmed 20DMA resistance, falling 15.4% post-earnings and returned to 2023 price levels.
Trade commentary: ESTC remains bearish with a 20DMA trending downward all year. I will not consider buying the stock unless it reverses its post-earnings loss and trades above $56. Such a move would start repairing the damage from the accelerated selling.
")
Workday, Inc. (WDAY)
Description: Workday, Inc. provides cloud-based enterprise software solutions for human resources, payroll, and financial management.
Technical status: Workday Inc (WDAY) gapped down on earnings but closed up 2.2% on heavy volume. I bought into this sharp reversal as an early sign of a potential bottom.
Trade commentary: I bought two tranches of WDAY expecting a potential rebound similar to Adobe. The stock has suffered significant technical damage, but the upside could be meaningful if a run gets going. (WDAY’s latest results passed my SaaSpocalypse analytical framework. More details to come).
")
GoDaddy Inc. (GDDY)
Description: GoDaddy Inc. provides domain registration, website hosting, and digital marketing tools for small businesses and entrepreneurs.
Technical status: GoDaddy Inc. (GDDY) fell 14.3% post-earnings but rebounded from levels last seen at the start of the stock’s big 2023 breakout. The stock remains stuck in a steep downtrend.
Trade commentary: GDDY caught my interest last week due to its strange chart that made upcoming earnings particularly interesting. The stock delivered more intrigue as the post-earnings plunge completed a full reversal of GDDY’s breakout from late 2023. Buyers also seem to be stepping in right on time with two strong days of buying following the post-earnings plunge. Thus, GDDY has a strong prospect of holding a bottom. However, the panic associated with the SaaSpocalypse remains strong, and GDDY does not make my cut as a potential survivor (although my SaaSpocalypse analytical framework claims GDDY is a survivor – more to come later!).
")
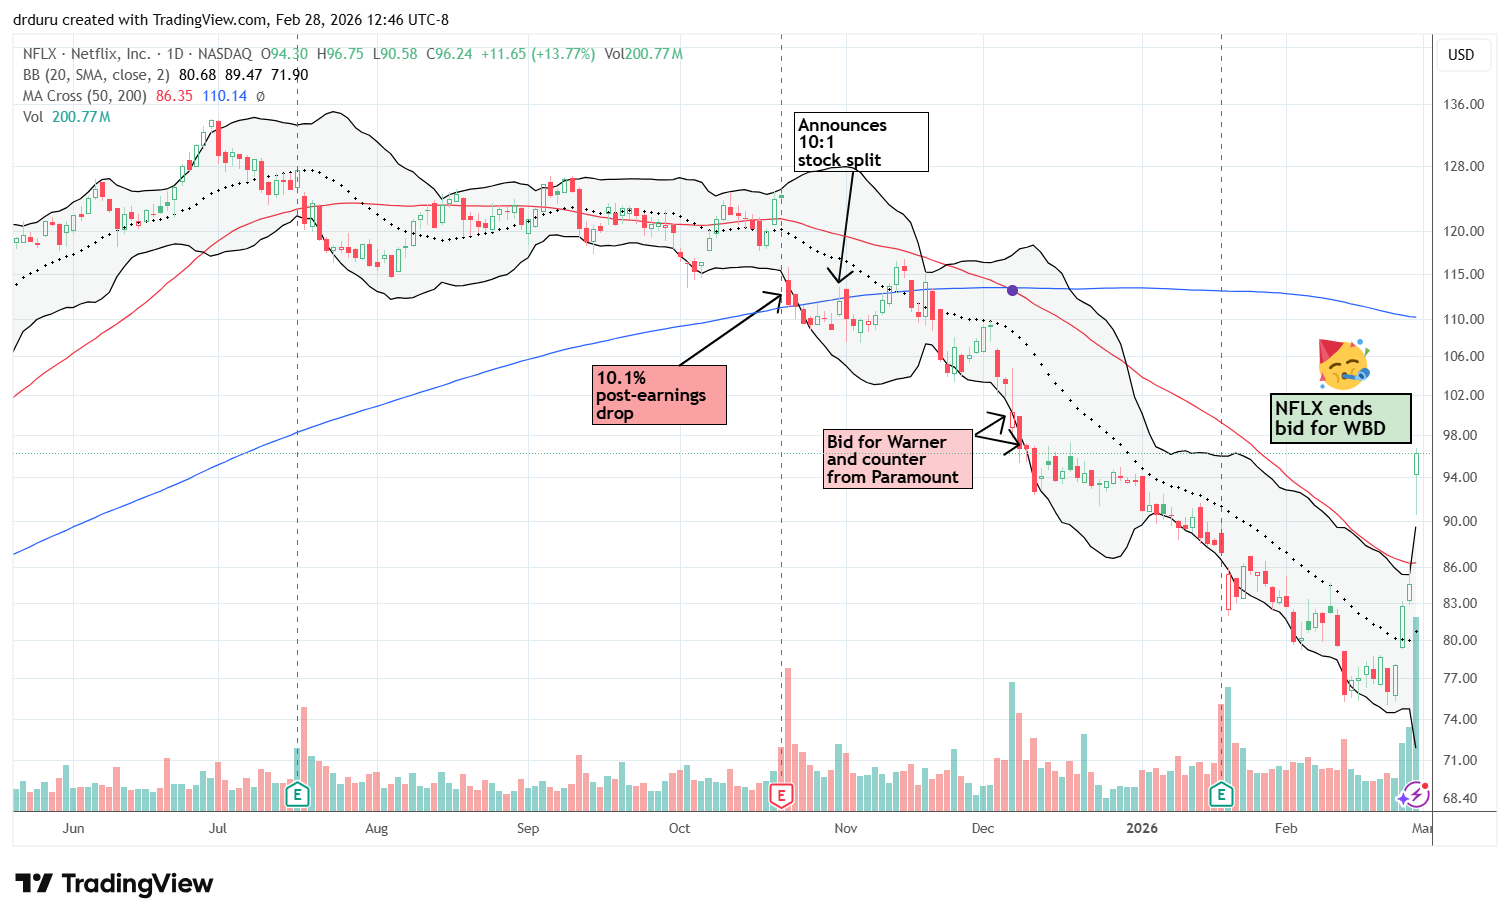
Netflix, Inc. (NFLX)
Description: Netflix, Inc. is a streaming entertainment company offering subscription-based video content, including original films and series.
Technical status: Netflix (NFLX) jumped 13.8% in celebration of abandoning the expensive bid for Warner Brothers Discovery. I took profits as the stock has nearly recovered its loss since the first bid.
Trade commentary: NFLX seemed like another classic contrarian trade. This case is not about panic, more about a crash in sentiment due to Netflix’s pursuit of Warner Brothers Discovery, a vote of no confidence in the management for wanting such a deal. My pre-earnings trade in call options failed but I stubbornly accumulated shares after that. My confidence grew after it became clear Paramount was not giving up. The big payday came on Friday after news that NFLX was not interested in countering Paramount’s latest offer. I took profits and consider NFLX a buy the dip from here with the bullish 50DMA breakout. The stock is over-extended above its upper Bollinger Band, so I am surprised the stock was able to close at its intraday high.
Zoom Video Communications, Inc. (ZM)
Description: Zoom Video Communications, Inc. provides cloud-based video conferencing, communications, and collaboration software for enterprises and consumers.
Technical status: Zoom Communications Inc (ZM) broke down below its 50DMA before falling 11.6% post-earnings and crashing down below its 200DMA.
Trade commentary: My stubbornness failed to pay off with ZM. I was hopeful that ZM pulled off a sustainable breakout after news of a substantial stake in Anthropic sent the stock higher by 11.3% to a 3 1/2 year high. While the stock held its 50DMA breakout for most of February, I did not take the stronger cue from the lack of follow-through buying. Shortly after a 50DMA breakdown, ZM suffered a bearish post-earnings 200DMA breakdown. The stock is right back to the middle of its churn, and I am back to waiting for the market to appreciate how much undervalued ZM has become. I heard references to ZM getting hit by the SaaSpocalypse. If so, I do not understand such AI Panic given ZM has had plenty of competitors for years from free consumer options to fully-featured enterprise quality platforms.
")
FIGS, Inc. (FIGS)
Description: FIGS, Inc. designs and sells premium medical apparel, including scrubs and healthcare workwear.
Technical status: Figs Inc (FIGS) popped up 23.9% post-earnings and confirmed its bullish trend after breaking out above its 50DMA.
Trade commentary: There was a time that I thought FIGS could be discovered as a cheaper alternative to lulu for leisurely work-from-home pants. However, I soon gave up on the idea after the stock crashed post-earnings in 2022. For three years, my capitulation seemed validated as the stock slowly churned to an all-time low of $3.65 last March. I put the stock back on my radar as it rallied later in the year. Still, I never decided to buy back in. Now, with the stock soaring post-earnings to a near 4-year high, I am left wondering how the company and the stock could pull off such a swift and steep turnaround. As a professed contrarian, I should not miss these kinds of turnarounds! Anyway, FIGS is now trading well above its upper Bollinger Band, but the stock is a buy the dips from here if it can hold 50DMA support.
")
Cava Group, Inc. (CAVA)
Description: Cava Group, Inc. operates Mediterranean fast-casual restaurants offering customizable bowls, pitas, and salads.
Technical status: Cava Group, Inc. (CAVA) set a new high for the year as it soared 26.4% post-earnings, breaking out above the 200DMA and reversing losses since August earnings.
Trade commentary: CAVA shifted from bearish to bullish positioning by holding 50DMA support and then breaking our above its 200DMA resistance. This turnaround ends a fall from its status as a darling IPO in 2024 and fills the gap from last August’s earnings. The stock is a buy the dips from here until/unless it drops below its 50DMA again.
")
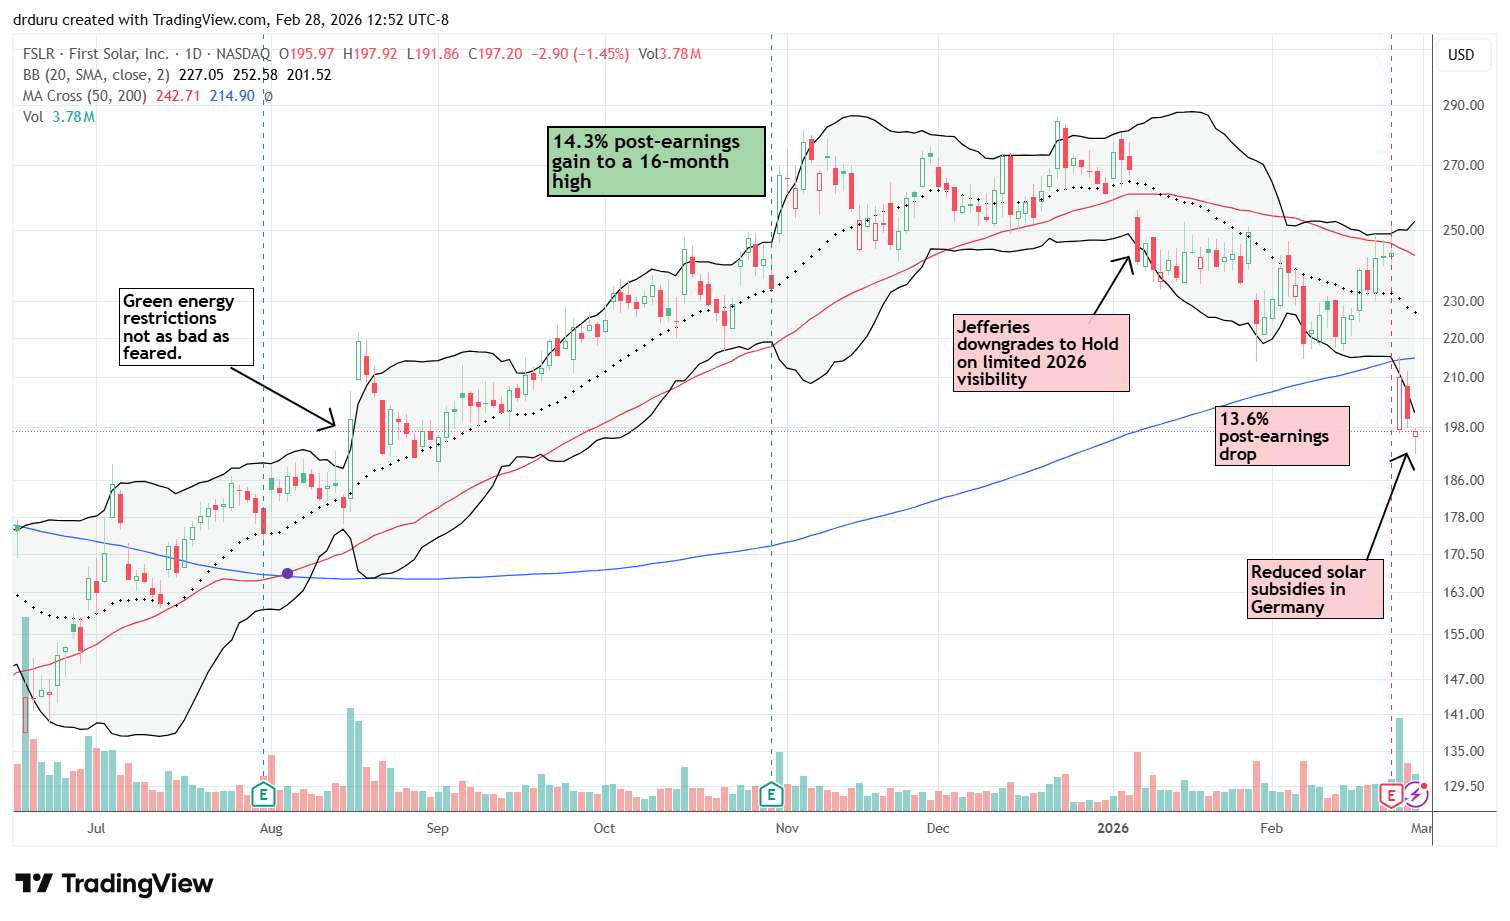
First Solar, Inc. (FSLR)
Description: First Solar, Inc. manufactures solar panels and provides utility-scale photovoltaic solar energy solutions.
Technical status: First Solar (FSLR) broke down below its 200DMA with a 13.6% post-earnings drop. A significant drop in German subsidies confirmed FSLR’s bearish position.
Trade commentary: With my technical concerns further validated in early February from a gap down from 20DMA resistance, I was happy to remain on the sidelines for FSLR. Now, FSLR is in deep bearish territory with a post-earnings 200DMA breakdown and confirmational selling after Germany announced a significant reduction in solar subsidies. I did not realize FSLR remained dependent on subsidies especially the way it fought through the negative headwinds since the President’s election. I will continue to watch how the story unfolds as I look for a steep discount to buy.
CECO Environmental Corp. (CECO)
Description: CECO Environmental Corp. provides industrial air quality and environmental protection solutions.
Technical status: CECO Environmental Corp (CECO) dropped 22.8% post-earnings and a subsequent rebound failed at 50DMA resistance.
Trade commentary: CECO likely continues lower without a catalyst. The technical damage is significant. I am on alert for an eventual test of 200DMA support. CECO last touched its 200DMA back in June and has been a winner since a 2022 breakout from a decades long trading range.
")
ATI Inc. (ATI)
Description: ATI Inc. produces specialty metals and advanced materials for aerospace, defense, and industrial markets.
Technical status: Following earnings, ATI Inc (ATI) continued an orderly uptrend along its upper Bollinger Band, hitting new all-time highs along the way.
Trade commentary: ATI remains a favorite industrial name. However, the stock is up another 33% or so after I flagged it two months ago as a stock I need to stop trading and just buy and hold. The February run-up alone is quite impressive especially considering the muted (5.4%) one-day response to earnings. Now all I can do is continue waiting for a buyable dip.
")
Everest Construction Group (ECG)
Description: Everest Construction Group provides electrical grid and infrastructure construction services.
Technical status: Everus Construction Group Inc (ECG) surged 24.8% post-earnings to an all-time high. The following pullback looks buyable.
Trade commentary: A stock like ECG should have hit my radar alongside the generative AI trade. ECG caught my notice after the last week’s post-earnings surge. I plan to nibble on shares this week for a “no regrets” position while hoping I can get more of a discount at some point soon.
")
Fastenal Company (FAST)
Description: Fastenal Company distributes industrial and construction supplies, including fasteners, tools, and safety equipment.
Technical status: Fastenal Company (FAST) reclaimed its 200DMA after earnings and held the line as support. The stock drifted lower after starting February with a sharp rally.
Trade commentary: I bought FAST after its October post-earnings drop as a long-term position. As expected and given the long-term trajectory of FAST, the stock eventually reversed all its post-earnings loss. The stock even lost 2.6% after January earnings, but buyers immediately bought the lows and have not looked back since. Assuming converged support holds at the 50DMA and 200DMA, I will eventually add more shares.
")
Novo Nordisk A/S (NVO)
Description: Novo Nordisk A/S develops and manufactures pharmaceutical products, including treatments for diabetes and obesity.
Technical status: Novo Nordisk A/S (NVO) failed to recover from its post-earnings crash at the start of the month, as it continued to fall to levels last seen in 2021 on continued negative news flow.
Trade commentary: NVO is an outright disaster. I missed my chance to get out and leave this failed recovery story back in August. The calls I sold against my position over this time do not make up for the losses. I am close to abandoning the stock in the coming weeks and will not consider returning until/unless it closes above $41.50. Such a price action could start the next recovery attempt after NVO collapsed on bad pricing news on its GLP1 drug Wegovy. At near 5-year lows, the company might as well have never gotten into the GLP1 business!
")
")
")
Be careful out there!
Footnotes
Subscribe for free to get email notifications of future posts!
“Above the 50” (AT50) uses the percentage of stocks trading above their respective 50-day moving averages (DMAs) to measure breadth in the stock market. Breadth defines the distribution of participation in a rally or sell-off. As a result, AT50 identifies extremes in market sentiment that are likely to reverse. Above the 50 is my alternative name for “MMFI” which is a symbol TradingView.com and other chart vendors use for this breadth indicator. Learn more about AT50 on my Market Breadth Resource Page. AT200, or MMTH, measures the percentage of stocks trading above their respective 200DMAs.
Active AT50 (MMFI) periods: Day #160 over 20%, Day #49 over 30%, Day #47 over 40%, Day #42 over 50% (overperiod), Day #7 under 60% (underperiod), Day #133 under 70%
Source for charts unless otherwise noted: TradingView.com
Full disclosure: long IWM shares, long SPY put spread, long SPY call, long IWM calendar call spread, long WDAY, long ZM, long FAST, long NVO
FOLLOW Dr. Duru’s commentary on financial markets via StockTwits, BlueSky, and even Instagram!
*Charting notes: Stock prices are not adjusted for dividends. Candlestick charts use hollow bodies: open candles indicate a close higher than the open, filled candles indicate an open higher than the close.
* Blog notes: this blog was partially written based on the heavily edited transcript of the following video that includes a live review of the stock charts featured in this post. I used ChatGPT to process the transcript.