

The Market Breadth Summary
- Markets are thrashing as sector rotation turns into sharp divergence beneath major indices.
- Market breadth remains bearish, with AT50 and AT200 deteriorating despite pockets of strength.
- The NASDAQ remains stuck under a double-top pattern while the S&P 500 thrashes around key moving averages.
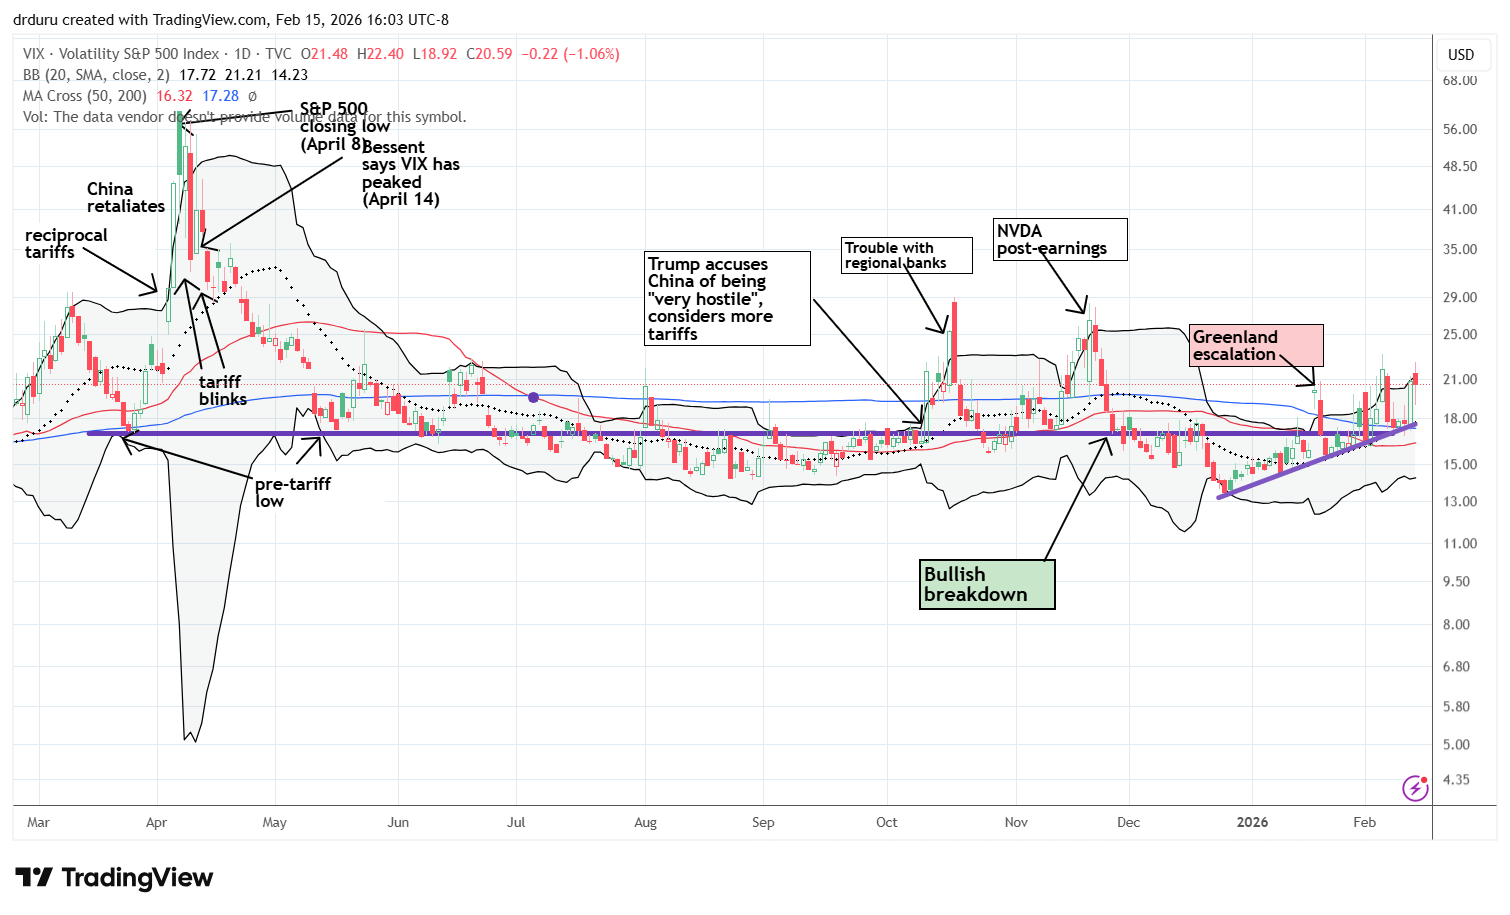
- Rising volatility signals elevated risk as the VIX maintains a short-term uptrend.
- Small caps are outperforming large-cap tech, highlighting fragmentation across asset classes.
- Software stocks continue to break down technically as part of the SaaSpocalypse delivered by an AI Panic.
- Utilities and select non-tech sectors show resilience, invalidating broad bearish calls.
Stock Market Commentary
Chaotic trading continued last week. Some segments of the market are doing extremely poorly and other segments of the market that are doing extremely well. A market rotation has turned into stark divergence hidden by major indices which are mainly thrashing about.
I see three major signals. One, market breadth is still in an overall bearish position. Two, the volatility index (VIX) continues to warn that risk is rising in the market. And three, tech stocks are in a confirmed bearish double top. This combination should make me bearish. However, I downgraded to neutral last week because of the number bullish sectors in the market. A neutral stance provides opportunity to trade where I see the puck headed whether forward or backward.
Two big economic releases bracketed the market’s big down day on Thursday. The delayed jobs report for January was strong but also included major downward revisions for 2025. The inflation report (CPI) on Friday was benign relative to “expectations” but the path to the Fed’s target remains too slow for comfort. It was odd to see the market’s biggest move of the week occur between these two reports with little direct market reaction to the economic releases.
The Stock Market Indices
S&P 500 (SPY)
The S&P 500 broke down below its 50-day moving average (DMA) (the red line), just like the previous week. Even though the S&P 500 held flat on Friday, I see bearish territory. Prior to last week and since October 10 of last year, the S&P 500 has either tested or broke through 50DMA support 5 times. Each time, buying the test or the breakdown delivered quick profits in the coming days. I have been waiting for this pattern to finally stop working under the assumption that buyers are gradually getting exhausted. See the sharp intraday fade from the highs of the day on Friday make me think that THIS time is indeed truly different. Buyers and sellers ended the day in a perfect stalemate.
I examined the equal weight S&P 500 (RSP) as a point of comparison. The selling on Thursday was so bad that RSP had a rare big down day, dropping 1.3% (could it have been contagion from the AI-driven hit to trucking and logistics stocks?). However, on Friday RSP rebounded sharply with a 1% gain. RSP neatly maintained its uptrend on the 20DMA, a trend that has been in place all year. In other words, the S&P 500 is increasingly weighed down by tech stocks, especially the big cap tech stocks.
")
NASDAQ (COMPQ)
The NASDAQ still trades under the dark clouds of a double top formed at the all-time highs. The tech-laden index’s rally from the previous week stopped cold at converging resistance from its 50DMA and its 20DMA (the dashed line). The NASDAQ had its own version of a stalemate, but it closed right at its low from the previous week. This perch looks too precarious to hold, so I fully expect a retreat for a long overdue test of 200DMA support (the blue line). Given current momentum such a test could coincide with a test of the November closing low.
")
iShares Russell 2000 ETF (IWM)
IWM is definitely outperforming the S&P 500 and the NASDAQ. The ETF of small caps remains solidly bullish after surviving the prior week’s test of 50DMA support and rebounding away from its 50DMA last week. In both cases, my call option trades around my core IWM position worked out well.
Traders and investors have clearly rotated away from the bigger stocks and into stocks like those in IWM. The bullishness in the names still benefiting from the rotation helped to convince me to upgrade from bearish to neutral on the market in general. In this divergent market you can be an unrepentant bear or a hopeful bull and get rewarded in the right sectors!
")
The Short-Term Trading Call With Relief
- AT50 (MMFI) = 55.3% of stocks are trading above their respective 50-day moving averages
- AT200 (MMTH) = 60.2% of stocks are trading above their respective 200-day moving averages
- Short-term Trading Call: neutral
AT50 (MMFI), the percentage of stocks trading above their respective 50DMAs, closed the week at 55.3%. My favorite technical indicator remains in bearish mode, per at the AT50 trading rules, because of the double failure at the overbought threshold of 70% (see chart at the end of the blog post). Friday’s 1.5 point gain was a tepid and unconvincing rebound from Thursday’s plunge to this cycle’s closing low at 53.9%. I am now looking for a clean breakdown that could be the start of a run to oversold trading conditions.
AT200, the percentage of stocks trading above their 200DMAs, has now started to erode. I previously took solace in AT200’s ability to levitate above the previous primary downtrend and above the horizontal line that marks the level at the S&P 500’s previous all-time high back in 2025. AT200 remains in this zone but looks “tired.” AT200 closed the week at 60.2%, down from the 66% cycle high.
As I watch how weakening market breadth plays out, I am watching the VIX even more intently. The sneaky short-term uptrend remains in place. Last week’s volatility bounced perfectly off this trendline. However, the volatility faders have also succeeded in making each burst short-lived. I expect a “resolution” of this building tension to include at least a test of the October and November surges.
Again, while my wariness about market breadth and the VIX should translate into bearishness, I see too many bullish segments of the market to paint such a broad brush.
In case you missed it…
I realized that long-term investors are probably loading up on Oracle Corporation (ORCL) around the $135 price level. I also took a close look at Expeditors International of Washington (EXPD) as an oversold victim of the latest AI panic which hit logistics and trucking stocks.
The Equities: Thrashing
Apple (AAPL)
Description: Apple designs and sells consumer electronics, computers, and software and services, including the iPhone, Mac, and related ecosystems.
Technical status: Apple Inc (AAPL) broke down below its 50DMA and 20DMA after 2 consecutive steep drops, confirming a double top.
Trade commentary: On Friday AAPL dropped 2.3%. On Thursday AAPL plunged 5%. It was a very bad week for Apple without any directly related news to explain why AAPL suddenly went from outperforming the NASDAQ and zooming through its earnings report to sellers suddenly turning bearish on the stock. AAPL is now negative since reporting earnings, a surprising development. If AAPL is headed for an overdue test of 200DMA support, then surely the stock can help drag down the NASDAQ to a similar test.
")
Palantir (PLTR)
Description: Palantir (PLTR) develops data analytics and software platforms used by government and commercial organizations for decision-making and operations.
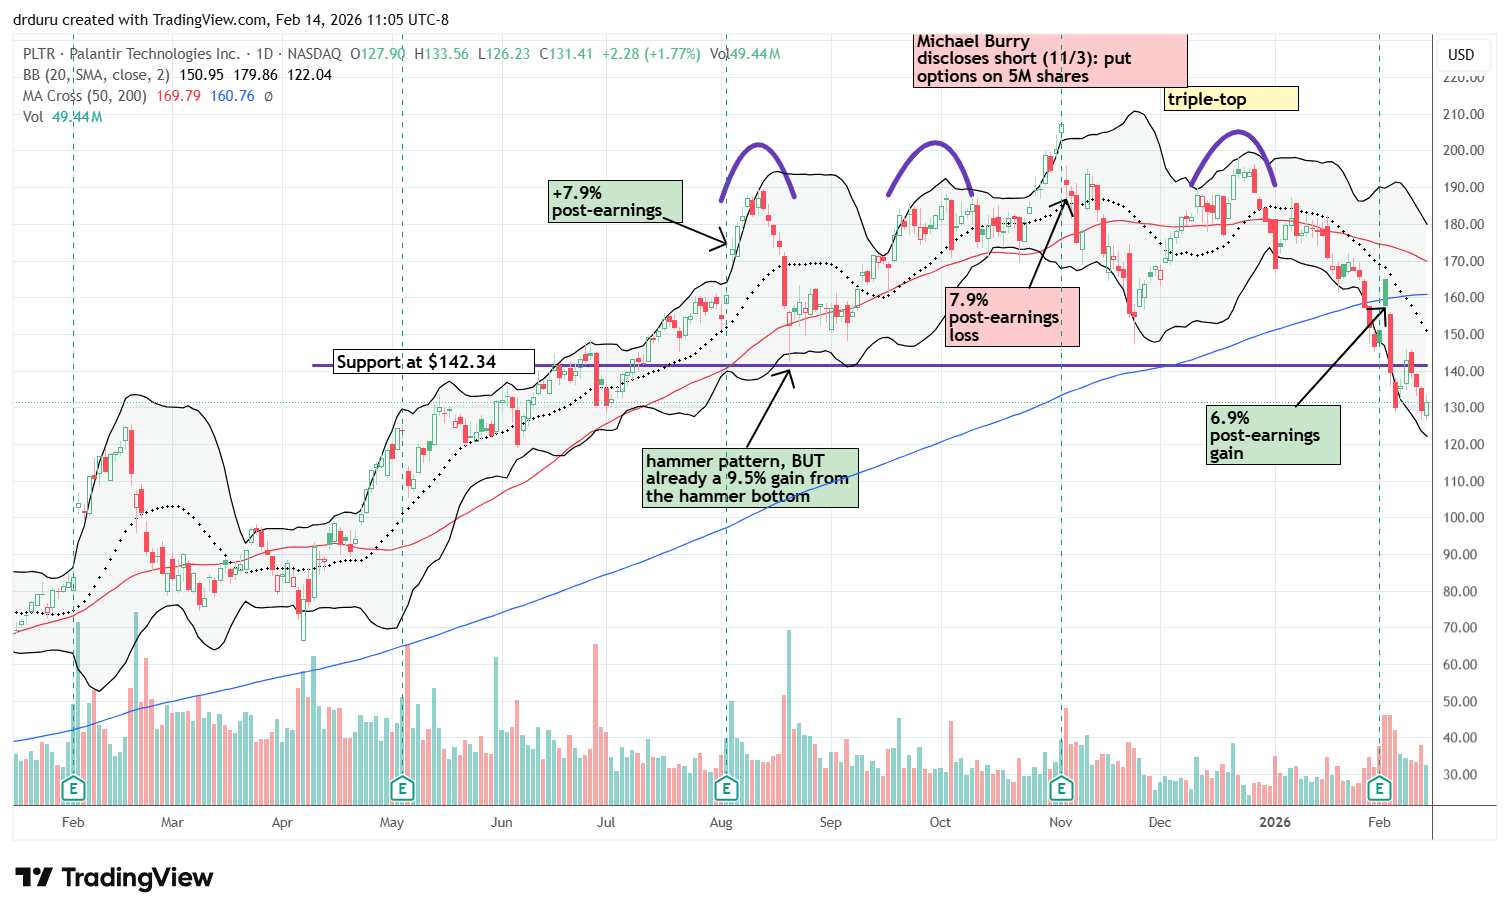
Technical status: Palantir (PLTR) lost support at $142.34 and further deepened its topping pattern.
Trade commentary: Palantir sits at the nexus of software and AI; the software portion seems to be taking over the trading action. PLTR failed a critical test at support turned resistance at $142.34. Given the high valuation, only the will of the buyers stands in the way of much lower prices from here. Just based on the technicals, I cannot even start to think about buying PLTR until a test of last April’s lows around $75. Otherwise, the stock has major work ahead to reestablish its bullish momentum after breaking down from a 7-month trading range.
Asana (ASAN)
Description: Asana provides work management software for organizing projects, tasks, and team collaboration.
Technical status: Asana (ASAN) traded straight down and stayed in a persistent downtrend. ASAN had not reflected the prior bullish setup I expected.
Trade commentary: After ASAN plunged post-earnings last year, the CEO stepped in and bought shares three times at a total value of $19.8M. The stock stabilized over this time, and I accumulated shares as part of a standard “follow the leader” trade. Unfortunately, this strategy completely fell apart in the SaaSpocalypse driven by the current AI panic. The stock has sold off nearly nonstop this year with selling accelerating at high volume since late January. I finally sold at a loss because I can see ASAN being one of the eventual losers in the AI transformation. The software is in the UI layer of the tech stack, a position most at risk of displacement by AI.
I will not dare buy back in until/unless insiders step in with major purchases again. I am reminded that investors should not fall in love with individual stocks…for any reason.
")
monday.com (MNDY)
Description: monday.com provides work management and project management software for teams and organizations.
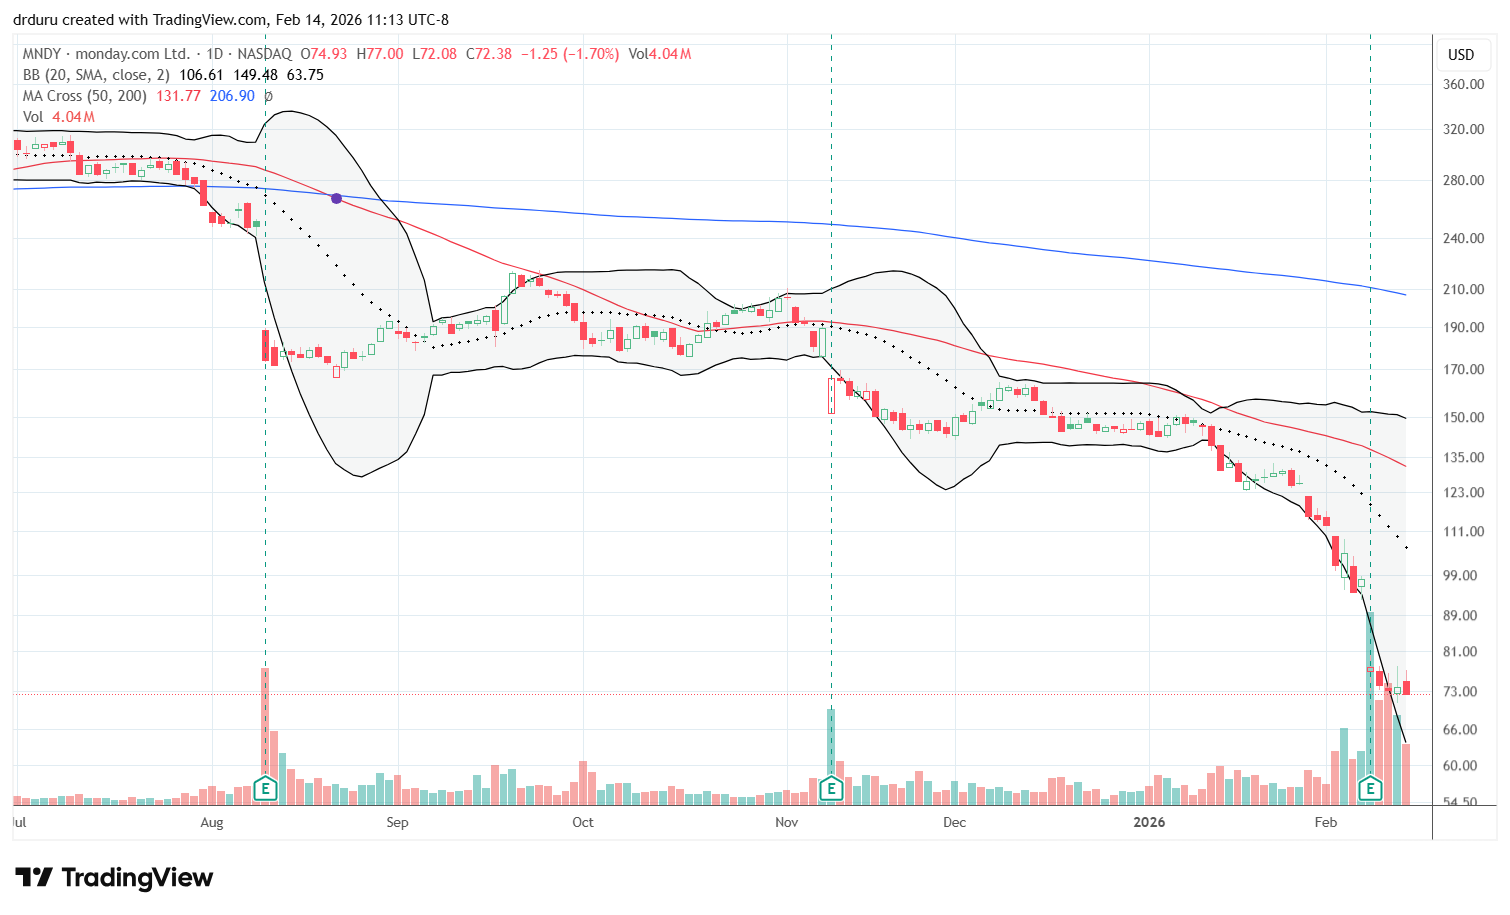
Technical status: MNDY crashed to an all-time low and had no technical reference for a bottom.
Trade commentary: CNBC broadcast an apparently prescient segment demonstrating monday.com’s software could be easily replicated with vibe coding. That segment motivated me to take my loss on ASAN, but I did not think to short MNDY ahead of its earnings. Last week, MNDY crashed 20.8% post- earnings to an all-time low. Like ASAN, there is no reference point for support, so the stock is no touch until it can at least print a close above the current post-earnings intraday high around $80.90. The current market simply offers so many better options even for speculating.
Constellation Energy Corporation (CEG)
Description: Constellation Energy produces and sells electricity, including generation that supports power demand from large customers such as data centers.
Technical status: Constellation Energy Corp (CEG) carved out a steep V-bottom in February, enough to retest 20DMA resistance.
Trade commentary: CEG made big headlines back in May of last year with a power deal with Meta Platforms (META), but CEG faded almost to flat that day. CEG next churned, recovered, and made a new all-time high. I am surprised to see CEG now in a bearish position below its 50 and 200DMAs. This bearish trading below its price when the META deal was announced is one more sign of the fatigue in the AI trade.
")
Dominion Energy (D)
Description: Dominion Energy is a utility company that provides electricity and natural gas services.
Technical status: Dominion Energy Inc (D) reached a 2-year high as it climbed alongside its upper Bollinger Band into a near parabolic move.
Trade commentary: Almost two years ago, I added Dominion to my generative AI trade. I picked Dominion as a kind of contrarian or undervalued utility play as utilities like CEG were all the rage while Dominion was still trying to recover from a recent downtrend. While CEG is still slightly outperforming Dominion since then, I remain more comfortable playing the undervalued angle rather than chasing the hot (now broken) name. I like the tortoise over the hare.
Still, I am bracing myself because Dominion is near parabolic trading with consecutive closes well above its upper Bollinger Band (BB) ahead of earnings. Parabolic moves never end well, but I do not want to time what I consider a multi-year position.
")
Cisco Systems (CSCO)
Description: Cisco Systems sells networking hardware, software, and related services for enterprise and communications infrastructure.
Technical status: Cisco Systems Inc (CSCO) gapped down sharply after earnings, breaking down below its 50DMA with a 12.3% loss.
Trade commentary: CSCO surprised me by gapping down post-earnings and losing 12%. The stock seemed to join the club of AI-driven stocks. TheStreet recently claimed that “Cisco is positioned at the center of a once-in-a-generation technology shift, with hyperscalers ordering billions of dollars in networking equipment and optics to power AI data centers.” Buyers tried to revive the AI vibes by rebounding CSCO by 2.5% on Friday. I am looking to buy CSCO once it reestablishes its uptrend above its 50DMA.
")
DraftKings (DKNG)
Description: DraftKings operates online sports betting and gaming platforms.
Technical status: DraftKings Inc (DKNG) dropped sharply by 13.5% post-earnings and a three-year low.
Trade commentary: DKNG should have been a Super Bowl play in the U.S. DKNG started the week with a 2.3% gain and then sellers took over. DKNG dropped 13.5% post-earnings and is back near a three-year low.
I was bullish on DKNG, but I am now bearish given these ugly technicals. DKNG is a broken stock with a lot to prove. I know DKNG has been rolling out more products, but I think the market is getting saturated with gambling and speculation apps and services.
")
Freshworks (FRSH)
Description: Freshworks provides customer support and business software tools delivered through cloud-based platforms.
Technical status: Freshworks Inc (FRSH) accelerated alongside its lower Bollinger Band into all-time lows.
Trade commentary: FRSH was an AI play that I thought was underappreciated. FRSH worked for a while, but I took a small profit after the stock showed weakness. After the stock broke down this year, I removed it from my radar. Now at all-time lows after a 16.4% post-earnings plunge, I cannot help wondering whether the selling is overdone. I will check-in from time to time, but the stock has a lot of work ahead to repair itself.
")
Fastly (FSLY)
Description: Fastly provides content delivery and edge cloud services for web and application performance.
Technical status: FSLY surged dramatically post earnings but remained far below historical peak levels. The longer-term recovery picture remained uncertain.
Trade commentary: FSLY came to prominence as a content-delivery network for TikTok. Geopolitical tensions forced TikTok to withdraw from Fastly in 2020. The stock has not been the same since with an all-time high in October, 2020. Fast forward to the stock’s 72.3% post-earnings surge and follow-on buying the next day for another 13.8% gain. Perhaps the shorts piled into the stock rushed all at once to cover; FSLY has 9.1% of its float sold short.
Despite those huge gains, FSLY is only back to where its traded about two years ago. Still, the stock is a buy-the-dips as a bearish to bullish reversal seems to be underway.
")
Alphabet (GOOG)
Description: Alphabet operates internet products and services including search, advertising, cloud computing, and related platforms.
Technical status: Alphabet Inc (GOOG) confirmed a 50DMA breakdown after failing to recover from a small post-earnings decline. The stock is now bearish.
Trade commentary: GOOG was doing great with a steady uptrend following the 20DMA, with brief breakdowns. Last week’s post-earnings breakdown delivered a final blow toppling GOOG from its perch. Buyers took GOOG back up after the post-earnings gap down, but GOOG did not quite close the gap. Sellers took over from there pretty much all week. GOOG is in bearish territory with a first test of support at the December closing low around $298.
")
Intuit (INTU)
Description: Intuit provides financial software and services, including tax preparation and small business accounting tools.
Technical status: Intuit Inc (INTU) sold off for most of the year with rising volume amid increased AI panic. The stock traded at a level last seen in March, 2023.
Trade commentary: Tax time is coming, and you might think INTU would do well. However, INTU is caught up in the AI software panic. INTU has sold off for most of the year, and trading volume increased along with the panic.
INTU was not on my list of software stocks to buy in this panic, but I am now keeping my eye on INTU for a good risk-reward entry. Trying to call a bottom in an indiscriminate selling panic is dangerous. Instead, I am looking to pick spots with good risk/reward. For INTU, I am waiting for the next earnings report to assess next steps.
")
Johnson Controls International (JCI)
Description: Johnson Controls provides building technologies, including HVAC and cooling solutions used in commercial and industrial settings.
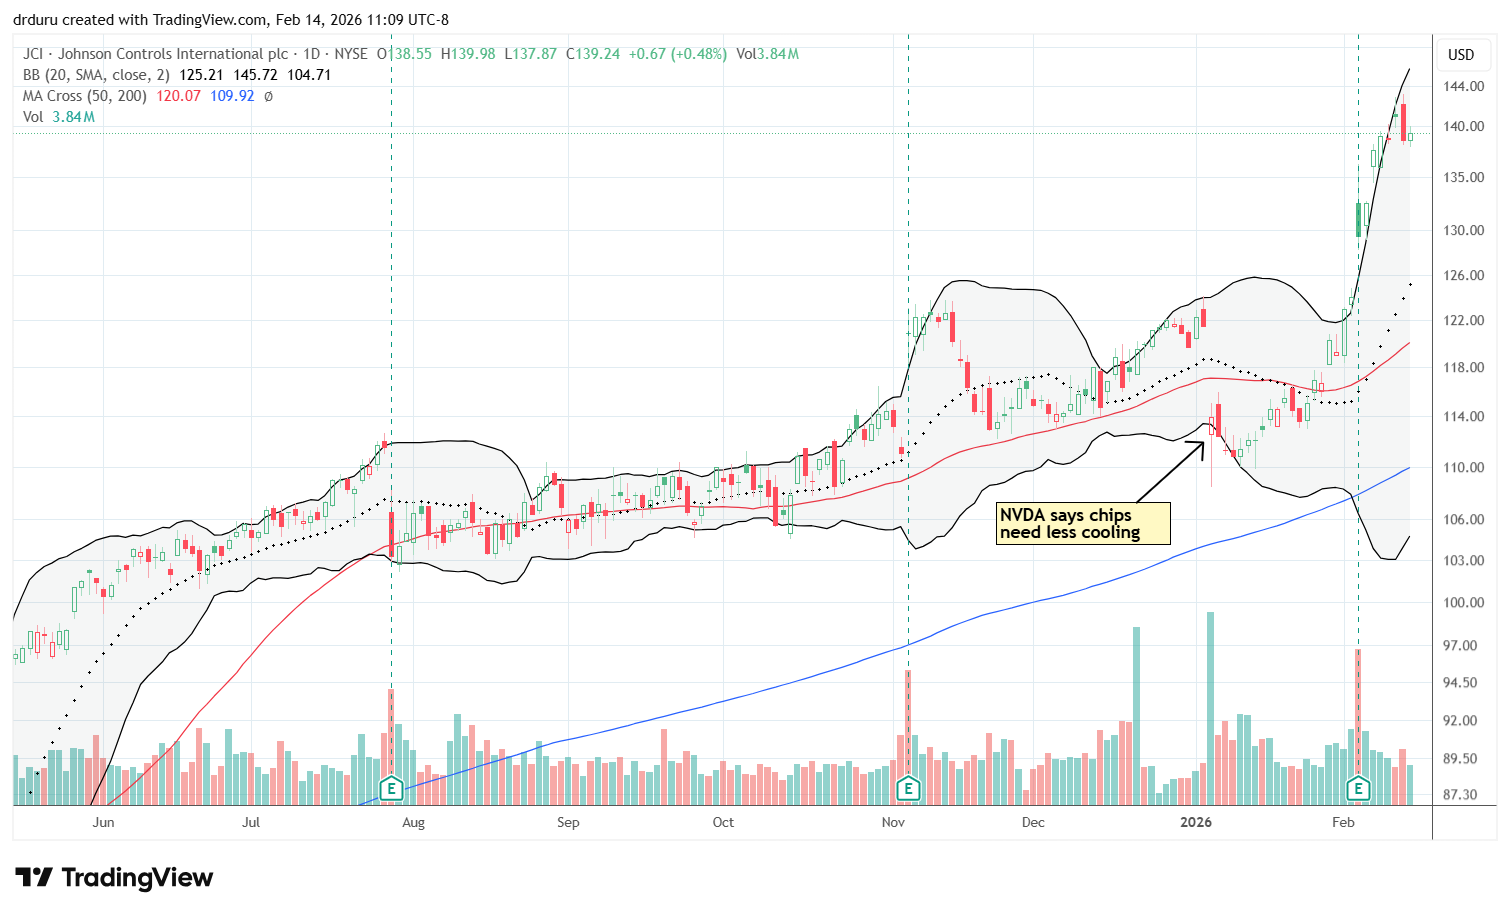
Technical status: Johnson Controls (JCI) recovered quickly from an NVDA cooling panic. A 4.4% post-earnings jump helped the stock rally straight up to all-time highs.
Trade commentary: JCI was part of a pairs trade born from a panic about NVDA rolling out chips requiring less cooling. I exited the pairs trade after making money on the short side (see below), but I failed to benefit from the JCI rally. Looking back, I see my analysis was misdirected by the assumption that NVDA’s news had created some fundamental change in the business. Like so many other panics, such assessments turned out to be premature. The transcript from the earnings call makes it clear that JCI’s business in data centers, including with NVDA, is fine:
“Against that backdrop, our data center momentum reflects, not only strong demand from existing customers, but also success in reaching new customers as our differentiated solutions gain traction. We continue to work closely with NVIDIA, applying our thermal management and controls expertise to support next-generation AI compute environments. Johnson Controls recently released a new reference guide that maps the full thermal chain and outlines scalable high-performance cooling architectures for an emerging class of AI factories. The guide outlines an integrated solution that leverages technology to accelerate data center deployment and increase their overall performance.”
JCI is a buy-the-dip from here. I prefer to enter on a test of 20DMA support.
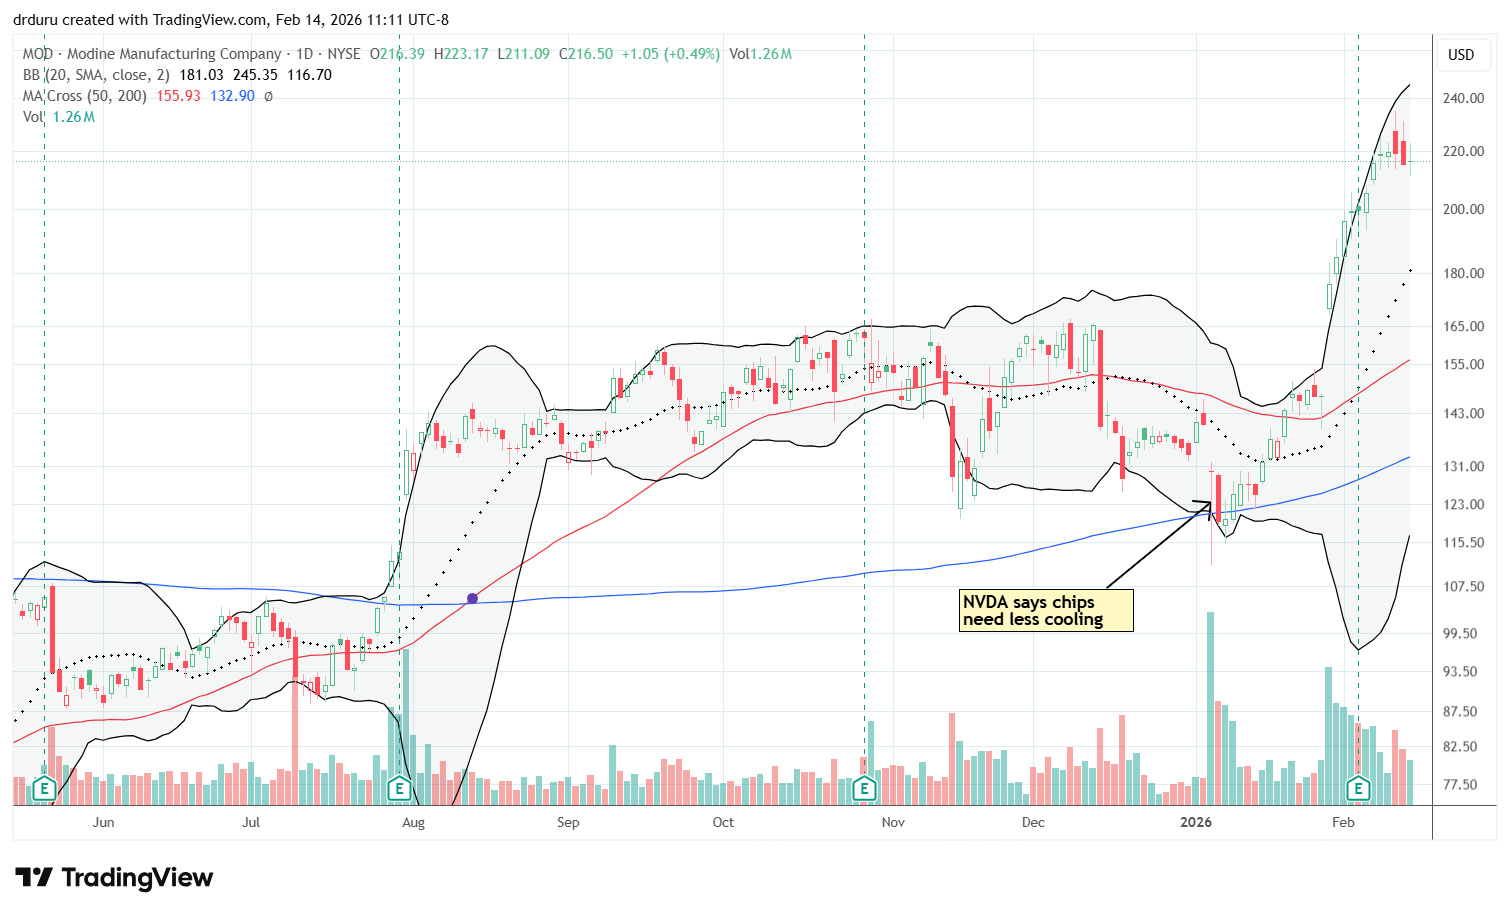
Modine Manufacturing Company (MOD)
Description: Modine manufactures thermal management and heat transfer products used across industrial and commercial applications.
Technical status: Modine Manufacturing Company (MOD) recovered quickly from an NVDA cooling panic. A strong rally into earnings continued post-earnings.
Trade commentary: MOD was the short side of the pairs trade on the cooling narrative. MOD recovered from the cooling panic very quickly and performed even better than JCI. I had the narrative reversed because I thought MOD was going to suffer the most. MOD’s recovery and rebound was so strong that buyers rushed in ahead of earnings. While the immediate response to earnings was muted, the rally soon resumed. MOD is a buy-the-dip like JCI with a preferred entry at 20DMA support.
I will soon publish a new article explaining what I got wrong and a corrected narrative about the business economics of cooling data centers. MOD did not even mention NVIDIA directly in its earnings call and analysts did not ask about NVIDIA’s chips.
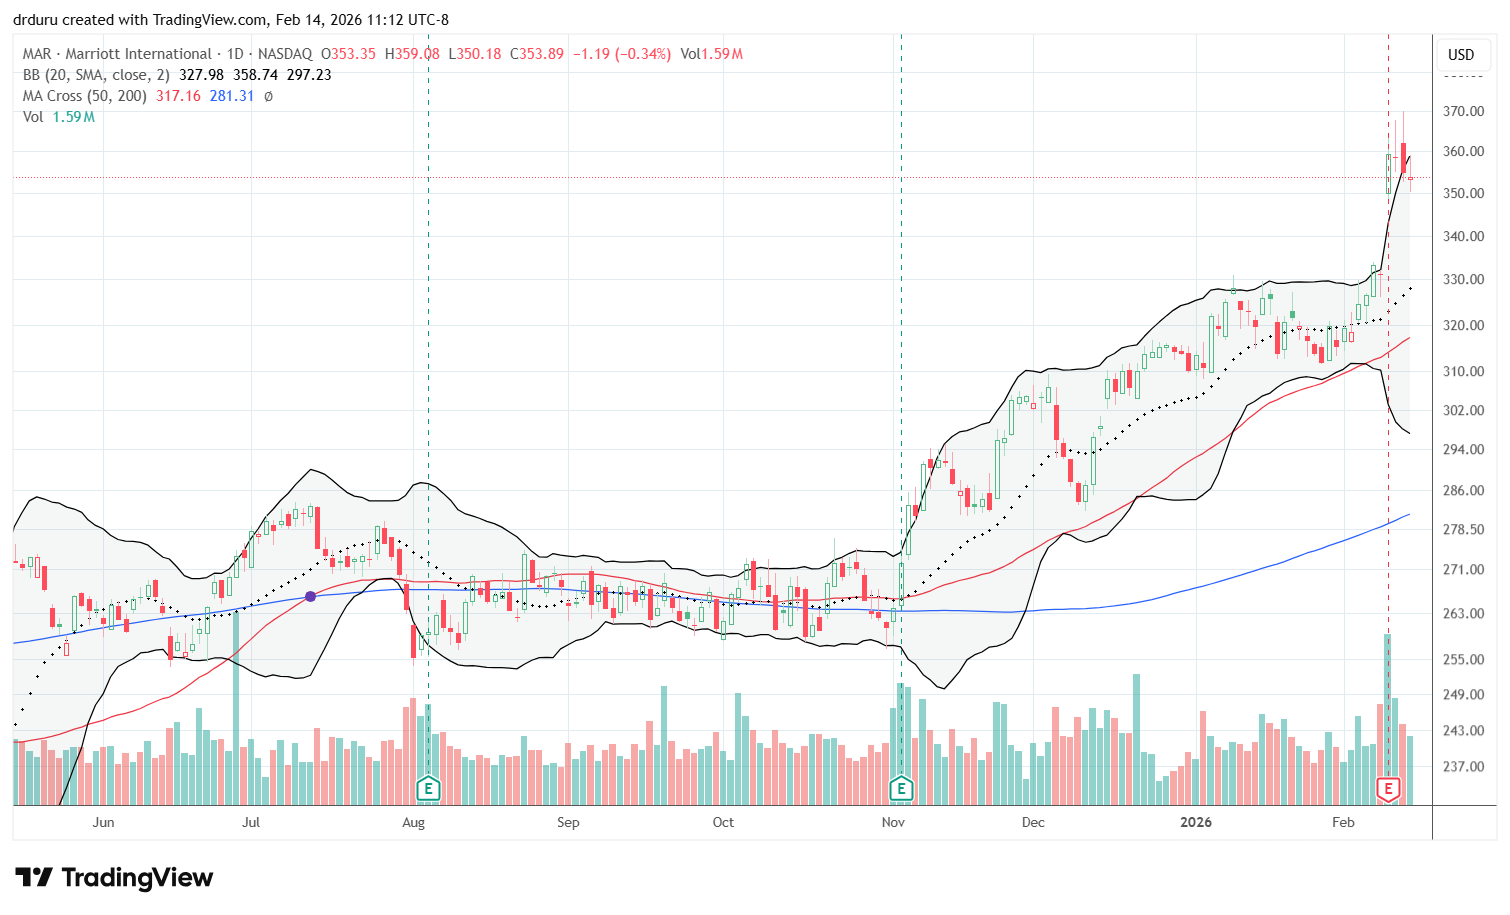
Marriott International (MAR)
Description: Marriott International operates a global portfolio of hotel and lodging brands.
Technical status: Marriott International (MAR) surged to an all-time high after an 8.5% post-earnings gain.
Trade commentary: MAR surprised me by soaring 8.5% post earnings and reaching an all-time high. Even with the supposed K-shaped economy, I did not think Marriott as a beneficiary of the part of the economy that continues to spend happily. MAR represents a great example of a divergent market with certain non-tech stocks outperforming even has market breadth declines and remains bearish.
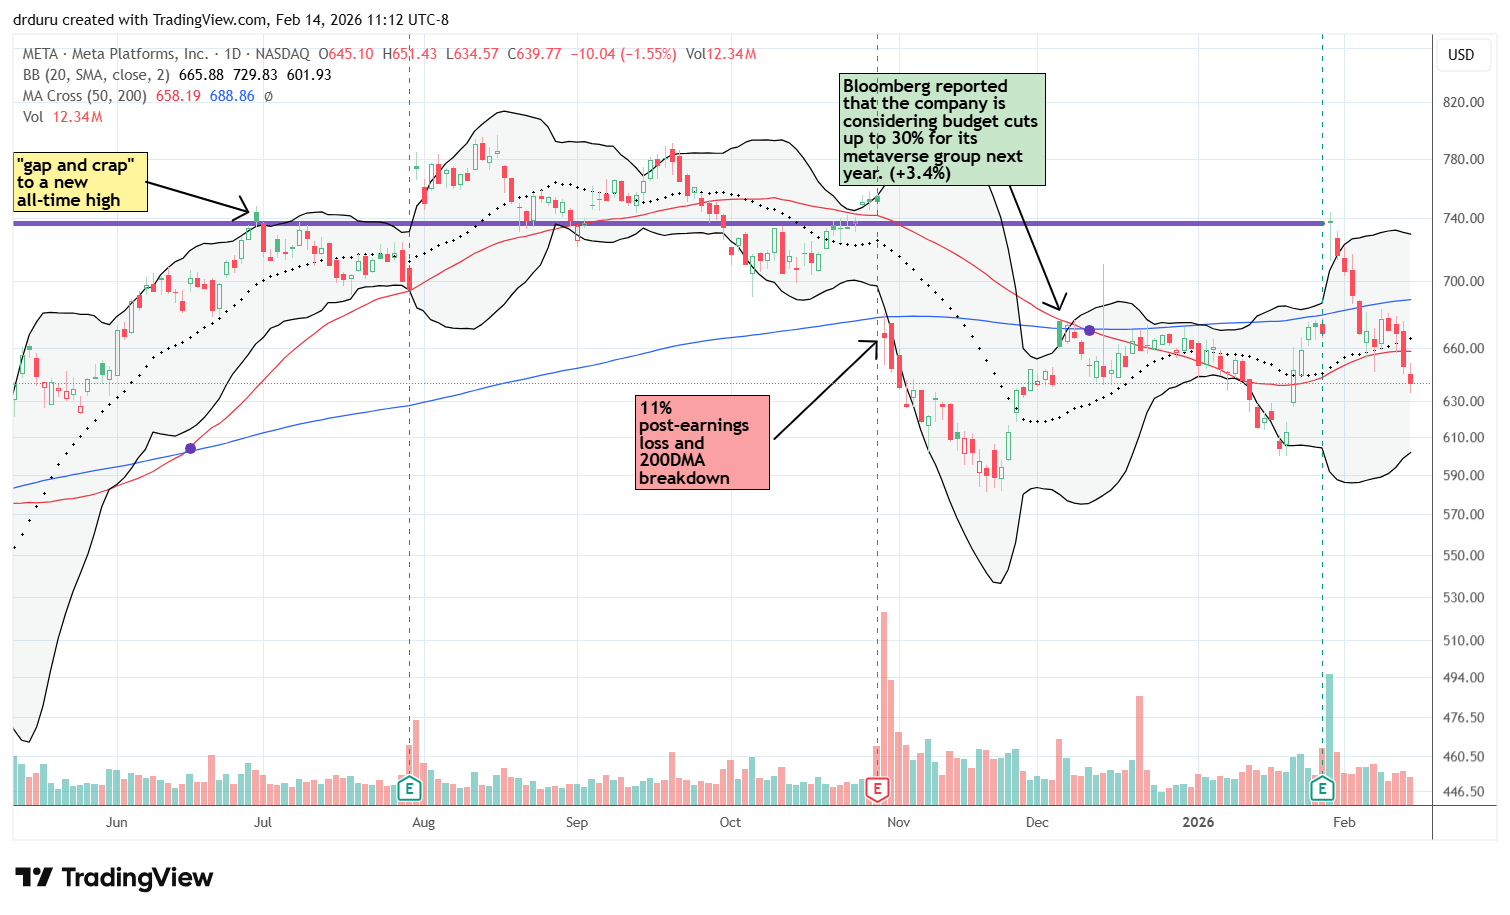
Meta Platforms (META)
Description: Meta Platforms operates social media and digital advertising platforms and related technologies.
Technical status: Meta Platforms (META) confirmed a 50DMA breakdown and returned to bearish territory. The stock has been rangebound for about 17 months.
Trade commentary: META is thrashing under the cloud of a topping pattern. META gapped up and gained 10.4% post-earnings, a total surprise to me. I thought the stall at 200DMA resistance would end the last rebound. The sellers are back with a fresh confirmed 50DMA breakdown. If I were to trade META, I would be bearish with an expectation that META would retest the January low around $605. Note that META topped out last August.
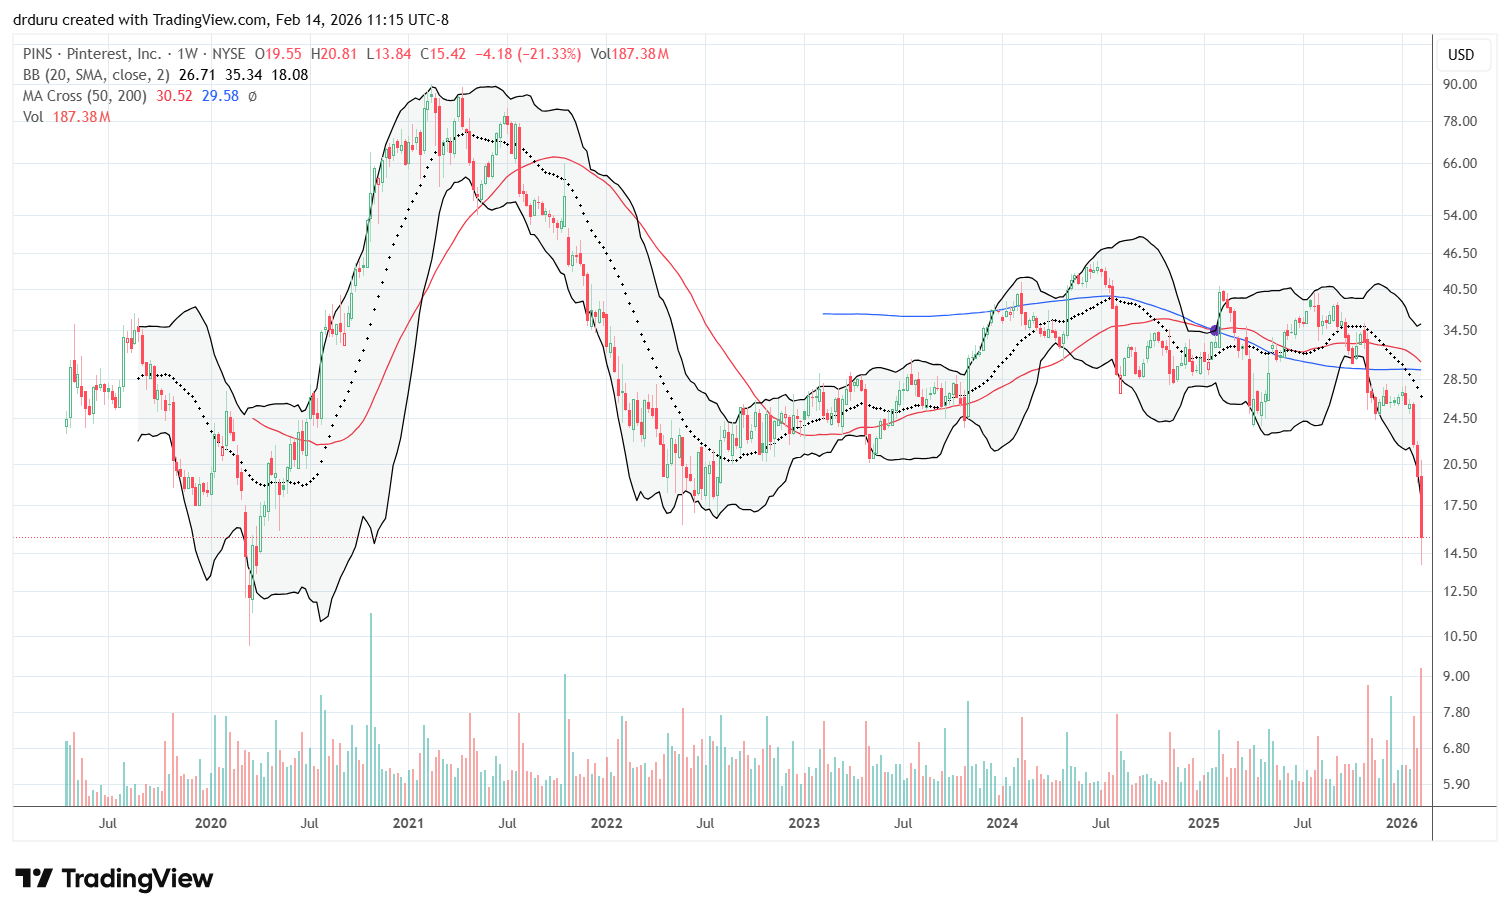
Pinterest (PINS)
Description: Pinterest operates a visual discovery and social platform for finding and sharing ideas.
Technical status: Pinterest (PINS) collapsed 16.8% post-earnings and returned to levels near early pandemic-era trading. The stock broke down from a long consolidation period.
Trade commentary: Coming out of the bear market, PINS had a decent run but fell far short of its all-time high near $90. PINS struggled, consolidated for a long time, and now the recovery narrative has come to a crashing end. I want to keep an eye on PINS in case someone eventually buys out the property for the user growth.
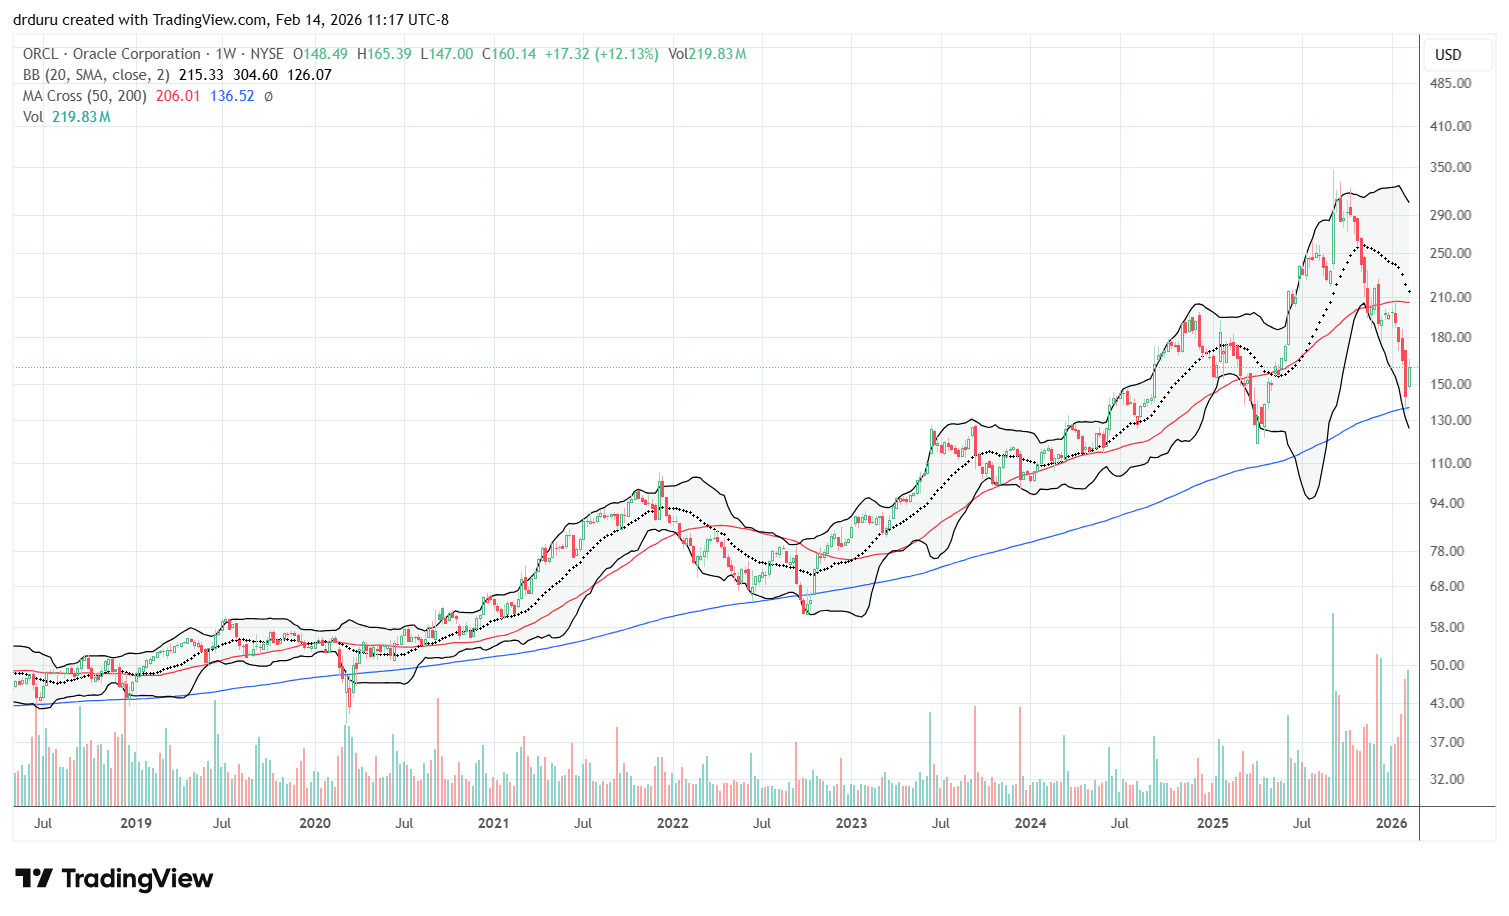
Oracle Corporation (ORCL)
Description: Oracle provides enterprise software, cloud services, and database technologies.
Technical status: On a daily basis, Oracle Corporation (ORCL) remains bearish below all its moving averages. The stock recently rebounded off short-term, and, even more importantly, a monthly uptrend support line.
Trade commentary: ORCL led the way in the AI-driven panic in software stocks. ORCL soared 36% post earnings because of expected revenues. After the market absorbed the implication of OpenAI dominating the promised revenue, ORCL weakened and soon sold off. ORCL has not been the same since, as if they never should have done the mega deal.
ORCL finally found strong technical support, both short-term and long-term. However, I am staying away from ORCL because of the bearish NASDAQ. Once the negativity gets repaired, ORCL should soar again. For now, I do not see a good risk/reward entry unless the stock fades back to long-term support.
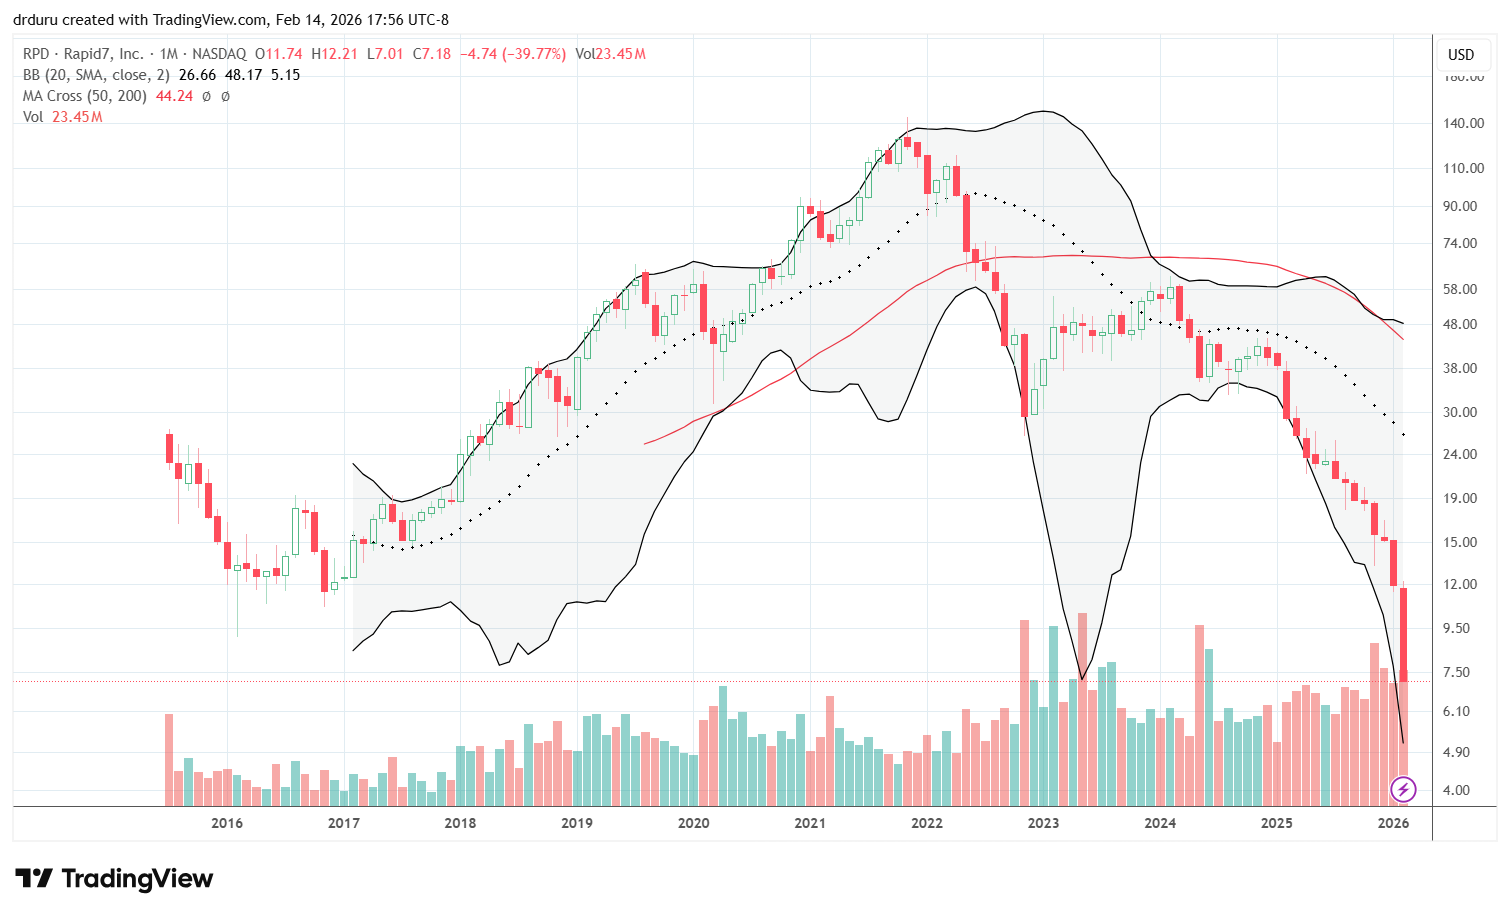
Rapid7 (RPD)
Description: Rapid7 provides cybersecurity software and services focused on threat detection, analytics, and vulnerability management.
Technical status: Rapid7 (RPD) crashed to an all-time low after a 29.0% post-earnings plunge as part of an on-going, severe downtrend.
Trade commentary: I followed RPD for a long time because I thought RPD was an undervalued, underappreciated cybersecurity stock. Yet, the stock kept trading lower and lower in a persistent downtrend. After this post-earnings crash, I am wondering whether the stock will ever be investable. RPD could be a speculative swing trade on a close above $8 which is the post-earnings intraday high. The stock’s valuation metrics are all at rock bottom levels, so if there is any merit to the company’s business prospects some kind of recovery should happen from here.
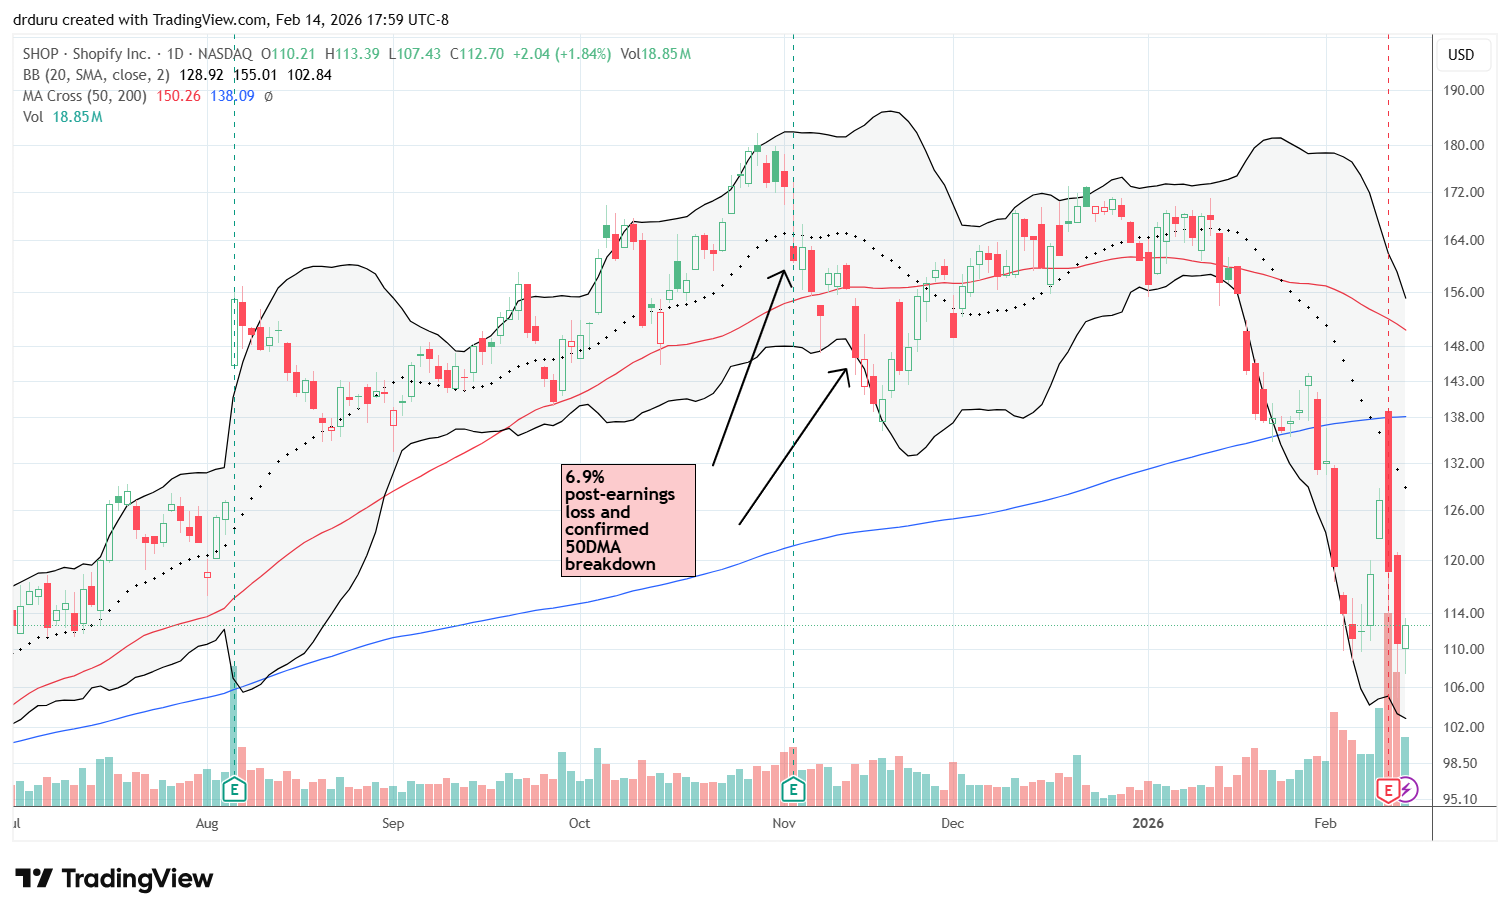
Shopify (SHOP)
Description: Shopify provides e-commerce platform software and services for merchants to build and run online stores.
Technical status: Shopify (SHOP) broke below its 200DMA and traded in bearish territory with chaotic price action including a post-earnings fade from 200DMA resistance.
Trade commentary: It seems SHOP is caught up in the AI panic trade over software. I am highly skeptical that someone will prompt their way into building a fully scaled e-commerce platform or even their own secure shopping site. Moreover, Shopify authorized a new $2B share buyback program. I want to be on the receiving end of such a show of confidence. I started with a March 125/135 call spread after SHOP fell close to the previous February low.
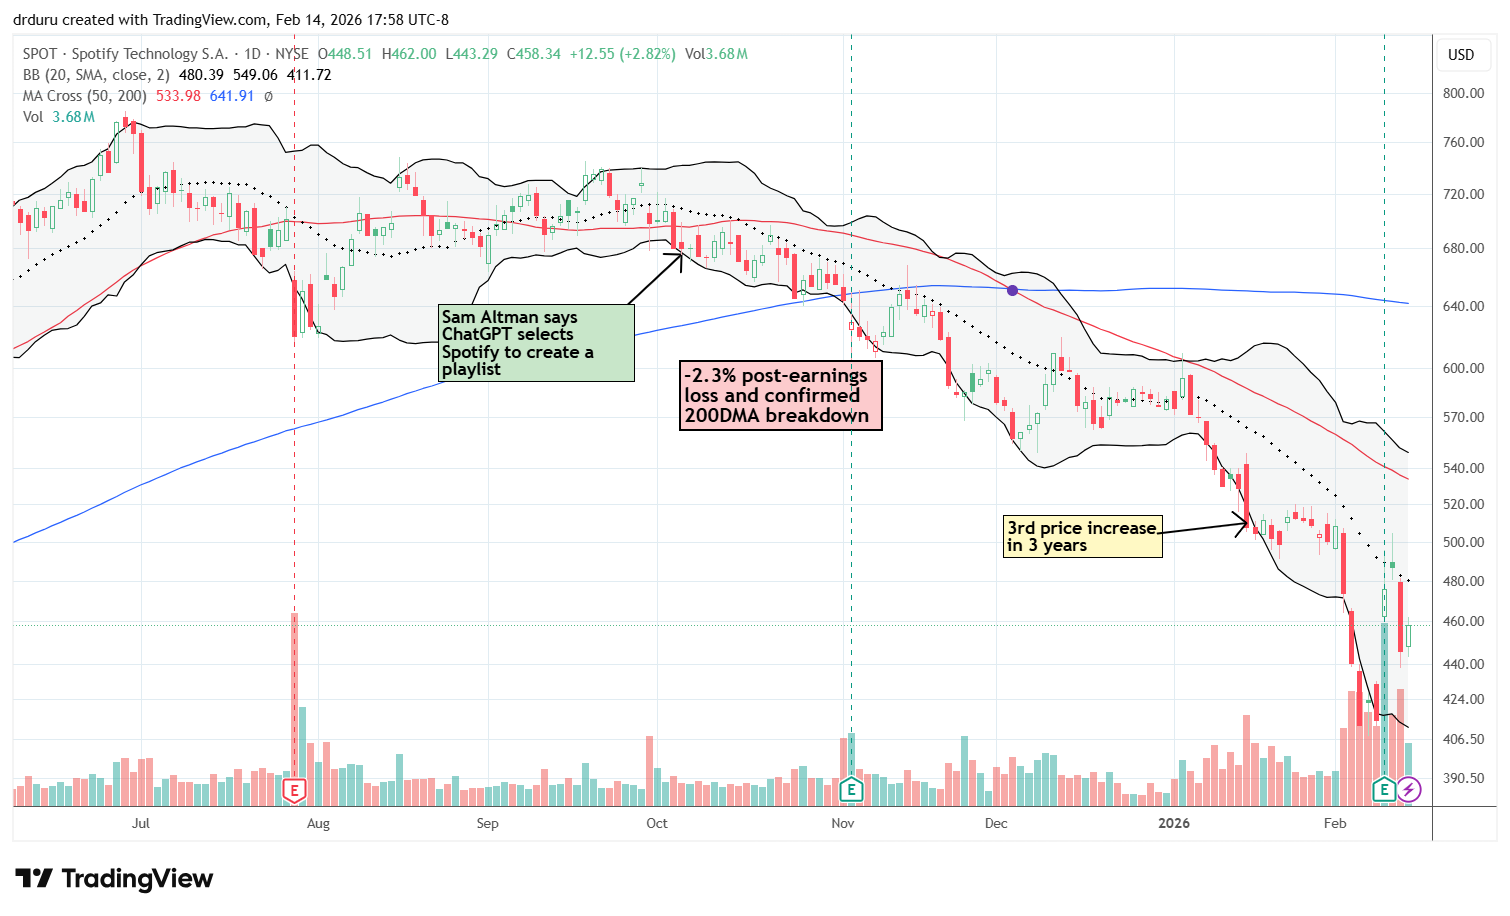
Spotify (SPOT)
Description: Spotify operates a music and audio streaming platform offering subscriptions and ad-supported listening.
Technical status: After declining to a 15-month low, Spotify (SPOT) jumped 14.8% post-earnings. However, 20DMA resistance knocked the stock backward by 8.5%.
Trade commentary: Bearish technical signals took me out of SPOT back in November. The stock has trended downward ever since. That downtrend remains in place with 20DMA resistance despite the impressive post-earnings bounce. The stock remains a no-touch for me until some kind of stabilization/consolidation creates a tradeable low.
Unity Software (U)
Description: Unity provides a software platform for creating and running interactive content, including video games.
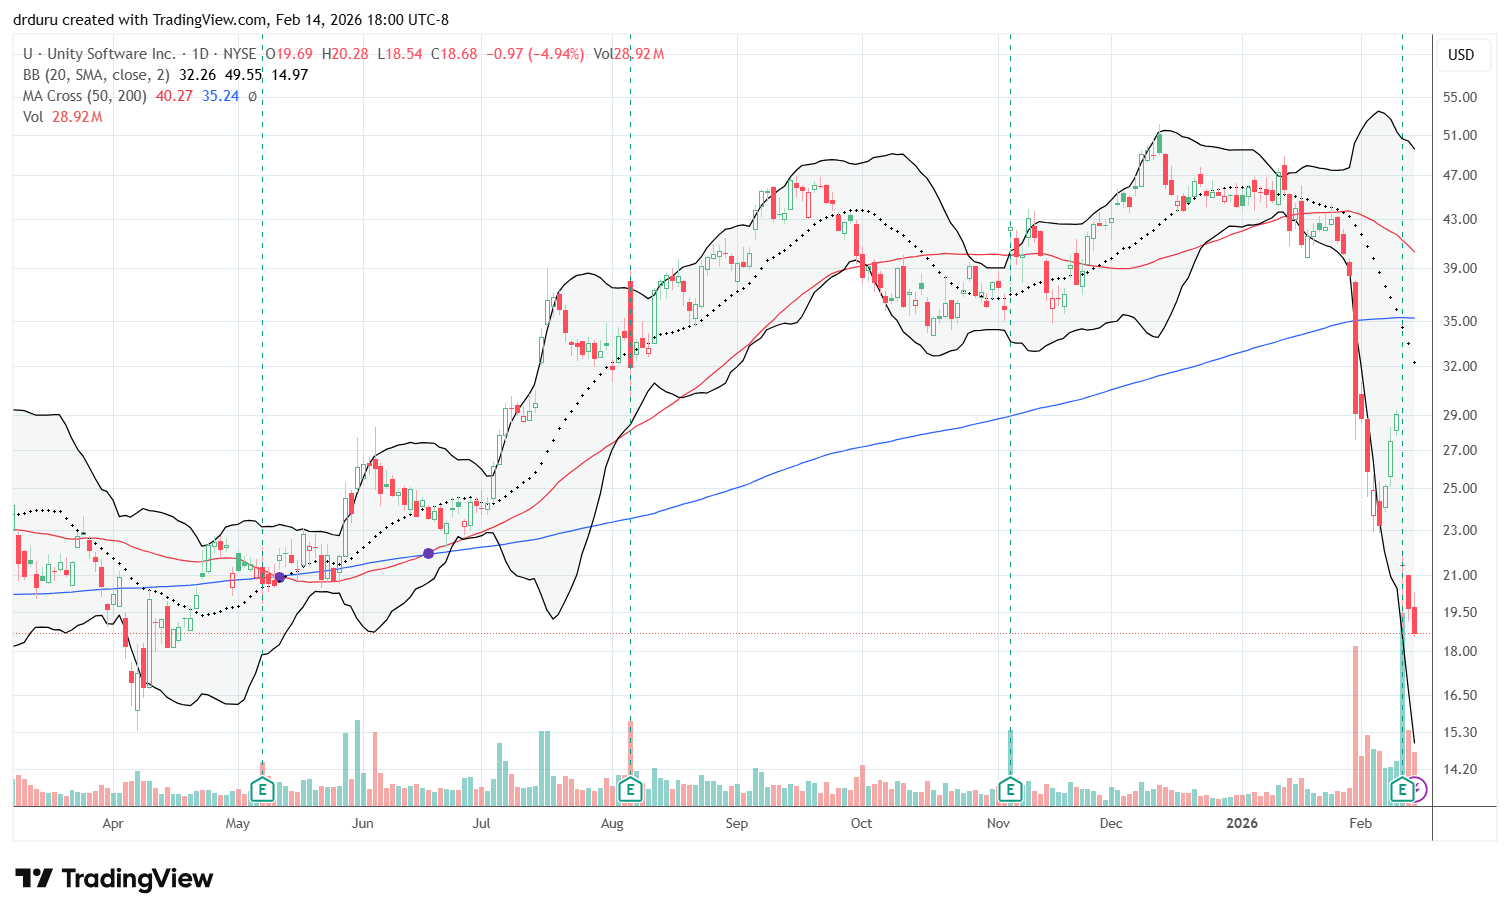
Technical status: Unity Software (U) crashed 26.3% post-earnings, a move exaggerated by a dead-cat bounce going into earnings. Sellers closed U’s week at levels last seen in April.
Trade commentary: U has been thrashing on a path to nowhere for almost 4 years. The AI Panic of 2026 ended the stock’s latest attempt to breakout above its trading range. I am keeping an eye on U since its video gaming platform remains very popular (I checked in with my teenage son). The company also said encouraging things about AI on its earnings conference call like:
“We are displacing commoditized lower-margin ad network revenue for deeply differentiated AI platform revenue. The success we’re seeing in our advertising business has been mirrored by the return to growth of our software business, where the fourth quarter of 2025 showcased the fastest year-over-year growth in Create in more than 2 years…As we increasingly integrate Unity AI into the creation process, Unity will become easier to use, which will draw more customers into the world of interactive content creation than ever before. This explosion of new assets types, new creators and new games will also drive our advertising business.”
As with most post-earnings plunges, I will get interested in buying on a close above the post-earnings intraday high. For U that buy point is above $22.10. The all-time low is $14.01.
Uber (UBER)
Description: Uber operates a platform for ride-hailing, deliveries, and related mobility services.
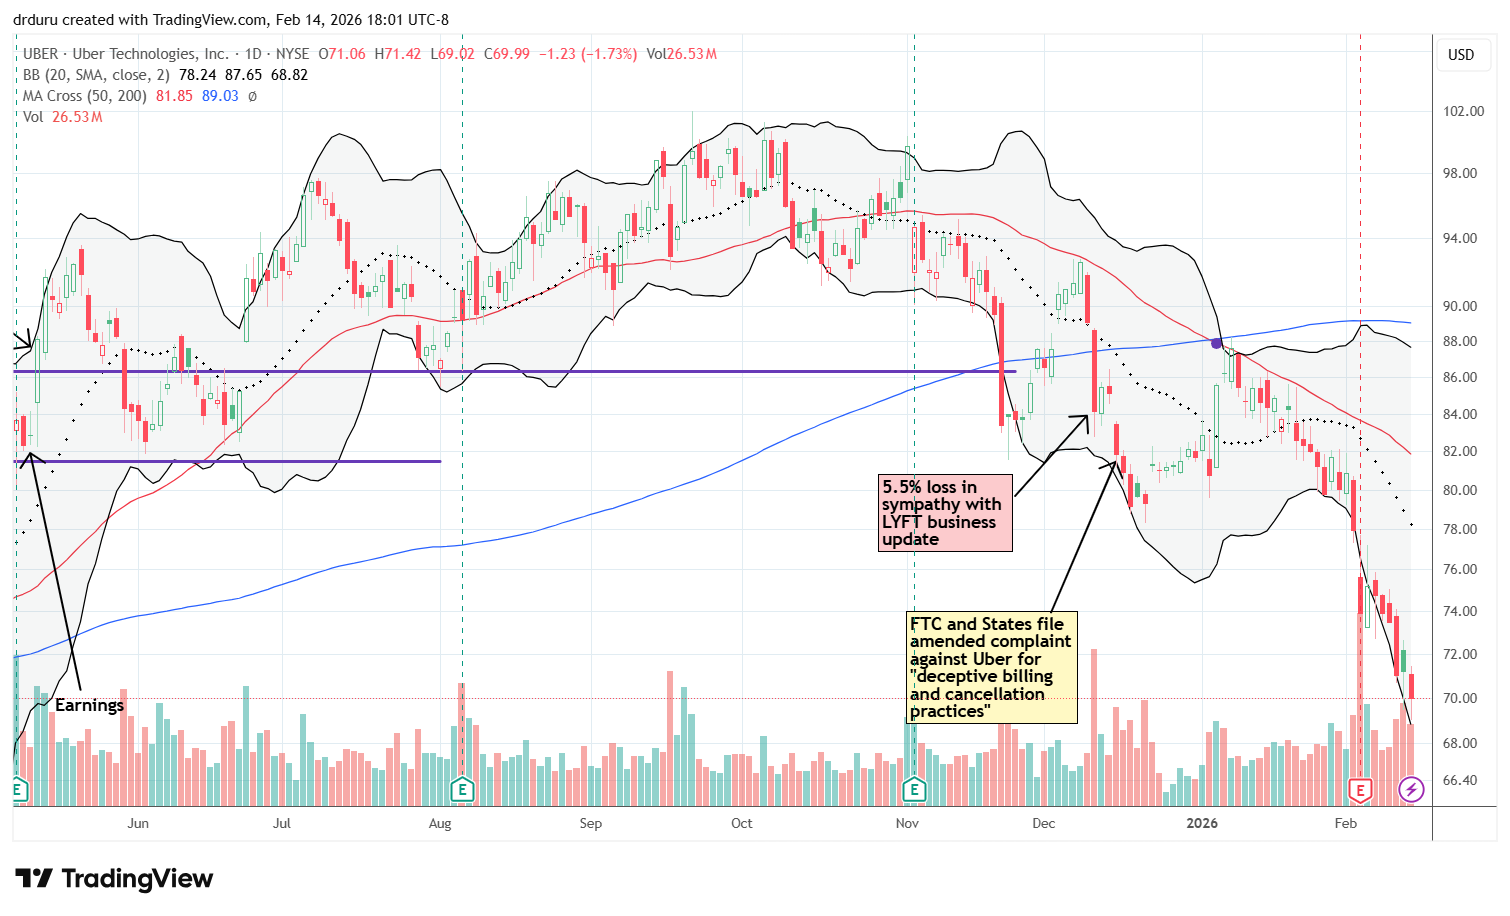
Technical status: UBER stayed in a steep downtrend and remained under heavy moving average resistance after a post-earnings gap loss of 5.5%. The stock is back to levels last seen in April.
Trade commentary: I invested in UBER and insisted I was going to stick with UBER for the long term, but bearish technicals forced me out. Once again, the technicals proved prescient. The trading narrative on UBER has quickly flipped from bullish to bearish. With a major top in place, I have little interest in jumping back into UBER anytime soon.
Upwork (UPWK)
Description: Upwork operates an online marketplace connecting freelancers with clients for project-based work.
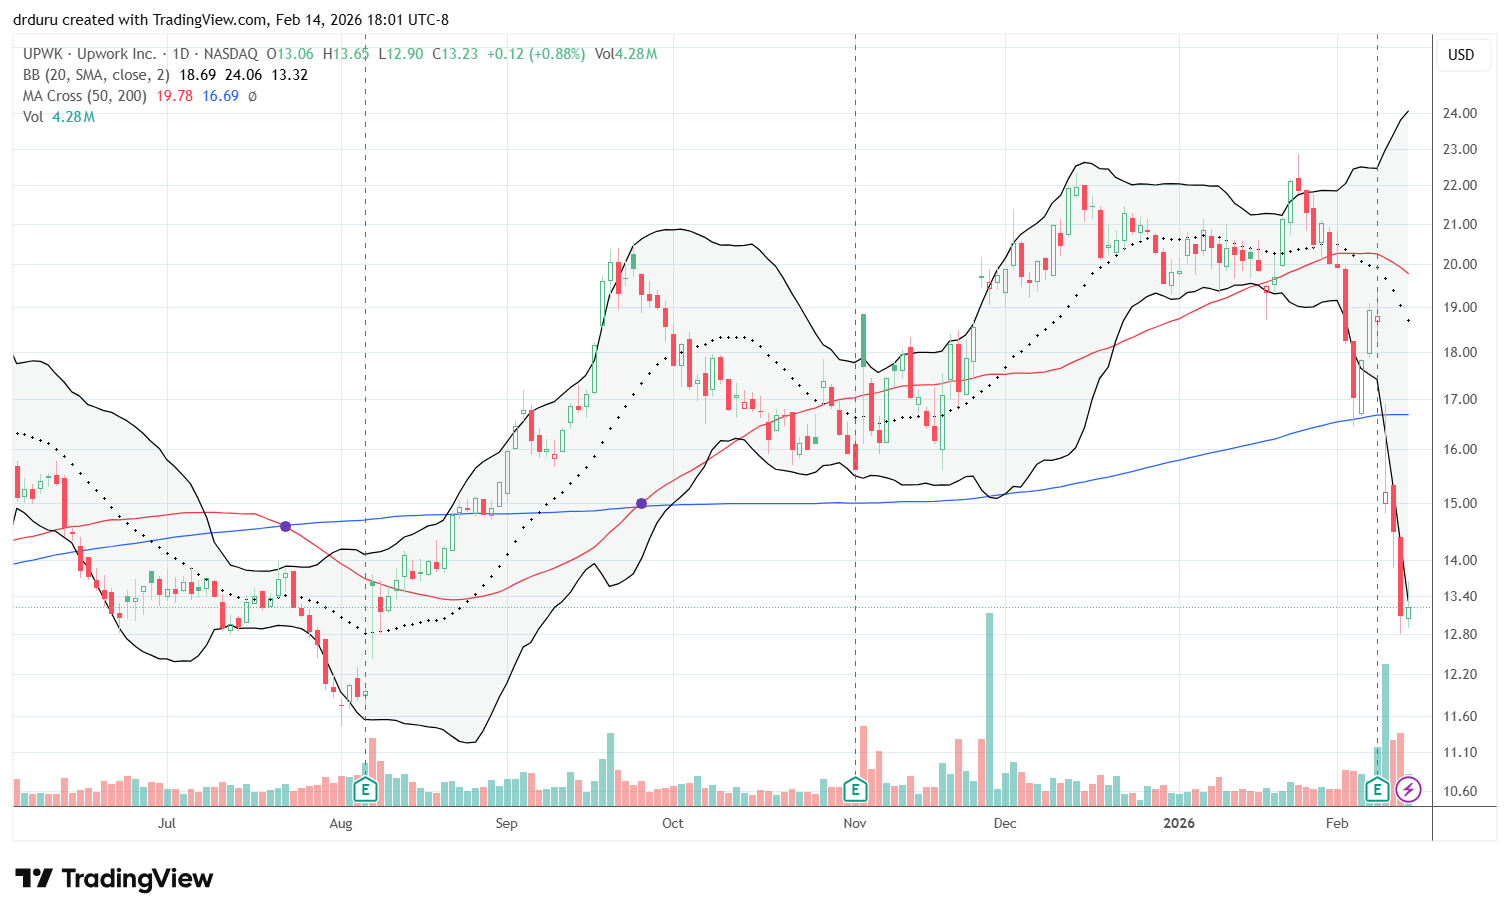
Technical status: Upwork (UPWK) crashed 19.1 post earnings and is back into bearish position below its 200DMA. and stayed in bearish position well below the 200DMA. Besides a brief bubble in 2021, UPWK has essentially gone nowhere since its IPO.
Trade commentary: I have watched UPWK more than I have traded it. Like more and more stocks in this thrashing, fragmenting market, I am ready to give up on UPWK. As a consultant, I like to keep up with Upwork’s freelance business. Yet, I have never used it except to review candidates for a current client. The earnings conference call was full of references to the benefits of AI to Upwork’s business, for example (GSV is gross services volume):
“In Q4, we embedded more AI functionality in the Marketplace that helped clients and talent work together more easily, generated more than 50% GSV growth from AI-related work on the platform and laid the foundation to integrate agents to deliver work outcomes. With respect to Upwork’s AI native Marketplace, we continue to advance our search and recommendation functionality and Uma, Upwork’s AI agent to help clients hire faster and more effectively. In total, we estimate that these improvements contributed $100 million in incremental GSV in 2025.”
However, AI-related work remains a small fraction of UPWK’s total work done in its Marketplace. In telling fashion, revenue growth expectations for this year remain anemic: “For the full year 2026, we continue to expect GSV growth in the range of 4% to 6% and revenue growth in the range of 6% to 8% or between $835 million to $850 million.” UPWK looks like a stock that will keep thrashing for some time to come.
Workday (WDAY)
Description: Workday provides enterprise cloud software for human resources, finance, and planning functions.
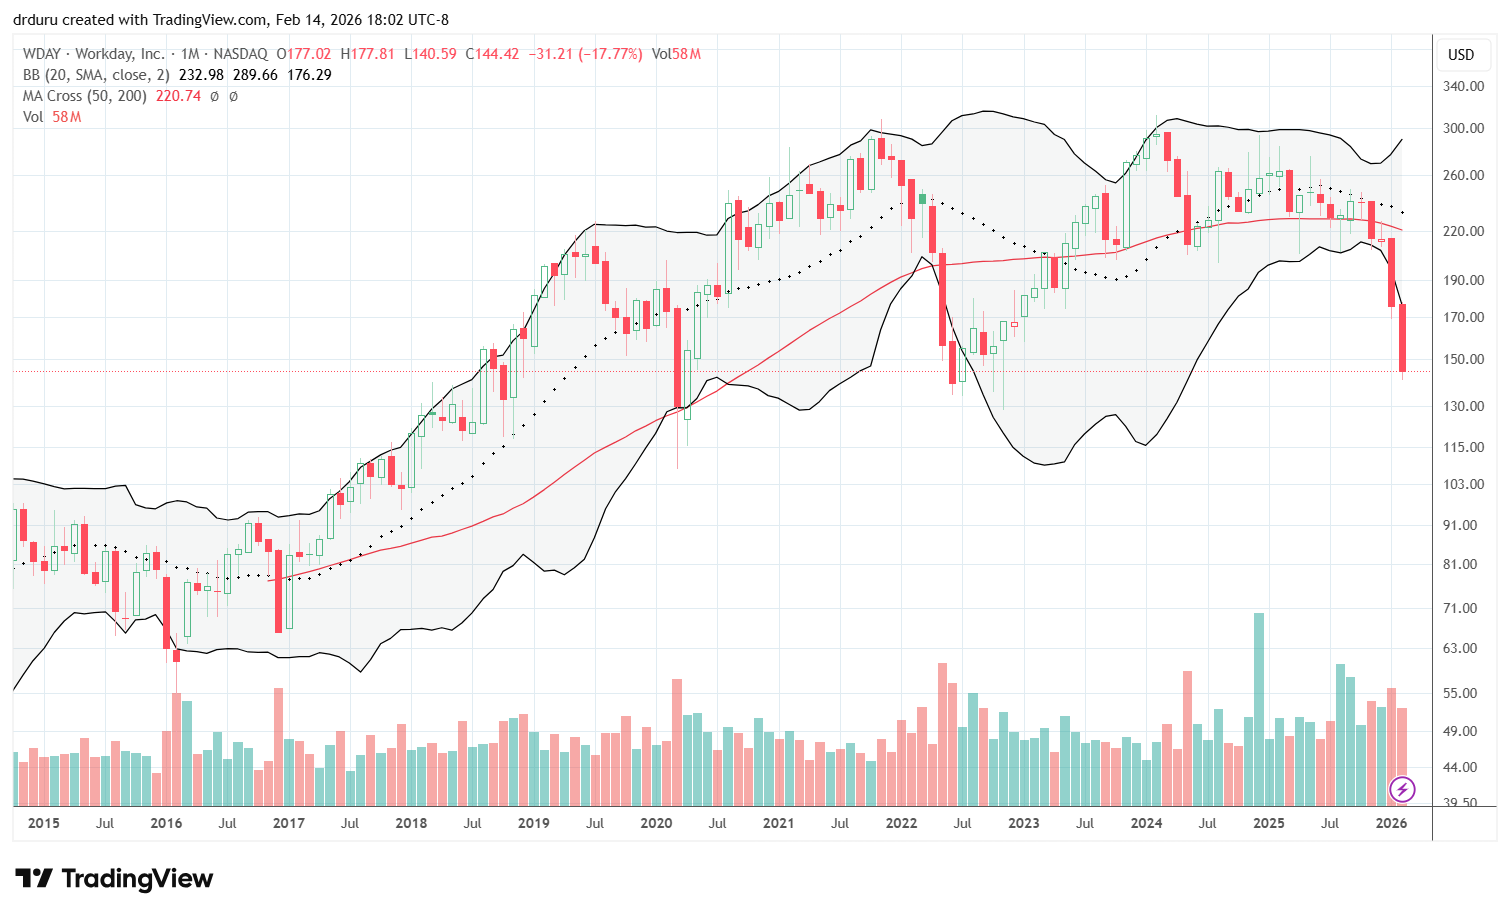
Technical status: WDAY stayed under strong downside momentum with little relief and traded back near bear market lows. The stock remains under pressure ahead of earnings.
Trade commentary: WDAY has suffered a 32.8% year-to-date loss thanks to the AI Panic. Are traders and investors afraid a company will vibe code their way into a secure, regulatory-compliant HR platform? I eagerly await what WDAY has to say in its upcoming earnings report. Since WDAY started the year with a 7.8% post-earnings, I am bracing for a large post-earnings drawdown.
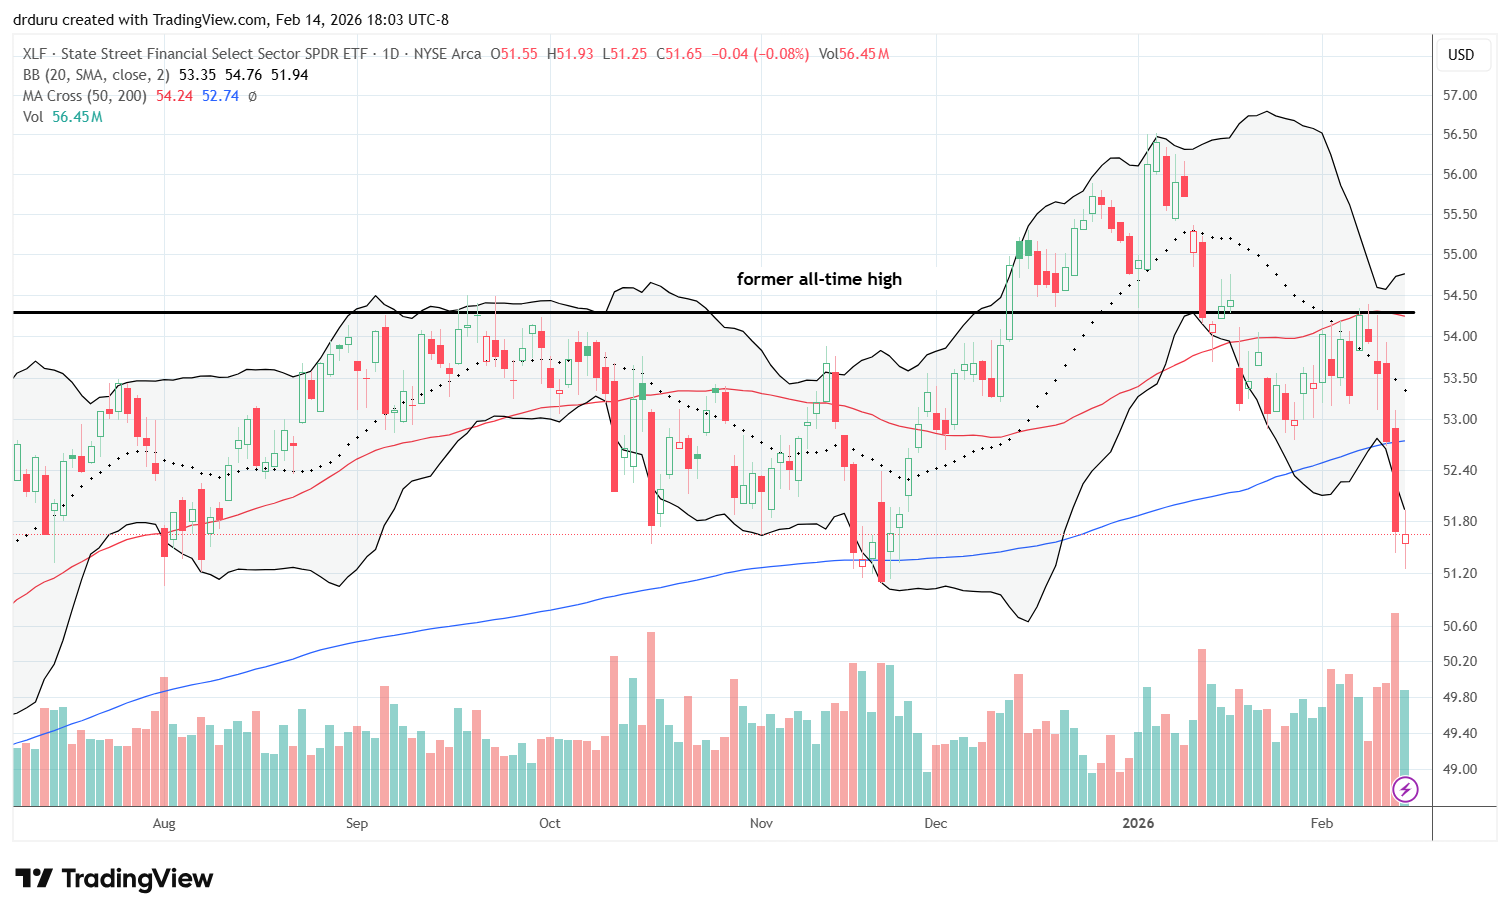
Financial Select Sector SPDR Fund (XLF)
Description: XLF is an exchange-traded fund that tracks a basket of large U.S. financial sector companies.
Technical status: XLF moved into bearish territory with a confirmed 200DMA breakdown. The uptrend looked barely intact and financials appeared to be losing steam.
Trade commentary: Earlier, I said it is hard to be bearish when financials are bullish. Soon after that, XLF broke down. Now I find it impossible to be bullish with financials in bearish position with a confirmed 200DMA breakdown. XLF failed in picture-perfect fashion right at converged resistance from its 50DMA and the former all-time high.
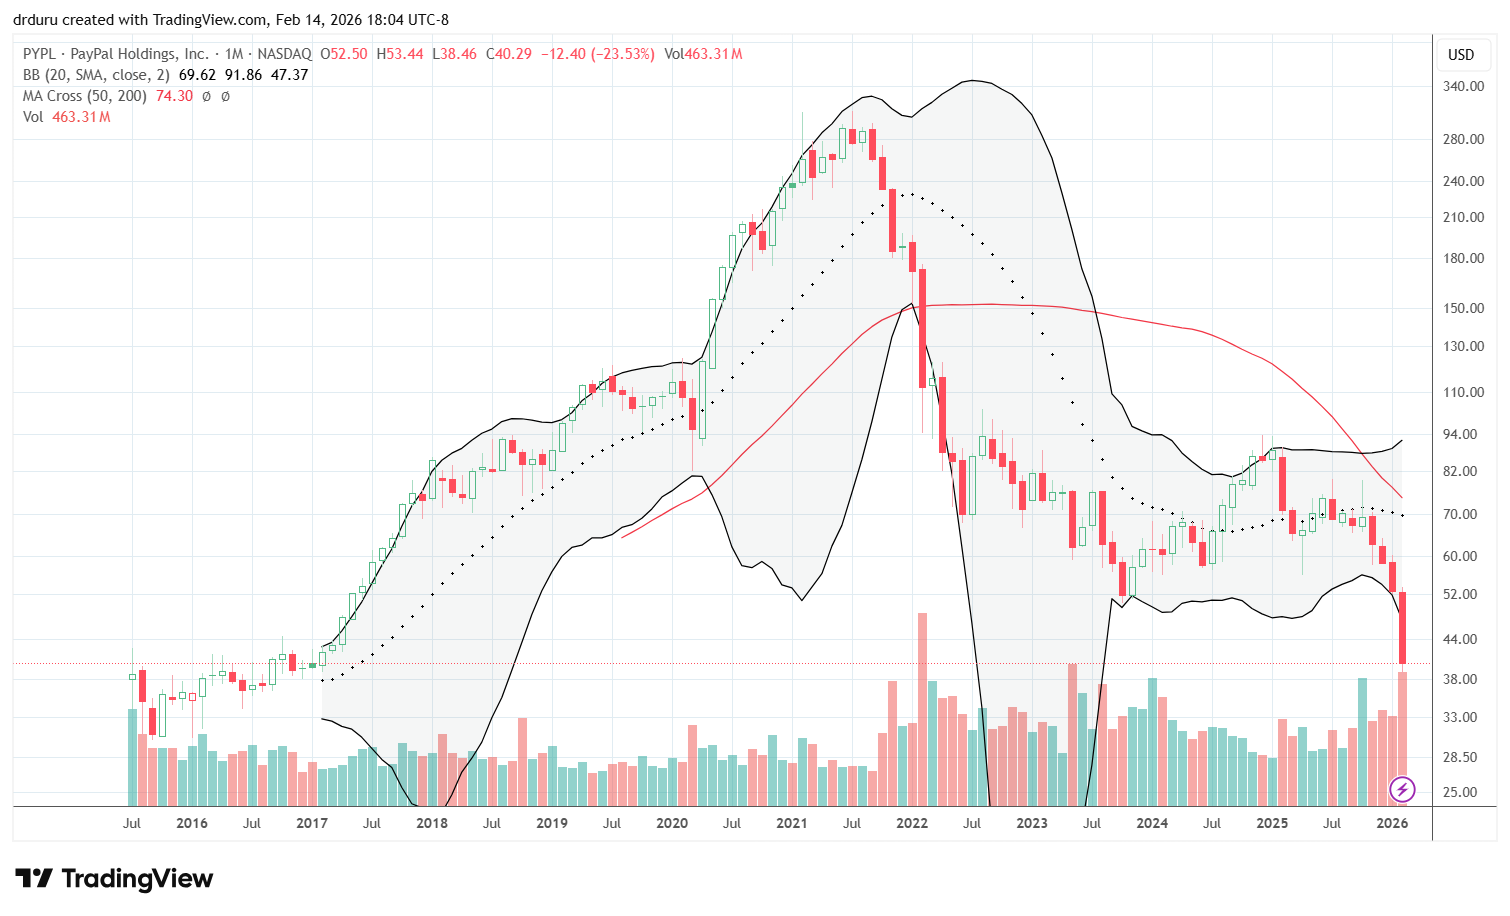
PayPal (PYPL)
Description: PayPal provides digital payments services and platforms for online transactions and money transfers.
Technical status: PayPal (PYPL) collapsed 20.3% post-earnings earlier this month. The monthly chart shows a near 90% crash from all-time highs that has nearly taken the stock to an all-time low.
Trade commentary: The demise of PayPal’s stock has been long in the making. Along the way, I have had several cases arguing the stock is a bargain. The stock looked like it was consolidating from 2022 to 2025. Bullish behavior in 2024 fooled me into hanging on further in the stock. I took my lumps last year and apparently just in time. This year has been a breakdown year for PYPL. The stock is yet another reminder of why investors should not fall in love with individual stocks. PYPL never recovered from the bursting of its pandemic bubble and now looks uninvestible. PayPal is losing a battle among fintechs.
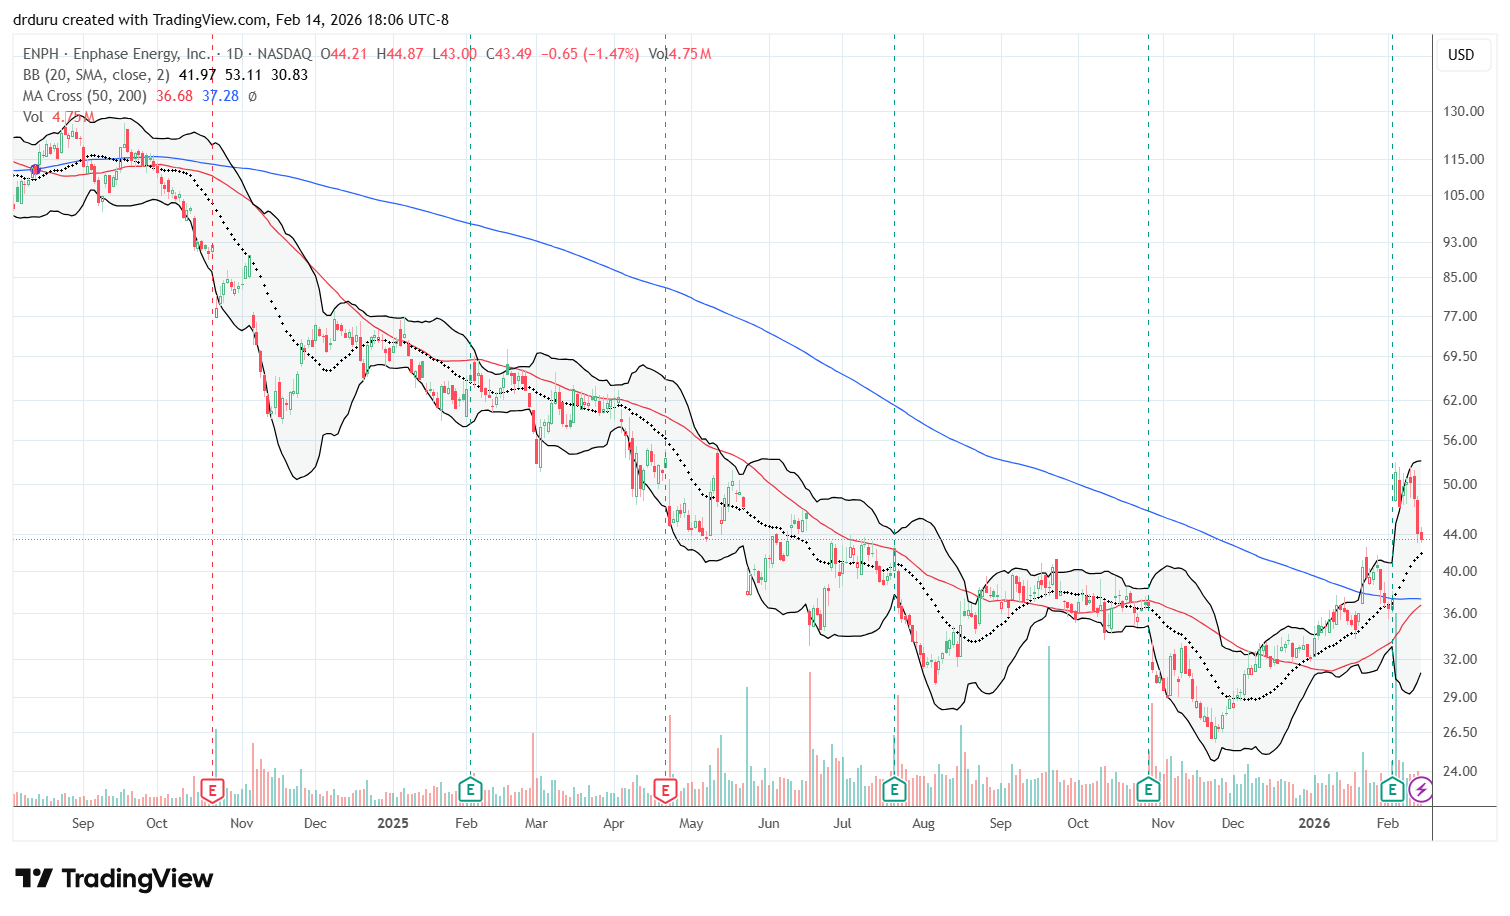
Enphase Energy (ENPH)
Description: Enphase designs and sells solar energy and home energy management products, including microinverters and related systems.
Technical status: Enphase Energy Inc (ENPH) sprung to life earlier this month with a 38.6% post-earnings surge and fresh 200DMA breakout. The stock has lost momentum since then and looks ready to test 20DMA support.
Trade commentary: It seems First Solar (FSLR) has passed the solar baton to ENPH. A second 200DMA breakout firms up the bullish case for the stock. With momentum stopping cold after the post-earnings surge, I am looking to buy the stock at uptrending 20DMA support. If the faders push through that support, I will buy more at stronger support with converged 200 and 50DMAs.
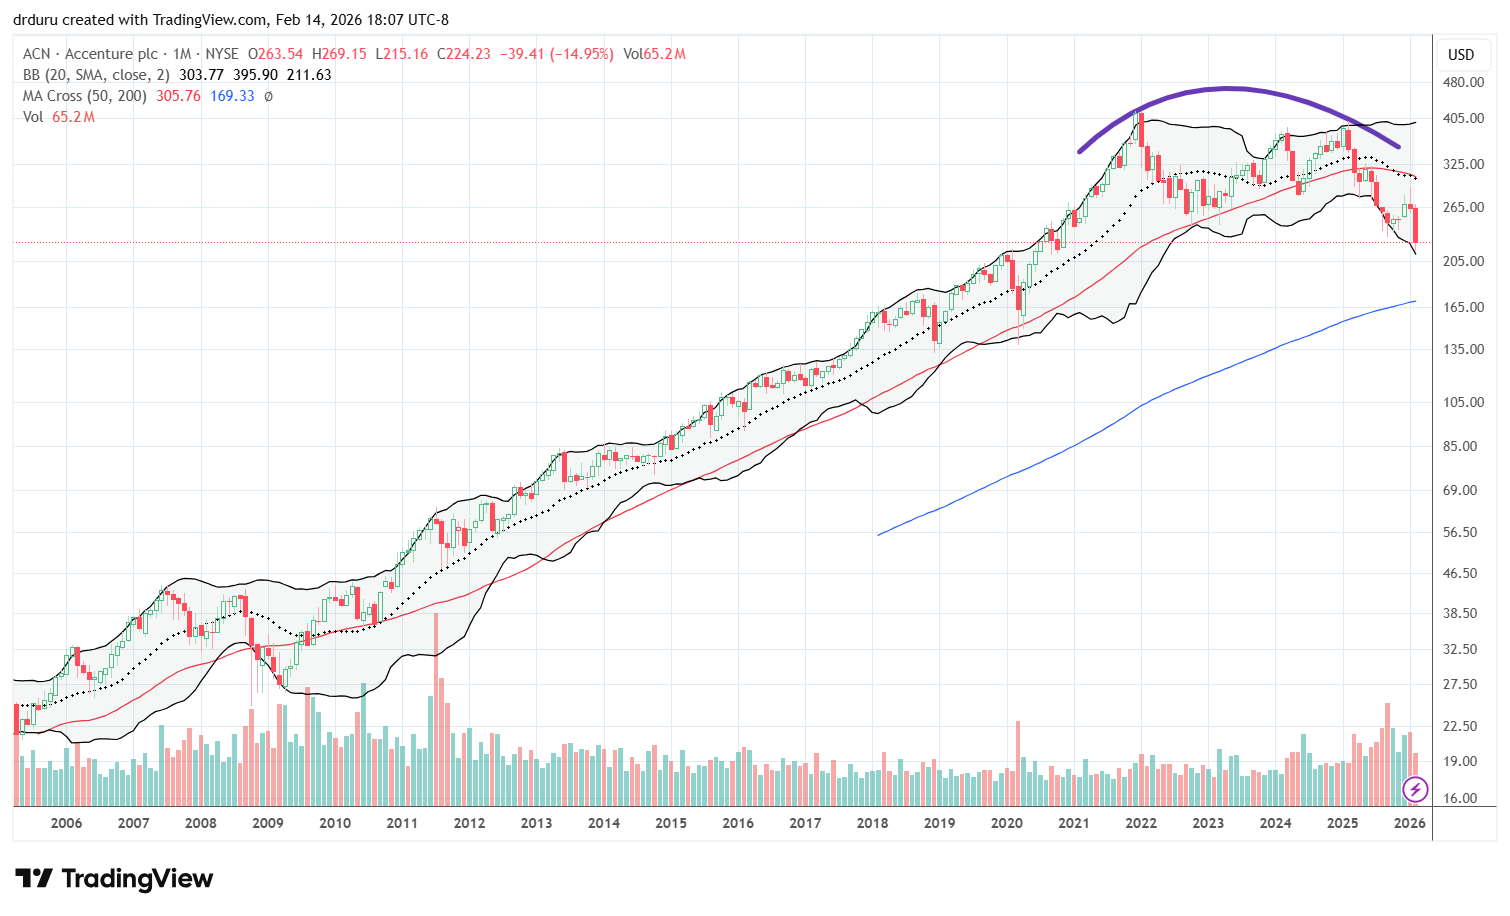
Accenture (ACN)
Description: Accenture provides consulting, technology, and business services to enterprises, including work related to generative AI.
Technical status: After confirming a 50DMA breakdown with a 9.6% gap down, Accenture plc (ACN) traded straight down to a 5+ year low. The weekly chart shows an ominous, long-term topping pattern.
Trade commentary: I was hopeful that business services companies could do a turnaround after getting slammed by federal level budget cuts last year. ACN is building a business out of generative AI, and I figured this segment could prop up the business. I got into ACN after it broke out above 200DMA resistance last month. Like other stocks suffering from the fragmentation in the market, ACN soon turned right around. The accompanying technical breakdown pushed me out of the stock. ACN now trades at levels last seen in October 2020. The weekly chart below shows the dangerous, longer-term topping action in the stock after years of a relatively consistent uptrend. Accordingly, I have dropped ACN from my shopping list.
")
")
Be careful out there!
Footnotes
Subscribe for free to get email notifications of future posts!
“Above the 50” (AT50) uses the percentage of stocks trading above their respective 50-day moving averages (DMAs) to measure breadth in the stock market. Breadth defines the distribution of participation in a rally or sell-off. As a result, AT50 identifies extremes in market sentiment that are likely to reverse. Above the 50 is my alternative name for “MMFI” which is a symbol TradingView.com and other chart vendors use for this breadth indicator. Learn more about AT50 on my Market Breadth Resource Page. AT200, or MMTH, measures the percentage of stocks trading above their respective 200DMAs.
Active AT50 (MMFI) periods: Day #156 over 20%, Day #45 over 30%, Day #43 over 40%, Day #38 over 50% (overperiod), Day #3 under 60% (underperiod), Day #129 under 70%
Source for charts unless otherwise noted: TradingView.com
Full disclosure: long IWM shares, long SPY calls, long AMD, long ADM
FOLLOW Dr. Duru’s commentary on financial markets via StockTwits, BlueSky, and even Instagram!
*Charting notes: Stock prices are not adjusted for dividends. Candlestick charts use hollow bodies: open candles indicate a close higher than the open, filled candles indicate an open higher than the close.
* Blog notes: this blog was written based on the heavily edited transcript of the following video that includes a live review of the stock charts featured in this post. I used ChatGPT to process the transcript.
I sure enjoy reading your views and evaluations on the market. Best guidance I have found anywhere. Easy to understand….
Excellent! I am happy to hear it, and I appreciate the feedback.