
Stock Market Analysis Summary
|
Stock Market Commentary
Welcome to a new year. The year 2025 did not quite end on the positive note that I expected. In fact, the year 2025 ended with a notable whimper. This year’s trading started with some stark divergences. The AI trade resumed for semiconductor stocks and small caps looked just as bullish. However, pressure intensified for software stocks. As a result, the stock market immediately put my shopping list for 2026 to the test. I responded with software and semiconductor buys. Nothing triggered on the commodities side of my shopping list.
The year also started with a major surprise with the U.S. invading Venezuela, capturing the country’s President, and President Trump declaring that the U.S. will run Venezuela for now. This unexpected development will not likely impact the stock market, at least not in a sustained way. Still, this invasion sets a tone (or reinforces a tone). The world just got incrementally more dangerous and unpredictable. Consider ourselves advised (be ready so you do not have to get ready).
The Stock Market Indices
S&P 500 (SPY)
The S&P 500 fell below its prior double-top level formed around Fed rate cuts. Fortunately, the 20-day moving average (DMA) (the dashed line below) held as support even after sellers faded Friday’s tepid buying. Buyers were able to save the index from testing 50DMA support. The year’s first trading day was essentially a stalemate kind of day for the S&P 500. The lower than average trading volume (see the green and red bars below) suggests that the price action is not meaningful enough for strong conclusions.
")
NASDAQ (COMPQX)
The NASDAQ showed similar behavior to the S&P 500. The tech laden index opened strong but next faded for most of the day. At one point, the NASDAQ traded in the red before buyers stepped in and saved the 50DMA (the red line below) as support. Note that, unlike the S&P 500, the NASDAQ failed to surpass its prior peak. Thus, the NASDAQ’s grip on support looks more tenuous.
")
iShares Russell 2000 ETF (IWM)
The iShares Russell 2000 ETF (IWM) outperformed with a solid 1.1% gain and a convincing bounce off 50DMA support. I took profits on opportunistic calls I bought the day before with IWM trading right at 50DMA support. The profits partially made up for the loss on the previous tranche of call options which were left over from a calendar call spread betting on more upside above the 20DMA. IWM volume also picked up on Friday, making the gains look incrementally more sustainable in the short-term.
")
The Short-Term Trading Call While Getting Ready for the 2026
- AT50 (MMFI) = 53.4% of stocks are trading above their respective 50-day moving averages
- AT200 (MMTH) = 57.8% of stocks are trading above their respective 200-day moving averages
- Short-term Trading Call: neutral
AT50 (MMFI), the percentage of stocks trading above their respective 50DMAs, closed the week at 53.4%. My favorite technical indicator remains stuck in a downtrend, including an ominous picture-perfect failure at the downtrend line during the last days of December. That rejection reinforces my caution and keeps my short-term trading call solidly posted in neutral. I am starting to think that I may stay neutral for weeks, maybe even months, to come. I switched from cautiously bullish to neutral after the S&P 500 confirmed a 50DMA breakdown in late November. At the time I was waiting for an official oversold reading on AT50 (below 20%) that never occurred.
While the AT50 downtrend keeps me wary, I relied on the December 10 breakout for AT200, the percentage of stocks trading above their 200DMAs, to keep me hopeful. This longer-term indicator of the health of market breadth indicated that the majority of stocks had good long-term trends defined by their 200DMAs. Unfortunately, AT200 finally dropped below the former downtrend line on the last day of 2025. Thus, I am a little more worried about the underlying health of the stock market even as I continue to eye buying opportunities.
The Equities: Pressure
iShares Expanded Tech-Software Sector ETF (IGV)
Description: iShares Expanded Tech-Software Sector ETF tracks U.S. software companies across application, systems, and infrastructure software segments.
Technical status: iShares Expanded Tech-Software Sector ETF (IGV) tripped down below its 200DMA after a 2.9% drop, entering bearish territory.
Trade commentary: IGV is the poster child for the pressure on software stocks. The ETF fell 2.9% and moved into bearish territory with its 200DMA breakdown. Previously, IGV was trapped between 50DMA resistance and 200DMA support. That support failed, placing software stocks firmly in a bearish position and immediately testing my desire to buy beaten up software stocks this year.
")
Salesforce, Inc (CRM)
Description: Salesforce provides cloud-based customer relationship management software and enterprise applications for sales, service, marketing, and analytics.
Technical status: Salesforce Inc (CRM) fell below key support while forming a Bollinger Band squeeze around its 200DMA.
Trade commentary: CRM is one of the beaten up software stocks on my shopping list. The stock fell 4.3% on Friday. I was hoping CRM would hold 200DMA support, and I bought shares around that level. I later added a call spread as CRM approached 50DMA support for the second time on the day. A Bollinger Band squeeze is forming (the black lines defining expected price volatility), indicating compressed volatility. When that squeeze resolves, CRM should print a sustained breakout or breakdown.
")
Adobe, Inc (ADBE)
Description: Adobe develops software for digital media creation, document management, and marketing analytics.
Technical status: Adobe Inc (ADBE) remained deeply bearish after failing below its 50DMA, remaining capped by 200DMA resistance.
Trade commentary: ADBE is on my shopping list, but I did NOT buy into Friday’s 4.8% loss. The stock remains in a long-standing downtrend defined by 200DMA resistance (the blue line below). I am patiently waiting for ADBE to confirm a 200DMA breakout before buying.
")
Microsoft Corp (MSFT)
Description: Microsoft develops software, cloud services, operating systems, and hardware products for consumers and enterprises.
Technical status: Microsoft Corp (MSFT) broke down below its 200DMA after a 2.2% dip, entering a bearish technical position.
Trade commentary: MSFT ended the day in a bearish position for the first time in a very long time. Shares fell 2.2%, closed below its 200DMA, and tested the November low. If sellers follow through, MSFT will confirm a bearish trend. I already own MSFT and have no lower level yet where I would add to my position.
")
Datadog, Inc (DDOG)
Description: Datadog provides cloud-based monitoring, security, and analytics software for IT infrastructure and applications.
Technical status: Datadog Inc (DDOG) tested 200DMA support after an extended post-earnings decline.
Trade commentary: DDOG steadily dripped lower since a massive 23.1% post-earnings gain in November. Soon after I put the stock on my buy list with an upside trigger above $188. Instead, I ended up buying DDOG near 50DMA support, which held briefly, but sellers eventually took control again. The stock is now testing 200DMA support. If DDOG closes lower for two more sessions, I will exit and take the loss.
")
Advanced Micro Devices (AMD)
Description: Advanced Micro Devices designs and manufactures semiconductors for computing, graphics, and data center applications.
Technical status: Advanced Micro Devices Inc (AMD) rose off its 20DMA, preparing for a potential 50DMA breakout ahead of the Consumer Electronics Show (CES).
Trade commentary: I exited AMD after its confirmed 50DMA breakdown. Now the stock almost looks constructive again as the stock started the year benefitting from a strong showing from AI-driven semiconductor stocks. AMD came into 2026 on the heels of a month long price consolidation and appears ready to print a 50DMA breakout, which would pull me back into a position. AMD is firmly part of the AI trade, so I am watching the stock very closely.
")
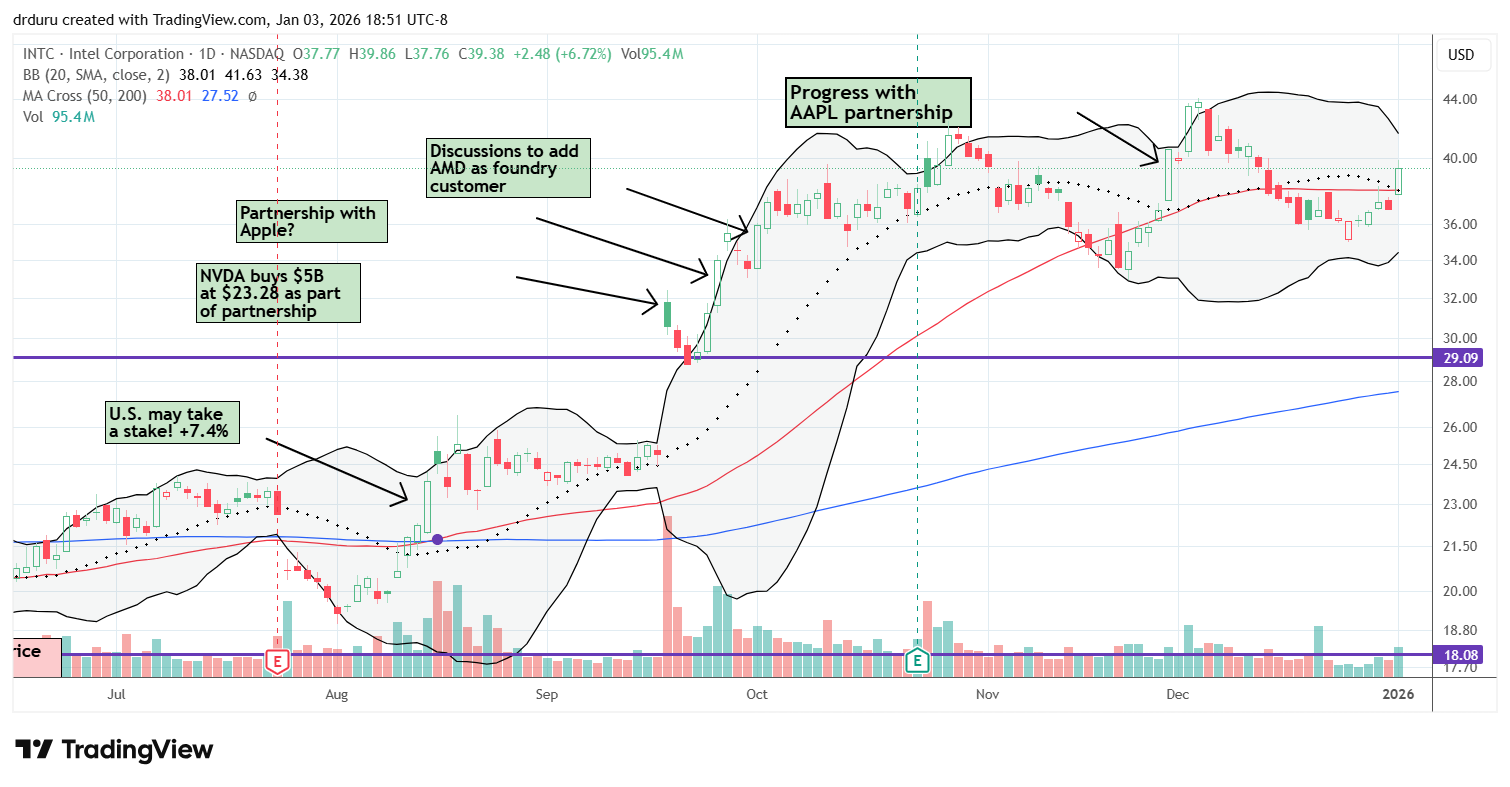
Intel Corporation (INTC)
Description: Intel Corporation designs and manufactures semiconductor chips and platforms that power personal computers, data centers, and a broad range of computing and networking applications worldwide.
Technical status: Intel Corporation (INTC) started the year with a 6.7% gain and a breakout above converged resistance at the 20DMA and 50DMA
Trade commentary: INTC enjoyed a convincing breakout as a part of the AI-driven semiconductor surge. Here too the stock market immediately put my 2026 shopping list to the test. I bought shares and call options on the breakout. I plan to hold the shares as a core position, meaning only a confirmed 200DMA breakdown shakes me out.
Corning Incorporated (GLW)
Description: Corning manufactures specialty glass, ceramics, and optical fiber products for industrial and technology markets.
Technical status: Corning Inc (GLW) successfully tested 50DMA support and closed at a multi-week high.
Trade commentary: GLW gained 3.6% as a part of the AI bump higher to start the year. The stock is on pace to test its prior all-time high and potentially move higher after a successful test of 50DMA support. That strength prompted me to re-enter the stock although I had planned NOT to add new AI-related stocks to my portfolio besides INTC and AMD.
")
Palantir Technologies (PLTR)
Description: Palantir develops software platforms for data integration, analytics, and artificial intelligence applications.
Technical status: Palantir Technologies Inc (PLTR) broke down below its 50DMA, dropping back under a long-standing double-top resistance area.
Trade commentary: PLTR dropped 5.6% as the pressure on software stocks won over the AI enthusiasm that should have helped the stock. The stock fell back below its double top from the summer and fall, which raises a yellow flag. Repeated failures in the same price range suggest a topping pattern. I am watching 200DMA support, which has not been tested since mid-2023.
")
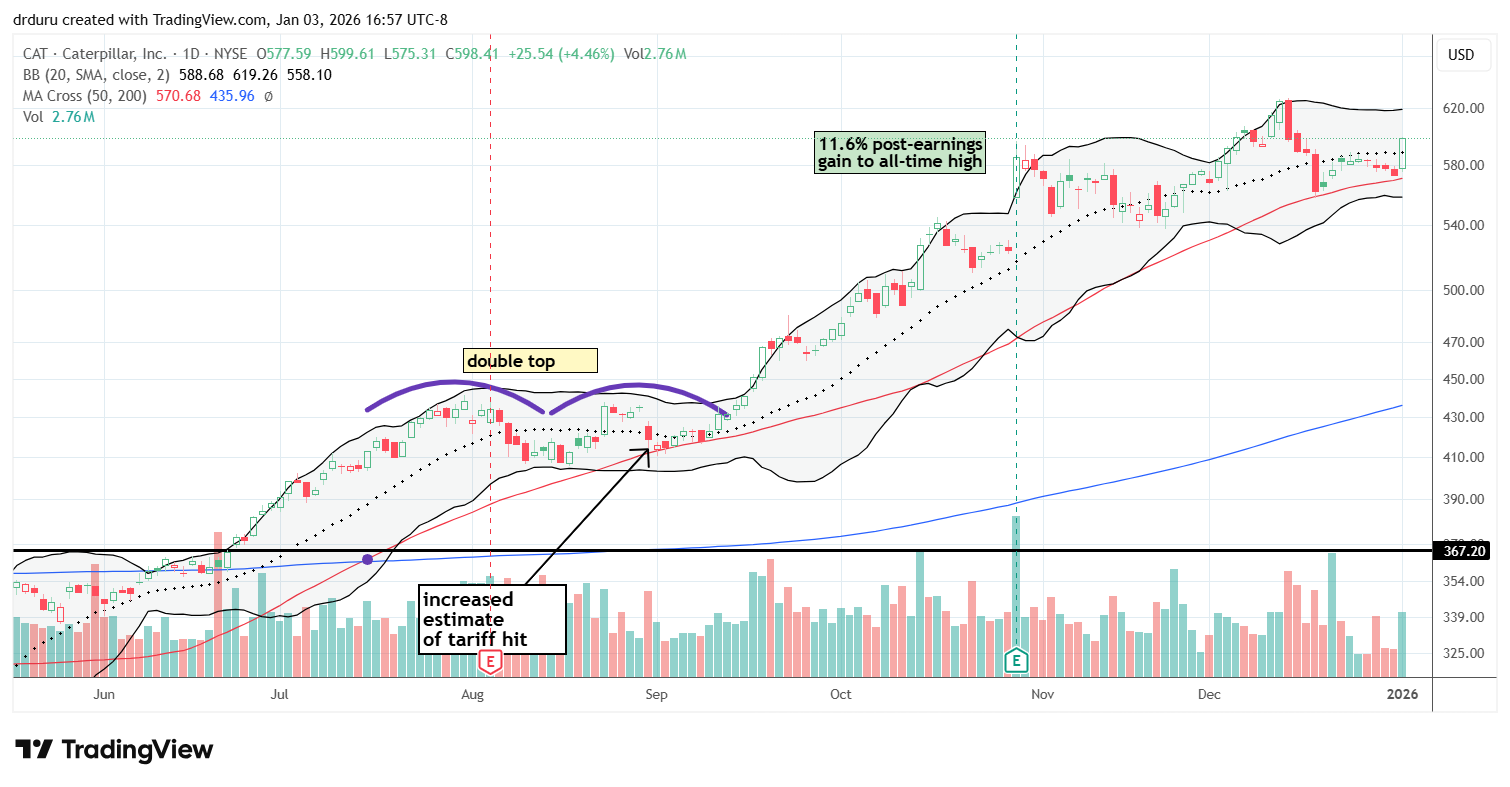
Caterpillar (CAT)
Description: Caterpillar manufactures construction, mining, and industrial equipment, engines, and related services.
Technical status: CAT confirmed a bullish rebound after holding 50DMA support with expanding volume.
Trade commentary: CAT was my best position of the day. I bought a Jan 600/620 call spread on the first successful test of 50DMA support in mid-December. The stock gained 4.5% to start the year, volume picked up, and the bullish move was confirmed. CAT joined the AI trade by virtue of its equipment used in data center construction and infrastructure build-outs to support AI energy needs. As a result, I no longer plan to use CAT as a hedge against bullishness (ORCL may be the new hedging target).
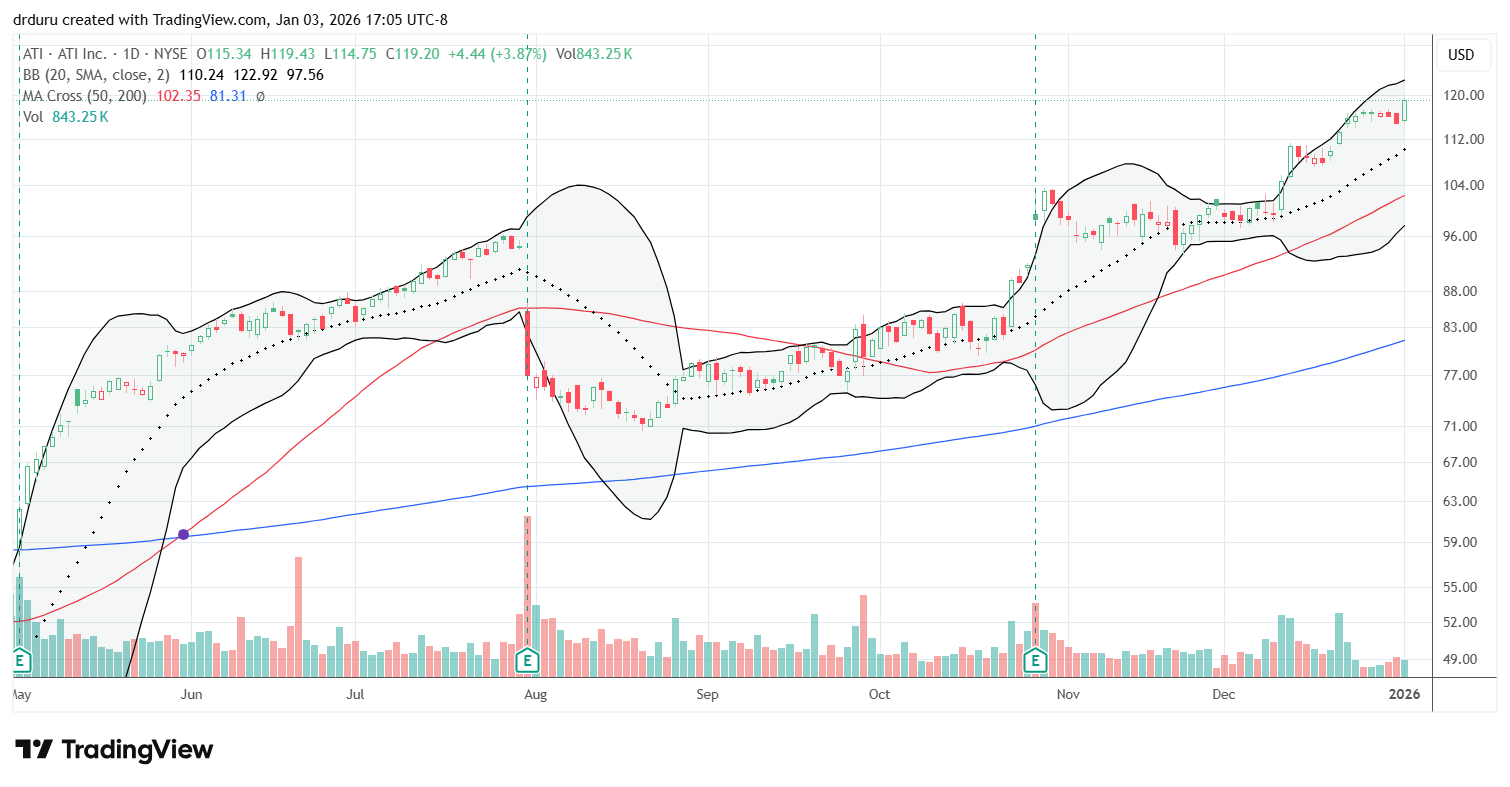
ATI Incorporated (ATI)
Description: ATI produces specialty metals and advanced materials for aerospace, defense, and industrial applications.
Technical status: ATI broke out to a new all-time high with a 3.9% gain as part of a strong 5+ year uptrend.
Trade commentary: I have traded in and out of ATI and wish I just stuck with my original bullish thesis: specialty metals and materials will be increasingly important for the thriving advanced manufacturing sector. I plan to return to ATI and accumulate it as a long-term holding.
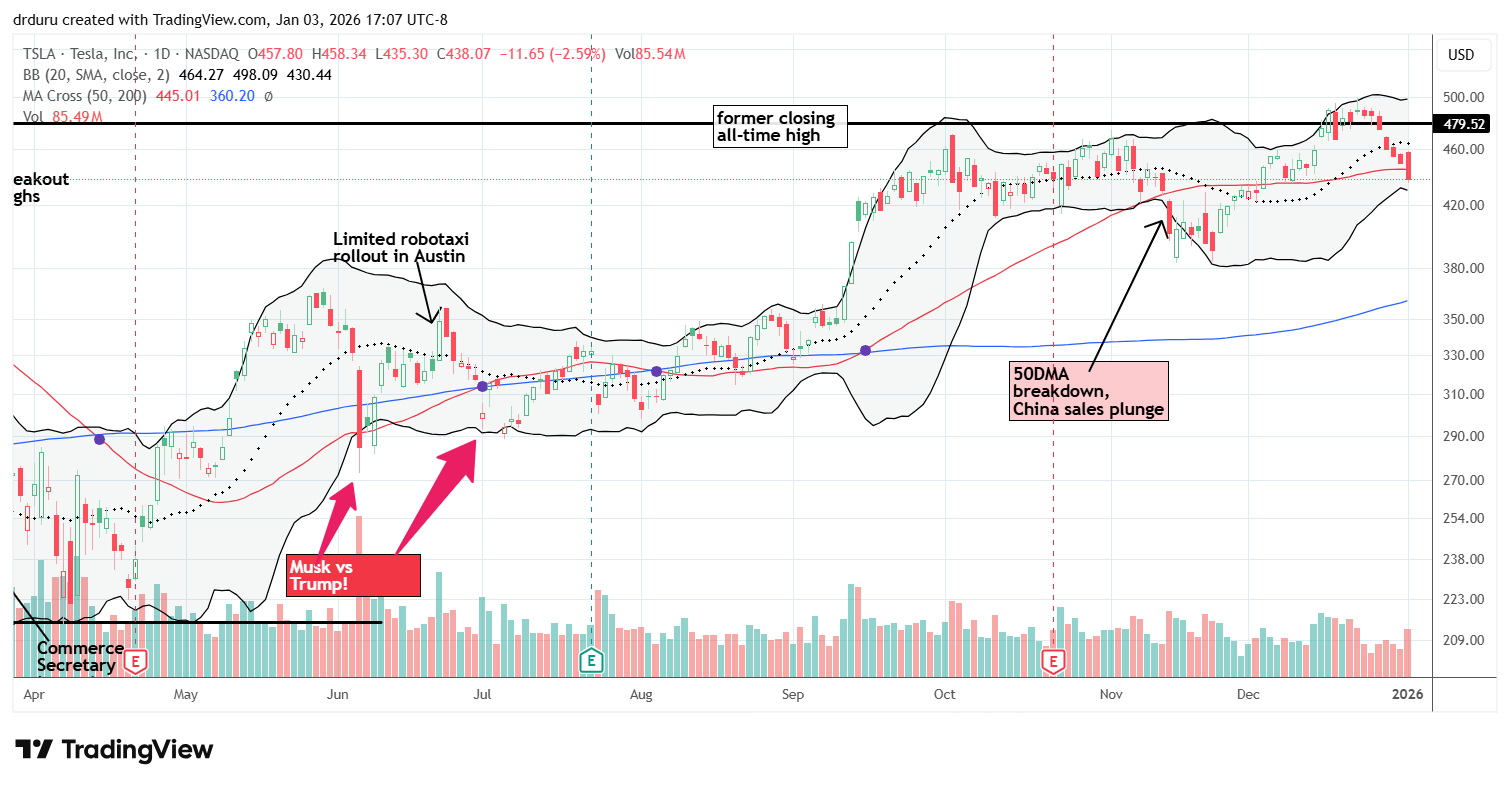
Tesla, Inc (TSLA)
Description: Tesla designs and manufactures electric vehicles, energy storage systems, and related software technologies.
Technical status: TSLA closed below its 50DMA and looks toppy again with a close well below the former all-time high.
Trade commentary: TSLA fell 2.6% and closed below its 50DMA following the release of more poor sales numbers. I figured the market would ignore the bad news as usual, so I was unsurprised by TSLA’s positive open. However, like the NASDAQ, TSLA faded. The stock ended up losing 2.6% on the day. The stock is not quite bearish, but it looks toppy with the price action chopping around below its former all-time high.
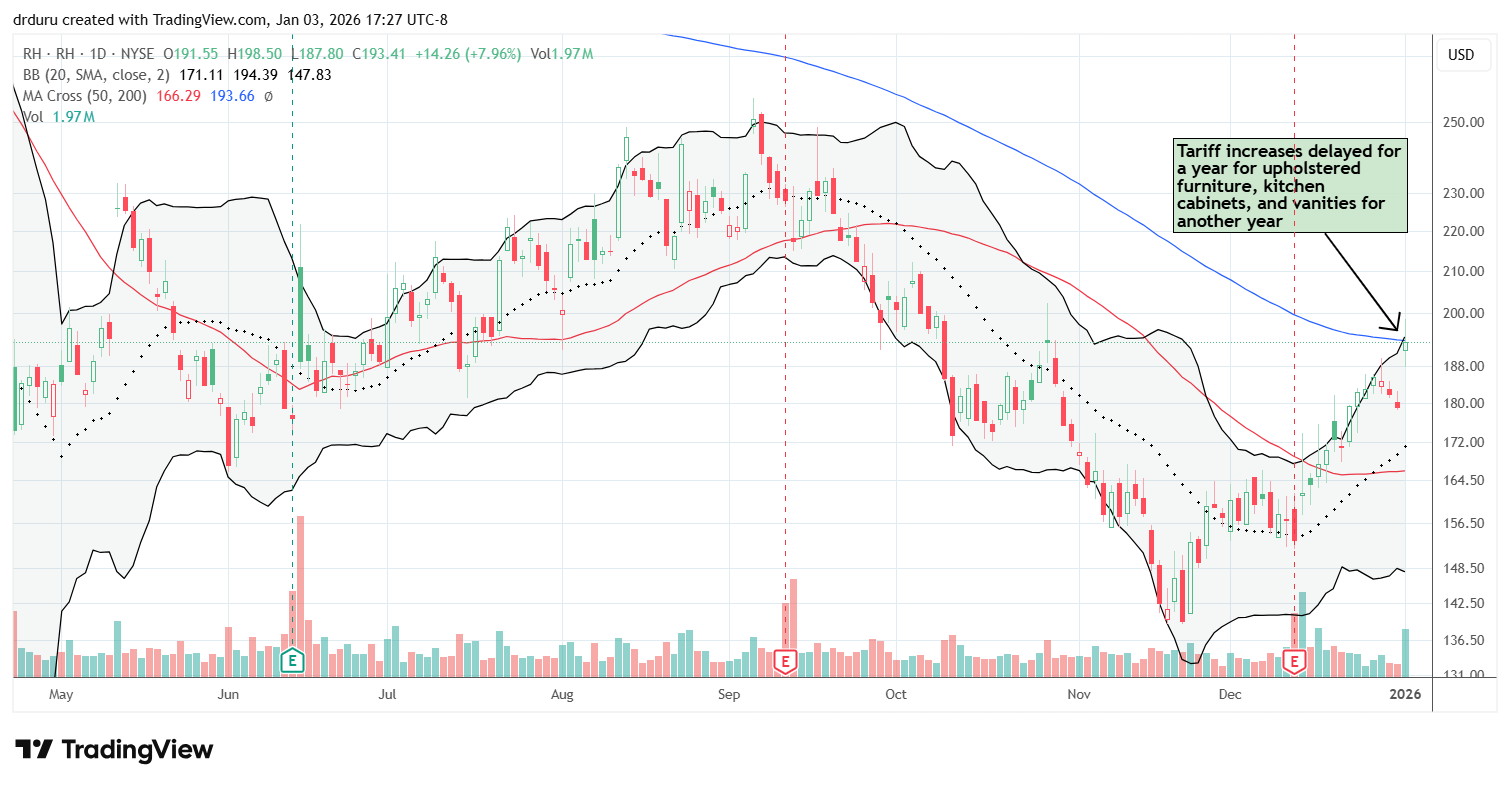
RH (RH)
Description: RH designs, markets, and sells home furnishings, furniture, and décor products.
Technical status: RH stalled at 200DMA resistance after a sharp tariff-related rally and 8.0% gain.
Trade commentary: RH surged after President Trump announced a year delay for tariffs on upholstered furniture, kitchen cabinets, and vanities. The stock stopped cold at 200DMA resistance, and I am skeptical about a continued rally in the short-term. Since lukewarm earnings, the stock rallied on what now looks like anticipation of the delay in tariffs. Given the tariffs are only delayed, RH, and similar stocks, are subject to a setback at some point. RH already has a 20% short interest, so I would not consider fading it until/unless it closed below Friday’s intraday low.
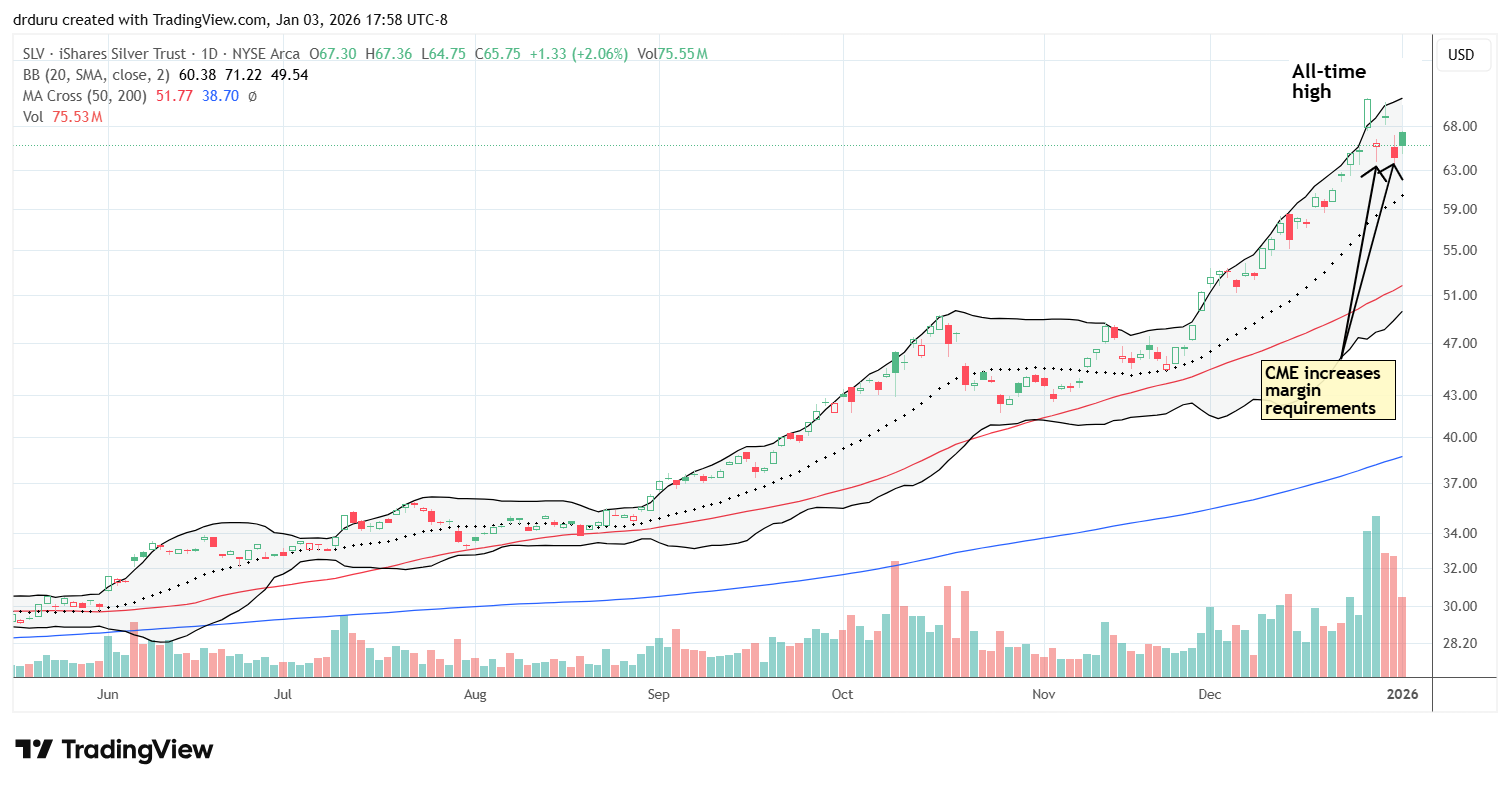
iShares Silver Trust (SLV)
Description: Silver is a precious metal traded as a commodity for industrial use and investment purposes.
Technical status: iShares Silver Trust (SLV) exhibited extreme volatility with large gaps signaling potential topping behavior.
Trade commentary: SLV has traded in very choppy fashion over the last week. After an incredible 9.1% surge on December 26 to an all-time high, the CME Group increased margin requirements. SLV promptly reversed almost all its gains. After SLV started recovering the very next day with a 4.5% gain, the CME Group increased margin requirements again. This kind of volatility can signal a top, so I am on alert for an early test of another part of my 2026 shopping list: commodities.
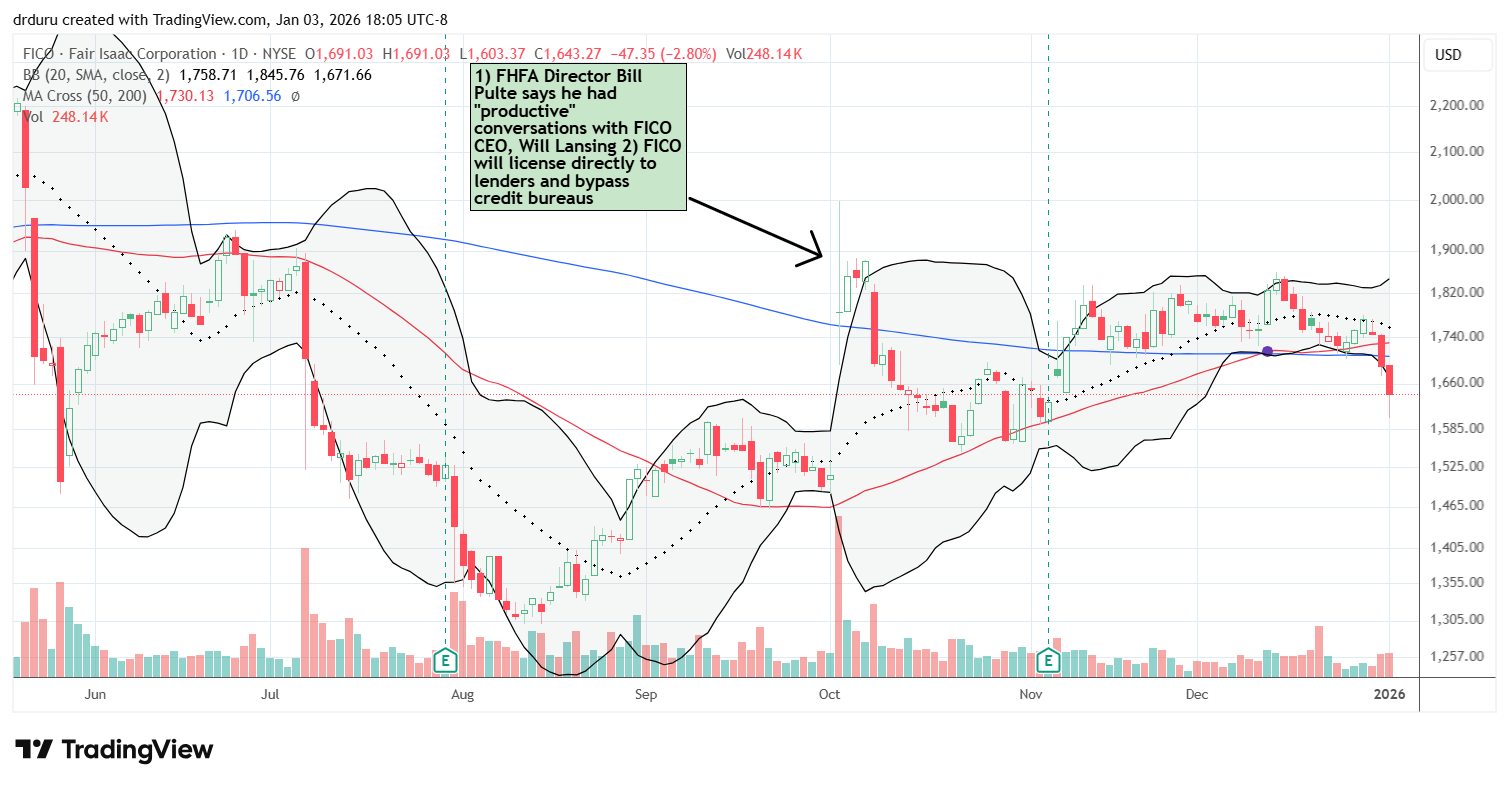
Fair Isaac Corporation (FICO)
Description: Fair Isaac Corporation provides analytics and decision management software, including credit scoring products.
Technical status: Fair Isaac Corporation (FICO) confirmed a bearish breakdown below both its 50DMA and 200DMA with a 2.8% loss.
Trade commentary: After FICO seemed to make peace with FHFA Director Bill Pulte, I put the stock back on my buy list. However, the stock’s momentum stalled from there. Now FICO is a short candidate. I did not see any news explaining the drop.
")
")
Be careful out there!
Footnotes
Subscribe for free to get email notifications of future posts!
“Above the 50” (AT50) uses the percentage of stocks trading above their respective 50-day moving averages (DMAs) to measure breadth in the stock market. Breadth defines the distribution of participation in a rally or sell-off. As a result, AT50 identifies extremes in market sentiment that are likely to reverse. Above the 50 is my alternative name for “MMFI” which is a symbol TradingView.com and other chart vendors use for this breadth indicator. Learn more about AT50 on my Market Breadth Resource Page. AT200, or MMTH, measures the percentage of stocks trading above their respective 200DMAs.
Active AT50 (MMFI) periods: Day #141 over 20%, Day #30 over 30%, Day #28 over 40%, Day #23 over 50% (overperiod), Day #16 under 60% (underperiod), Day #114 under 70%
Source for charts unless otherwise noted: TradingView.com
Full disclosure: long IWM shares, long CRM shares and call spread, long MSFT, long DDOG, long GLW, long CAT call spread, long TSLQ, long INTC shares and calls
FOLLOW Dr. Duru’s commentary on financial markets via StockTwits, BlueSky, and even Instagram!
*Charting notes: Stock prices are not adjusted for dividends. Candlestick charts use hollow bodies: open candles indicate a close higher than the open, filled candles indicate an open higher than the close.
* Blog notes: this blog was written based on the heavily edited transcript of the following video that includes a live review of the stock charts featured in this post. I used ChatGPT to process the transcript.
Venezuela situation is an oil grab, being sold as a drug interdiction. It massively destabilizes the market for Venezuela’s heavy sour crude (used mostly by the US Gulf coast refineries, secondarily by China and India) and thus somewhat destabilizes all energy markets.
“The proven oil reserves in Venezuela are recognized as the largest in the world, totaling 300 billion barrels (4.8×10¹⁰ m3) as of 1 January 2014. The 2019 edition of the BP Statistical Review of World Energy reports the total proved reserves of 303.3 billion barrels for Venezuela (slightly more than Saudi Arabia’s 297.7 billion barrels).” – Wikipedia