Stock Market Commentary
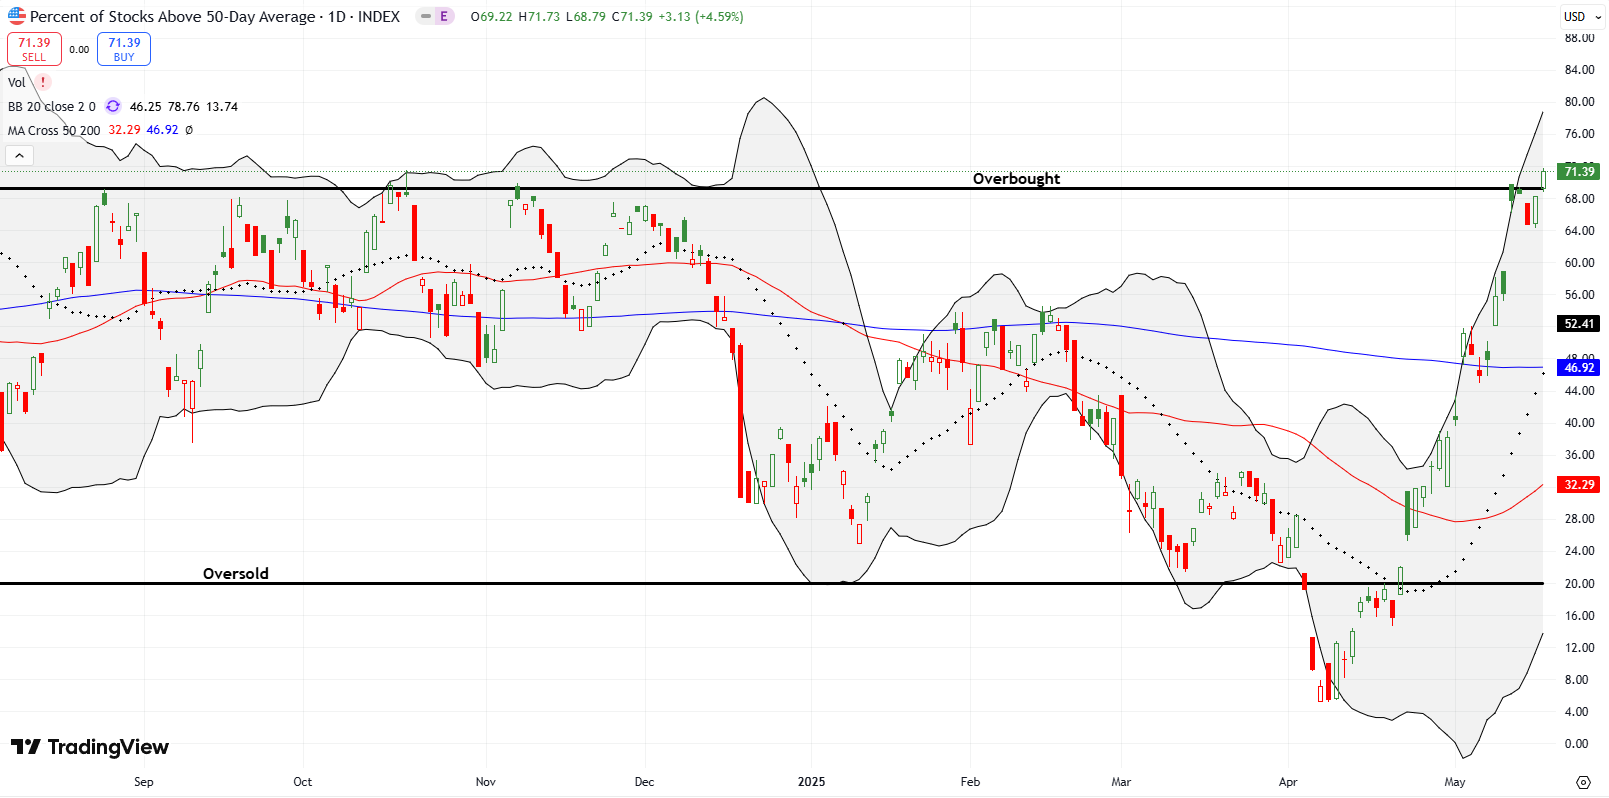
We made it through another week without any major negative headlines impacting the stock market. Although late-breaking news took futures down due to Moody’s dropping the U.S. from its top credit rating, marking the loss of the last top-tier assessment of U.S. government debt, I expect the market impact to be minimal. I am primed to buy dips because the stock market’s setup is still bullish. Moody’s announcement coincided with market breadth finally ending the overbought cliffhanger. For the first time in 185 trading days, the stock market is in overbought trading conditions.
The trading environment now reflects a complacency reflecting an era of technical bliss thanks to the easing of tariff tensions. The market rewarded pauses on both reciprocal and high China tariffs. However, I will be watching for increased market nervousness as the deadlines approach on the pauses. If no further significant deals come through, I fully expect extensions of the pauses. For this week, the news will shift to the massive U.S. debt levels and the parallel wrangling over the budget bill.
The Stock Market Indices
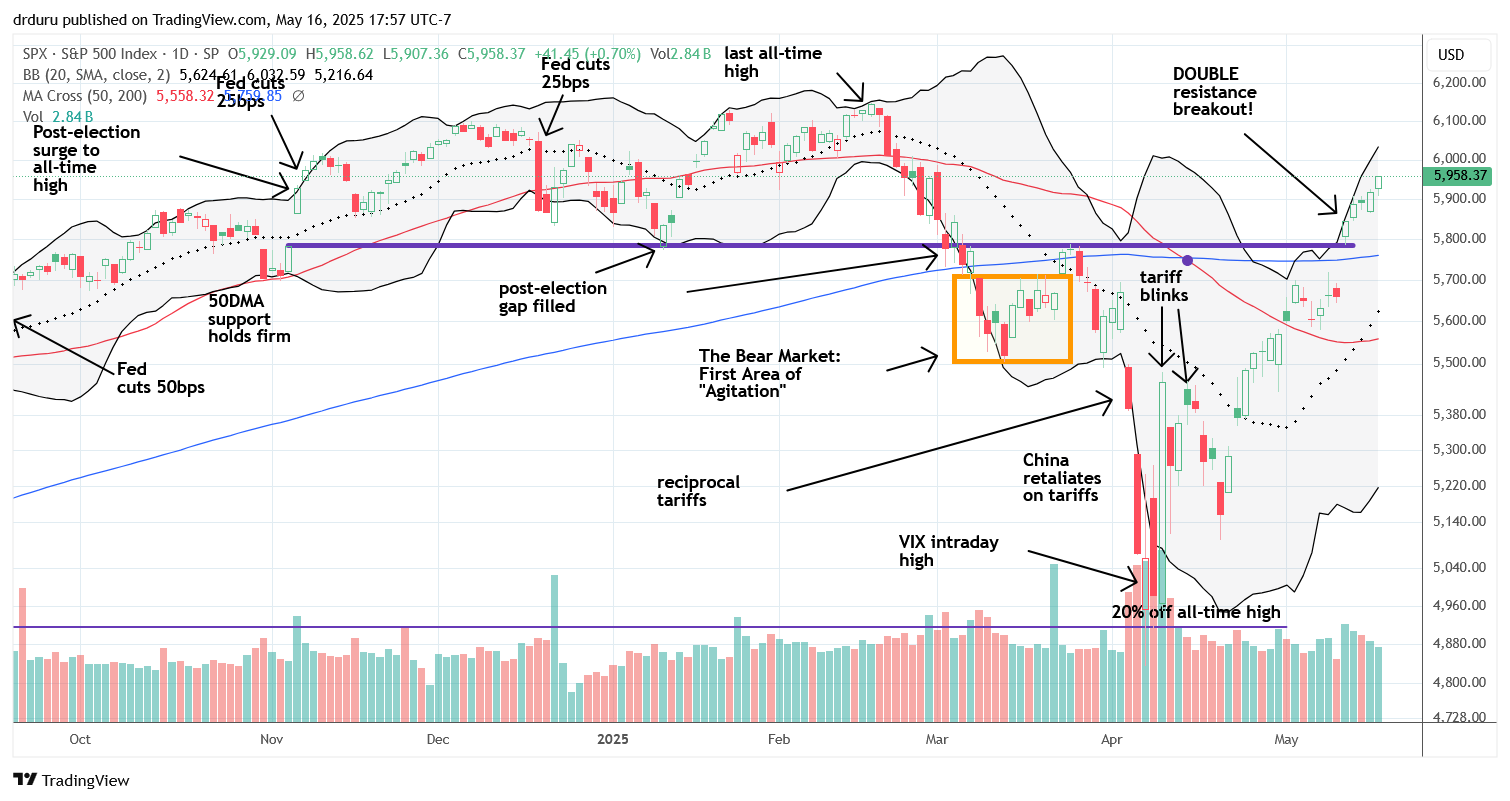
S&P 500 (SPY)
The S&P 500 remains well above its recently established support levels, which were previously resistance. Moreover, both the 50-day and 20-day moving averages (DMAs) (red and dotted lines) are trending upward. Even a decline out of overbought conditions would not justify a bearish stance unless these resistance levels give way. The recent rally underscores how quickly sentiment has shifted since the lows tied to the tariff drama. I am primed to buy the dips back to support.
NASDAQ (COMPQ)
The NASDAQ maintains a bullish breakout above its 200DMA (the blue line), mirroring the bullish positioning of the S&P 500. Like the S&P 500, I am primed to buy the dips in the NASDAQ back toward (200DMA) support.

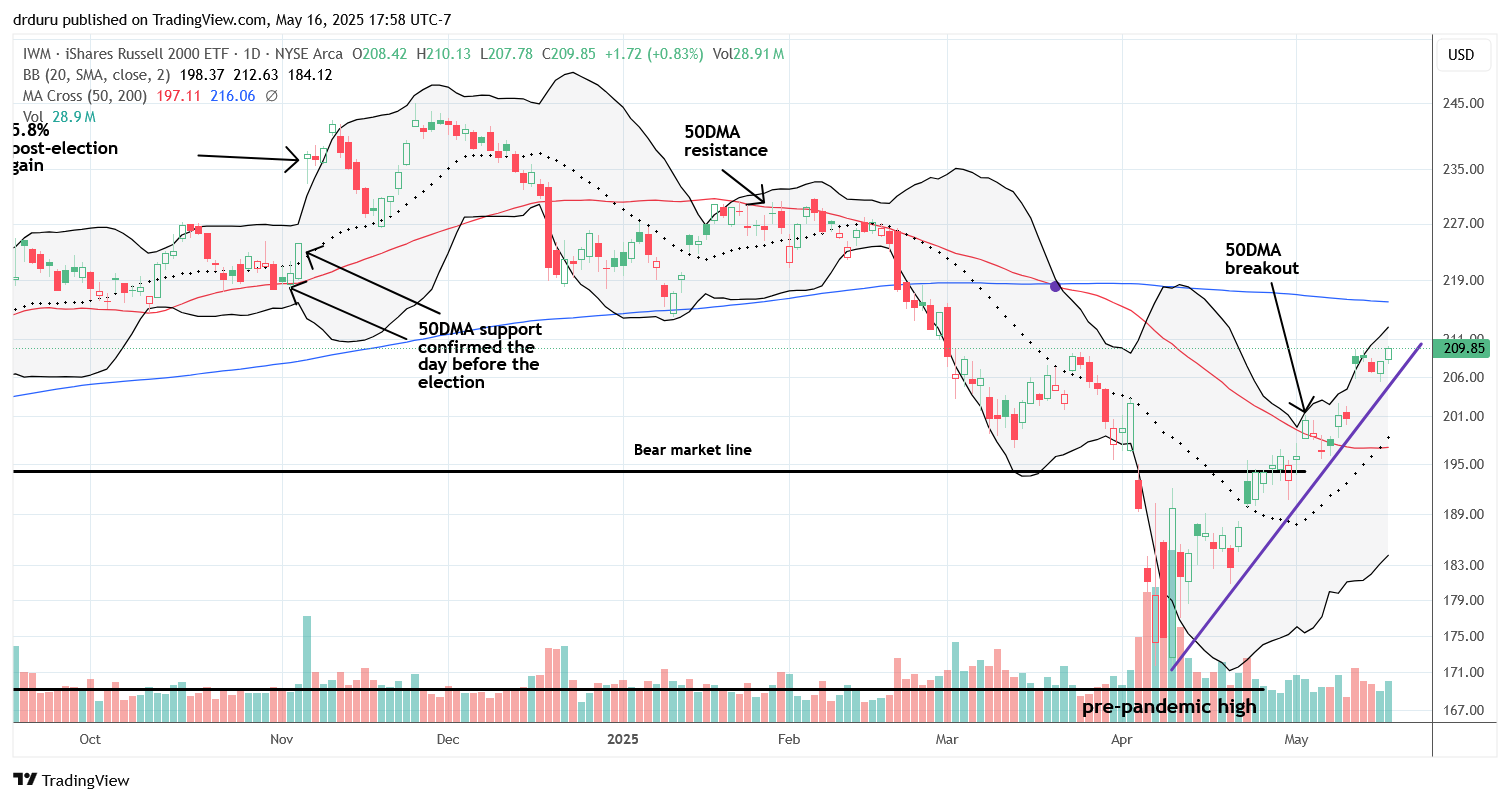
iShares Russell 2000 ETF (IWM)
IWM continues to honor its uptrend line. I missed a recent opportunity to buy call options, as I was waiting for a test of the uptrend. However, with a sizable core position in place, I feel no urgency to chase more speculative plays. Having said that, I am looking to buy IWM call options on a Moodys-driven pullback to the uptrend line.
The Short-Term Trading Call Right Back
- AT50 (MMFI) = 71.4% of stocks are trading above their respective 50-day moving averages (day #1 of oversold trading)
- AT200 (MMTH) = 44.6% of stocks are trading above their respective 200-day moving averages
- Short-term Trading Call: cautiously bullish
AT50 (MMFI), the percentage of stocks trading above their respective 50DMAs, finally broke cleanly into overbought territory, defined as at least 70% of stocks trading above their 50DMAs. My favorite technical indicator closed at 71.4%. Reaching overbought in just five weeks after being deeply oversold is highly unusual and likely historic. This rapid ascent for AT50 was facilitated by the previously steep downtrends in many 50DMAs, making it easier for prices to now break above them.
Given the context, this overbought condition is not as bearish as typical. Many stocks still have plenty of upside, and their moving averages need more time to turn higher. Thus, I am maintaining a cautiously bullish short-term trading call. If AT50 drops below overbought, I may shift to neutral, but I won’t turn bearish as directed by the AT50 trading rules. This time is “different” because of the layers of firm support below the indices. Those supports need to break before I even think about getting bearish.
AT200 (MMTH) has also shown significant improvement, rising to 44.6% and surpassing its previous high. The pattern of lower lows and lower highs is now broken; the downtrend is over. Although many 200DMAs are still in downtrends, AT200 has room to climb toward previous peaks near 68–70%.
The Volatility Index (VIX)
The VIX reflects renewed market complacency. Since its recent peak, the VIX has almost continuously declined, now at pre-tariff drama levels. At 17.25, there is room for another five-point drop to the 12-13 range – the level last seen in December – potentially fueling a continued rally to new all-time highs. Of course, the Moody’s news should send the VIX a bit higher on Monday.

The Equities: Still Bullish
SPDR Gold Trust (GLD)
Moody’s not only timed its bombshell perfectly at VIX support, but also perfectly timed at GLD support. I built a call spread position in GLD at support. I will be looking to take quick profits on a rally into downtrending 20DMA resistance. I am still leery about the confirmed bearish engulfing top from April.

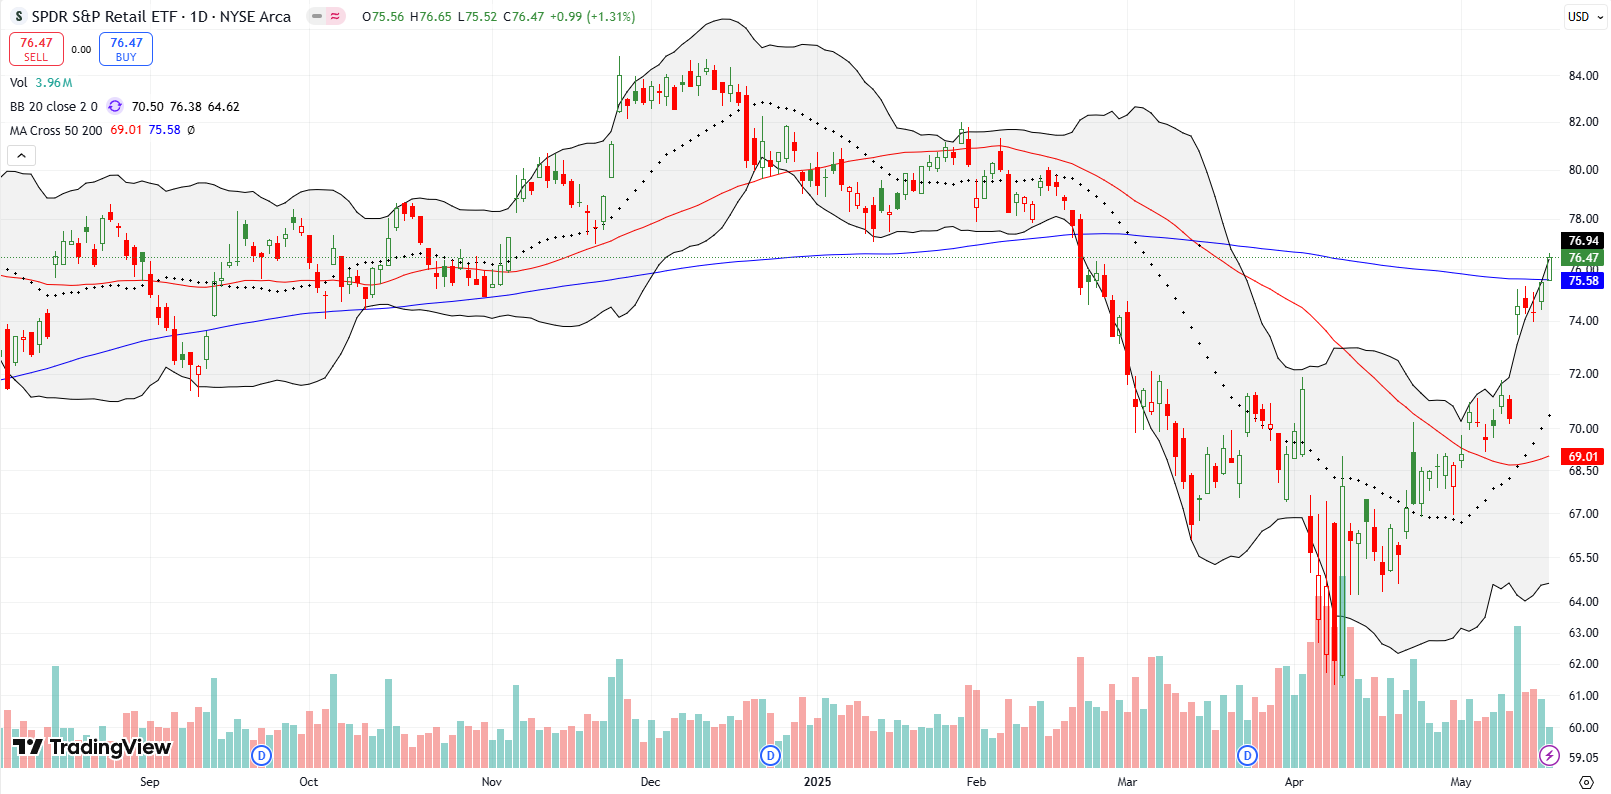
SPDR S&P Retail ETF (XRT)
Despite weak consumer sentiment, XRT broke above its 200DMA. I plan to buy XRT as retail earnings roll this week unless XRT closes below its 200DMA support.
Wayfair (W)
W is nearing its 200DMA resistance, which has in recent months acted as firm resistance. A confirmed breakout—two higher closes above the 200DMA—would be a bullish signal.

Coinbase (COIN)
I have a June 300/315 call spread in cryptocurrency trading platform COIN after a strong earnings reaction above the 200DMA. Despite a brief pullback on hacking news, the stock snapped back 9%—perhaps I was not bullish enough!

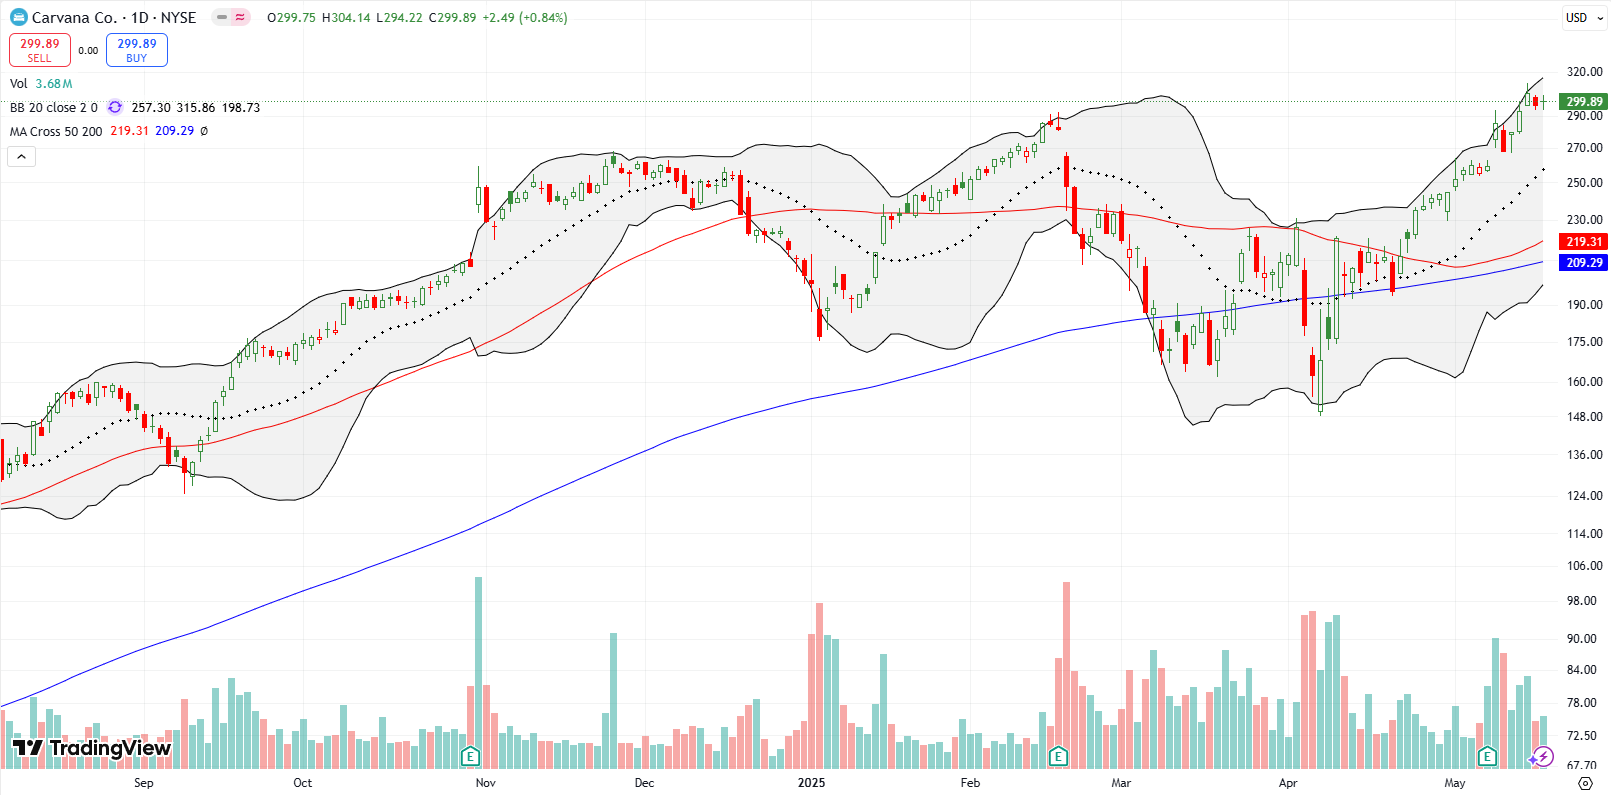
Carvana Co (CVNA)
CVNA reached new highs for the year, and is incredibly approaching all-time highs. I have never been able to buy CVNA during its incredible rebound. Instead, I even recently bought a put spread as insurance against bullishness.
First Solar (FSLR)
FSLR soared 22.7% on earnings and favorable tariff news but quickly pulled back below its 200DMA. If it reclaims the 200DMA (~$184), I become a buyer. Back in January I identified FSLR as a contrarian buy in the coming years. I did not think the stock could create a potentially bullish setup this soon!

Uber (UBER)
UBER broke out to an all-time high at $91.79. The stock is a buy on dips from here.

Corning Incorporated (GLW)
GLW confirmed a breakout above its 200DMA. News of a deal with an AI data center positions the stock as an AI play for me. I bought shares after seeing this news given GLW’s bullish positioning above its 200DMA support and converging 20 and 50DMAs.

NVIDIA Corporation (NVDA)
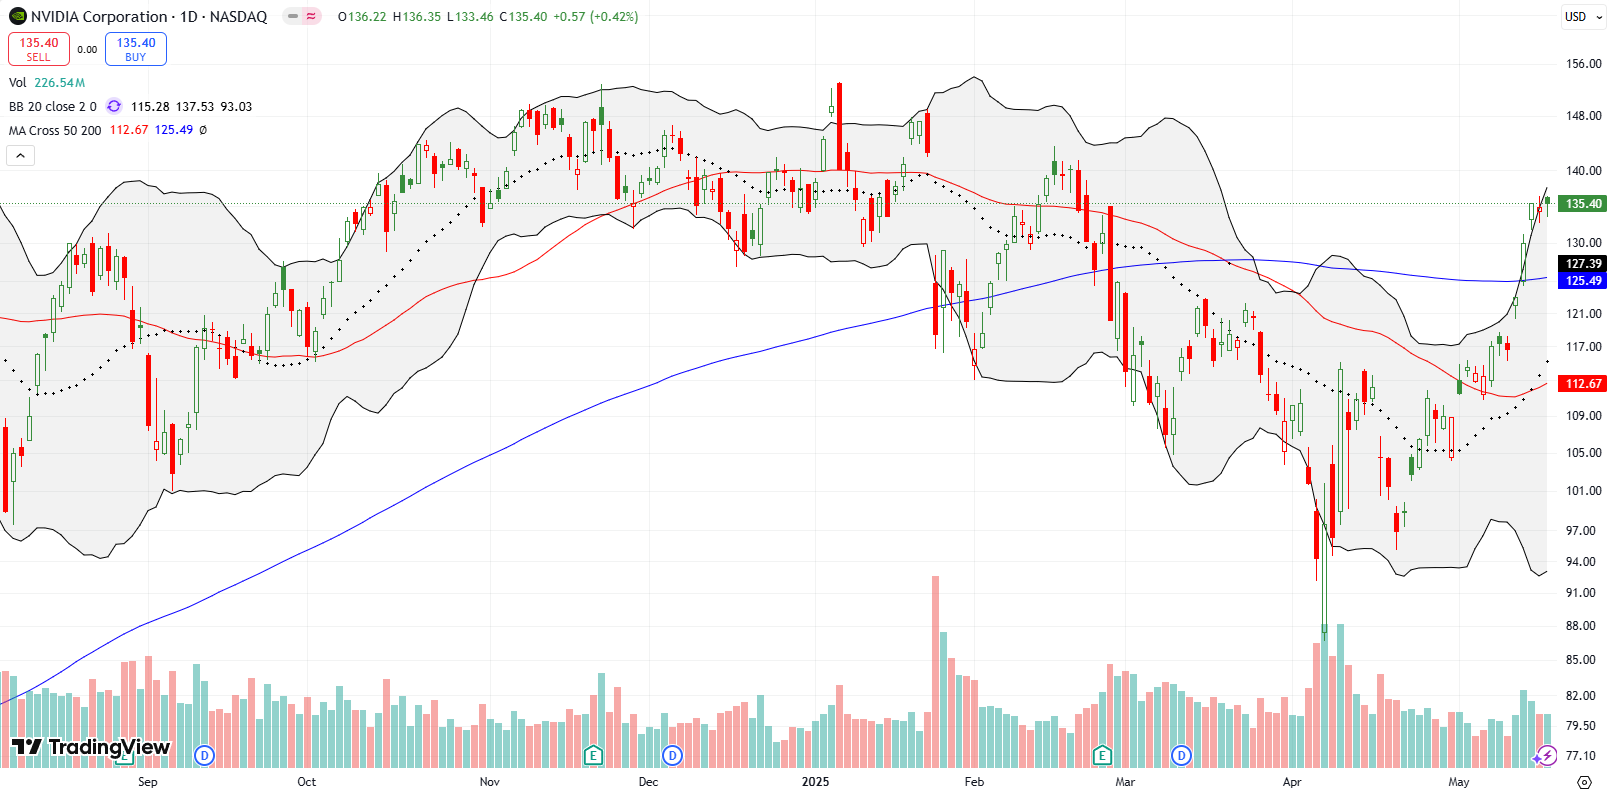
The bearish engulfing top on NVDA continues to hold as expected, but the stock is now bullish again above its 200DMA. I have traded low-risk calendar call spreads during this recovery. NVDA is a buy on the dips AND on a breakout to new all-time highs.
JB Hunt (JBHT)
JBHT broke out above its 50DMA resistance with a 9.7% gain on news of rollbacks on China tariffs. Still JBHT remains at great risk on renewed trade tensions and poor momentum from economic damage already in place. I am keeping JBHT in my sights as a way to hedge against bullishness.

Caterpillar (CAT)
Speaking of hedges, I decided to switch back to using CAT as a hedge against bullishness (coming after a fortuitous trade on a call option ahead of the China tariff pause). I started with a put calendar spread at the $345 strike. I was quite surprised that the market took me out of the position at my initial profit target. So I go into the Moody’s news without this hedge in place. I will be looking to try again assuming CAT remains below 200DMA resistance.

Dollar General (DG)
Discount retailer DG had a textbook test of 50DMA support at $87, which I missed while focused on Dollar Tree (DLTR). I am now eyeing DG as a buy on a breakout.

Dollar Tree (DLTR)
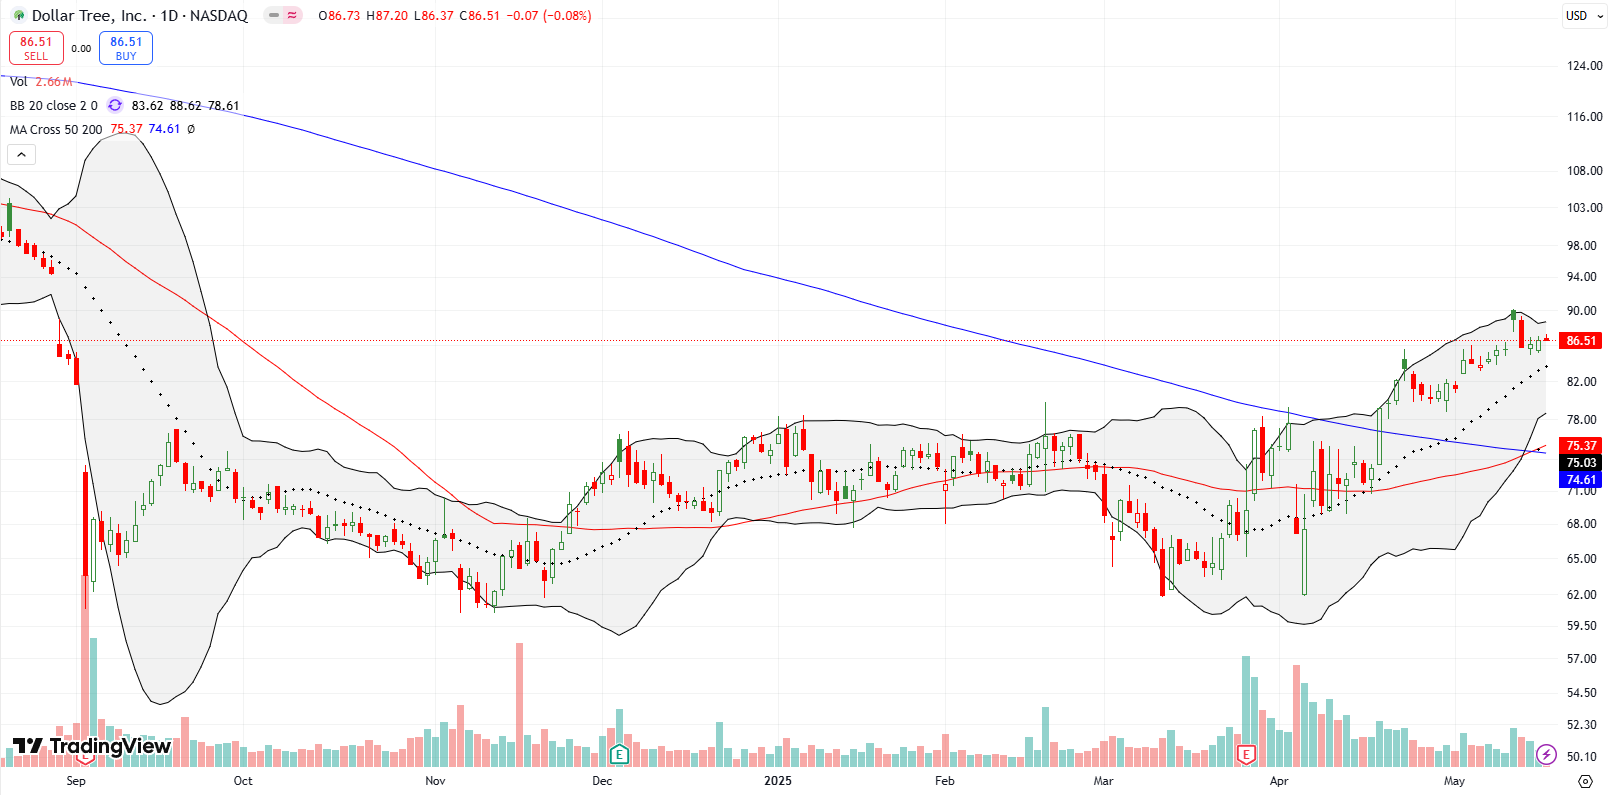
DLTR pulled back sharply and filled a gap before stabilizing. With earnings looming, I took profits on my position. I will look to reenter if the price revisits converging 50DMA/200DMA support around $74–75.
Impinj (PI)
After a 16.5% post-earnings surge, PI perfectly held 50DMA support before floating higher. I sold my shares on Friday. With a 30% gain and the stock approaching 200DMA resistance, I felt compelled to sell as part of risk management. PI is a buy on the dips for me.

Be careful out there!
Footnotes
Subscribe for free to get email notifications of future posts!
“Above the 50” (AT50) uses the percentage of stocks trading above their respective 50-day moving averages (DMAs) to measure breadth in the stock market. Breadth defines the distribution of participation in a rally or sell-off. As a result, AT50 identifies extremes in market sentiment that are likely to reverse. Above the 50 is my alternative name for “MMFI” which is a symbol TradingView.com and other chart vendors use for this breadth indicator. Learn more about AT50 on my Market Breadth Resource Page. AT200, or MMTH, measures the percentage of stocks trading above their respective 200DMAs.
Active AT50 (MMFI) periods: Day #11 over 20%, Day #9 over 30%, Day #7 under 40%, Day #6 over 50%, Day #5 over 60%, Day #1 over 70% (first overbought day ending 185 days under under 70%)
Source for charts unless otherwise noted: TradingView.com
Full disclosure: long IWM shares, long COIN call spread, long CVNA put spread, long GLW, long JBHT put,
FOLLOW Dr. Duru’s commentary on financial markets via StockTwits, BlueSky, and even Instagram!
*Charting notes: Stock prices are not adjusted for dividends. Candlestick charts use hollow bodies: open candles indicate a close higher than the open, filled candles indicate an open higher than the close.
* Blog notes: this blog was written based on the heavily edited transcript of the following video that includes a live review of the stock charts featured in this post. I used ChatGPT to process the transcript.


