

Stock Market Commentary
There are not enough superlatives in the dictionary to describe what happened today. We have borne witness to a multi-day, multi-week saga of economic warfare, tariff chaos, a rolling stock market crash – and now, an historic oversold bounce. President Trump has gone from tariffs, to tariff flexibility, to tariff reciprocity to a tariff blink featuring a 90-day pause on tariffs for non-retaliatory countries. Trump left in place the 10% global tariff and punished China further moving their tariff from 104% to 125%. The market only heard pause and proceeded to rejoice. The next day or hour of reckoning, like a near complete paralysis in trade between the world’s two biggest economies, is a concern for another time.
This episode finally completed the typical sequence of market distress: the market panics and crashes, policy makers panic next, they act, and the markets rejoice. This sequence got a false start during Monday’s rumor-inspired green shoots. Financial markets also rely on this sequence to constrain government to act in its best interests. The twist this time around was the delay in the policy response.
Even though the fundamental economic uncertainty and chaos has barely changed, the market chose to latch onto this pause as a sign that the worst-case scenario is behind us. This sentiment is made all the more powerful by the growing chorus of voices from all corners of the political and business spectrum who are critiquing this tariff policy, a policy that includes fake tariff rates from other countries and incoherent formulas for calculating U.S. reciprocal tariffs. That tailwind gives momentum to the assumption that stubborn policy makers will course correct. I am skeptical, but time will tell.
A particularly “unusual” moment came when the President suggested on social media that it was a good time to buy—not long before announcing the tariff pause. This breadcrumb is a signpost for future stock market clues. Trump directly claimed that the tariff blink sprang from watching weakening bond markets overnight, and then watching JPMorgan Chase (JPM) CEO Jamie Dimon in the morning talking about the increasing risk of recession on Fox Business (recall that Scott Bessent was a voice over the weekend trying to quell the recession voices). I still hold a trading position in JPM, and now I know that when I want exposure to financials, I should reach first for JPM! This signpost lets us know what and who the President MAY listen to outside of his inner circle.
Economic Snapshot
One of the dissenting voices speaking from all corners of American life, while remaining staunch Trump supporters, is Republican Senator Rand Paul (a libertarian). He claimed adamantly that international trade is a win-win and that in a free society there is no loser in trade. Paul also claimed that he has supporters in the Senate who are afraid to speak up because of politics. Most importantly, Paul pleaded for “an honest debate…we have to discuss the truth…We have to work on facts, and it is [our] job to point out fallacies…I can’t support a fallacy that is going to make us lose our wealth.” Of course the problem for Paul and many others is that policy power currently resides with people who thoroughly reject this standard and conventional economic thinking.
In the spirit of Rand’s plea, I took a look at the data on U.S. manufacturing. According to the St. Louis Fed’s FRED, February showed 482,000 manufacturing job openings. This is half what was available in the pandemic-driven, over-stimulated economy, but it is the same level as the peak in Trump’s first term before an economic slowdown helped drive manufacturing job openings lower going into the pandemic. Perhaps instead of restructuring the global economic order, the U.S. needs to restructure its economy to facilitate the domestic mobility required to move to where the (manufacturing) jobs are?
![Source: U.S. Bureau of Labor Statistics, Job Openings: Manufacturing [JTS3000JOL], retrieved from FRED, Federal Reserve Bank of St. Louis, April 9, 2025](https://drduru.com/onetwentytwo/wp-content/uploads/2025/04/20250409_Job-Openings-Manufacturing.png)
The Stock Market Indices
S&P 500 (SPY)
The S&P 500 had its best day since 2008. The index soared 9.5%, reclaiming nearly all recent losses and returning to the bottom of the first area of agitation. The next resistance level is the converging 20-day moving average (DMA) (the dotted line) and the March closing low. After that resistance looms a converging 50DMA (the red line) and the 200DMA (the blue line). The 200DMA is also declining for the first time in three years – more on THAT milestone in another post!
NASDAQ (COMPQ)
The NASDAQ surged an eye-popping 12.2%, marking its quick exit from a conventional bear market. The tech laden index stopped just short of 20DMA resistance. Converging resistance from the 200DMA and 50DMA looms above.
iShares Russell 2000 ETF (IWM)
IWM soared 8.5%, a surprising under-performer on the day. The ETF of small caps rallied from near pre-pandemic highs to just short of its bear market resistance line. I suspect IWM will soon re-establish a trading range here especially once the downtrending 20DMA converges with the bear market line.
The Short-Term Trading Call As the Market Rejoices
- AT50 (MMFI) = 12.5% of stocks are trading above their respective 50-day moving averages (Day #5 oversold)
- AT200 (MMTH) = 24.0% of stocks are trading above their respective 200-day moving averages
- Short-term Trading Call: bullish
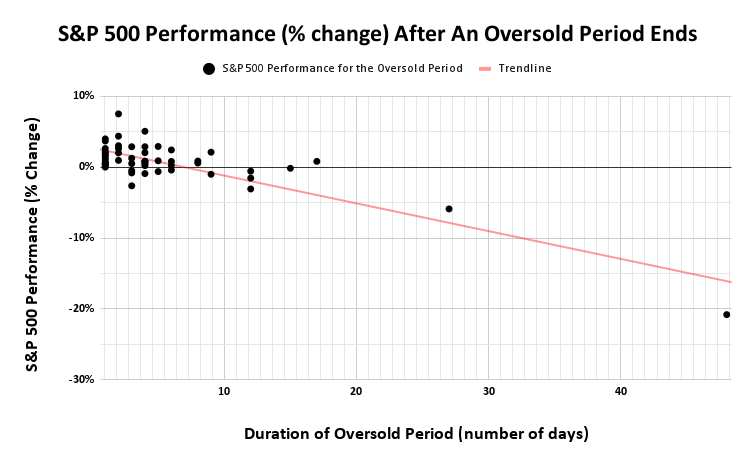
AT50 (MMFI), the percentage of stocks trading above their respective 50DMAs, surged from 5.5% to 12.5%. My favorite technical indicator remains deeply oversold even as the market rejoices at historic proportions. Thus, the stock market still has some upside left for the moment this oversold period ends. At 5 days in duration, the oversold period is already longer than the median and the average duration.
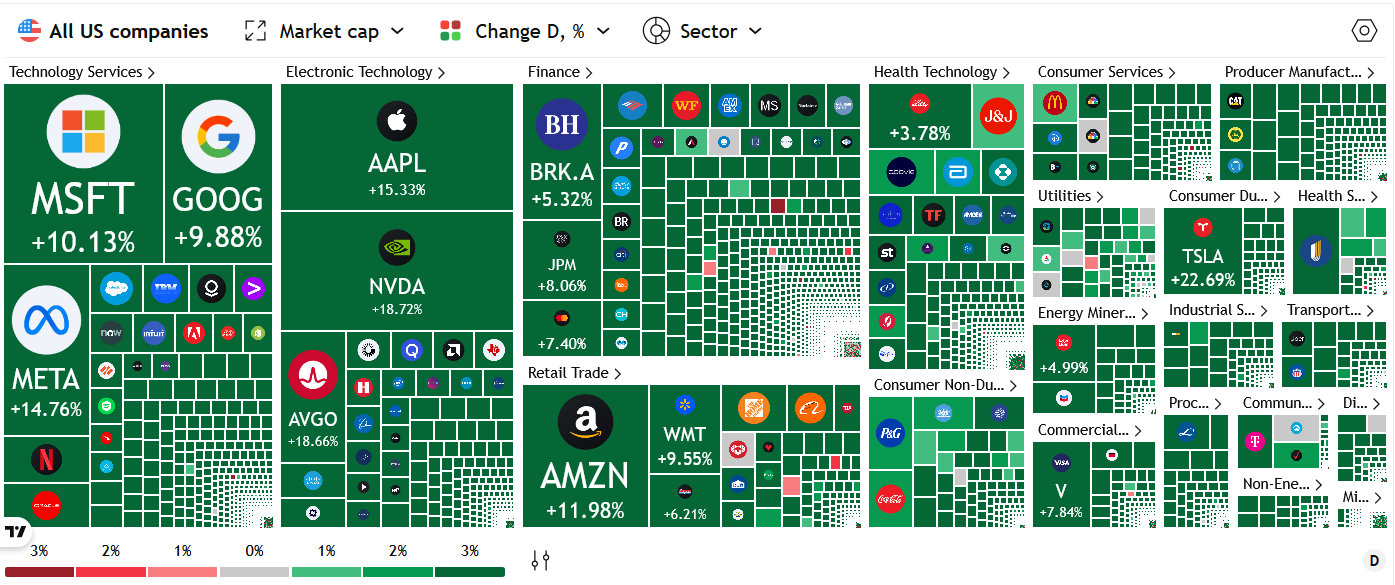
The heatmap below, scaled by market cap, shows the sheer dominance and scale of the buying.
The buying was so astounding that several of my trading positions were taken out at my profit targets, targets I did not expect to hit until next week or so. An entire year’s worth of gains happened in one day. I moved quickly to lock in a lot of gains. They should provide ample buffer for the pullbacks yet to come. This massive oversold rebound provides a fresh reminder on how and why trading rules can be so effective.
With my short-term trading call still at buy, I will look to buy pullbacks while trying to avoid earnings reports. (See “Tariff Crash Trading Plan: Chaos Edition – The Market Breadth” for ideas on how to avoid chasing oversold bounces). Note I held all of my “disaster” put spread hedges.
The volatility index (VIX) finally voted in support of a sustainable low. The VIX plunged 36% with a massive unwind of fear. As a reminder, a volatility implosion is a classic indicator of a sustainable low. This implosion is even more encouraging since the VIX stopped in near picture-perfect fashion just short of last summer’s intraday (and also historic) high.
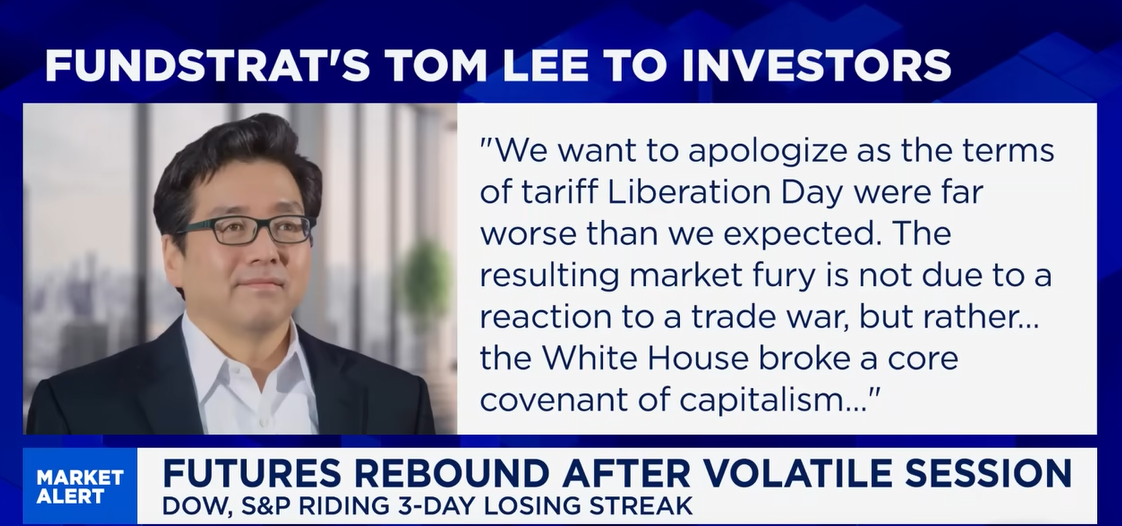
Finally, in a fascinating display of humility, permabull Tom Lee acknowledged yesterday how he underestimated the potential risks from tariff policies. The market’s rolling tariff crash reflects Lee’s sentiment and how the U.S.’s aggressive tariff policies caught so many off-guard. And of course I was caught off guard by the market’s surprise.
The Equities: Rejoice
iShares 20+ Year Treasury Bond ETF (TLT)
TLT sold off sharply for two straight days and gapped lower at the open. As I noted earlier, the bond market sell-off, with rising yields, caught policy makers’ attention and was at least a partial forcing function for the blink on tariffs. Note how TLT remains lower than the day the bond market celebrated Scott Bessent’s emergence as the candidate for U.S. Treasury secretary. TLT gained 0.6% on the day. I will continue to fade TLT rallies, but I will wait longer before making my first move.
Delta Air Lines (DAL)
DAL delivered a stunning 23.4% post-earnings rally despite a prior earnings warning that triggered a 7.3% loss. The rebound surged right into 20DMA resistance as DAL returned to its close the day of the earnings warning. The CEO suspended guidance due to economic uncertainty but stated business conditions remain strong, though below last year’s levels.
DAL provided a textbook example of the market pricing in bad news, remaining holders standing firm, and buyers stepping into the vacuum left by exhausted sellers.
Delta is also a very visible source of information on how executives may position their companies and guidance for the current economic chaos and uncertainty. Delta chose to put on a brave face even while admitting to the challenges ahead. From the earnings transcript:
“Obviously, in this environment, there is not a lot you can say in the next year or two without having some better clarity as to how the tariff skirmishes end up. But what I can tell you is that for the last 20 years every time that we’ve had any level of economic dislocation, Delta has been advantaged…We are not quite sure how long it’s going to be, but I’m confident that it’s not going to be elongated. And you can expect that the strong will get stronger…
it’s hard to know how this is going to play out, given that this is somewhat self-imposed. And I’m hopeful that that sanity will prevail and we’ll move through this period of time on the global trade front relatively quickly. But we’re prepared in any event to make sure that we protect Delta through this.”
On markets impacted by tariffs:
“In Canada, we have seen a significant drop-off in bookings. In Mexico, it is kind of a mixed bag. Some of the markets are performing better, some are performing worse…I think we will be looking at Canada and Mexico as places that we probably want to reduce our capacity levels as we move forward.”
Finally, on who will end up paying for tariffs on imports:
“…we are working very closely with Airbus, which is the only airline we’ve got deliveries coming from — for the balance of this year…We’ll do our very best to see what we have to do to minimize tariffs. But the one thing that you need to know we are very clear on is that we will not be paying tariffs on any aircraft deliveries we take. These times are pretty uncertain. And if you start to put a 20% incremental cost on top of an aircraft, it gets very difficult to make that math work. So we’ve been clear with Airbus on that and we’ll work through and see what happens from that.”
Be careful out there!
Footnotes
Subscribe for free to get email notifications of future posts!
“Above the 50” (AT50) uses the percentage of stocks trading above their respective 50-day moving averages (DMAs) to measure breadth in the stock market. Breadth defines the distribution of participation in a rally or sell-off. As a result, AT50 identifies extremes in market sentiment that are likely to reverse. Above the 50 is my alternative name for “MMFI” which is a symbol TradingView.com and other chart vendors use for this breadth indicator. Learn more about AT50 on my Market Breadth Resource Page. AT200, or MMTH, measures the percentage of stocks trading above their respective 200DMAs.
Active AT50 (MMFI) periods: Day #5 under 20% (oversold), Day #11 under 30%, Day #30 under 40%, Day #42 under 50%, Day #69 under 60%, Day #170 under 70%
Source for charts unless otherwise noted: TradingView.com
Full disclosure: long SPY shares, long SPY put spread, long IWM call, long VXX puts, long JPM call spread
FOLLOW Dr. Duru’s commentary on financial markets via StockTwits, BlueSky, and even Instagram!
*Charting notes: Stock prices are not adjusted for dividends. Candlestick charts use hollow bodies: open candles indicate a close higher than the open, filled candles indicate an open higher than the close.
* Blog notes: this blog was written based on the heavily edited transcript of the following video that includes a live review of the stock charts featured in this post. I used ChatGPT to process the transcript.
The Delta-Airbus disconnect is a perfect example of abrupt changes in tariffs destroying previously healthy business relationships. Go ahead, Delta, force Airbus to take all the losses instead of sharing the pain, and see how that works out for you when you try to buy from Boeing.
Exactly! I was quite surprised to read their confidence in being able to pass the hat right back to Airbus!