Stock Market Commentary
A DeepSeek dive stole the headlines from the Federal Reserve. At the same time, tariff headlines refused to go away. Assuming you have already gotten your fill of DeepSeek headlines, I will just summarize the drama by saying a Chinese start-up has apparently completely up-ended the economics of the AI universe. DeepSeek’s more economic approach to AI inference suggests that massive projections for chips, computer hardware, and power plants may have been too aggressive. This story is just getting started and should humble all of us away from making bold predictions about a future that is subject to change at a moment’s notice. The stock market took notice, and anything even adjacent to AI got crushed at the open of Monday’s trading.
The market next had to contend with another monetary policy decision from the Federal Reserve. Overall, the meeting was a nothing burger. The DeepSeek dive still had a firm grip on the market’s attention. (I will write a brief note on the Fed meeting on Inflation Watch).
Throughout the week, the buzz over tariffs got louder and louder; welcome back to the age of policymaking and execution via social media. After numerous conflicting messages, by Friday, major tariffs against Canada, Mexico, and China seemed assured. I am surprised the tariff toll equated to a small reversal on Friday. Hope springs eternal? At the time of writing, the tariffs are officially signed and ready to launch on February 4th. The tariffs include a 25% levee against goods imported from Mexico and Canad and 10% against China. Canadian oil only gets a 10% tariff. There is even an escalation clause for responding to retaliation. Thus, this economic warfare could get a lot worse before it gets better. I will be astounded if the stock market survives next week without a major sell-off (NOT a crash though).
The Stock Market Indices
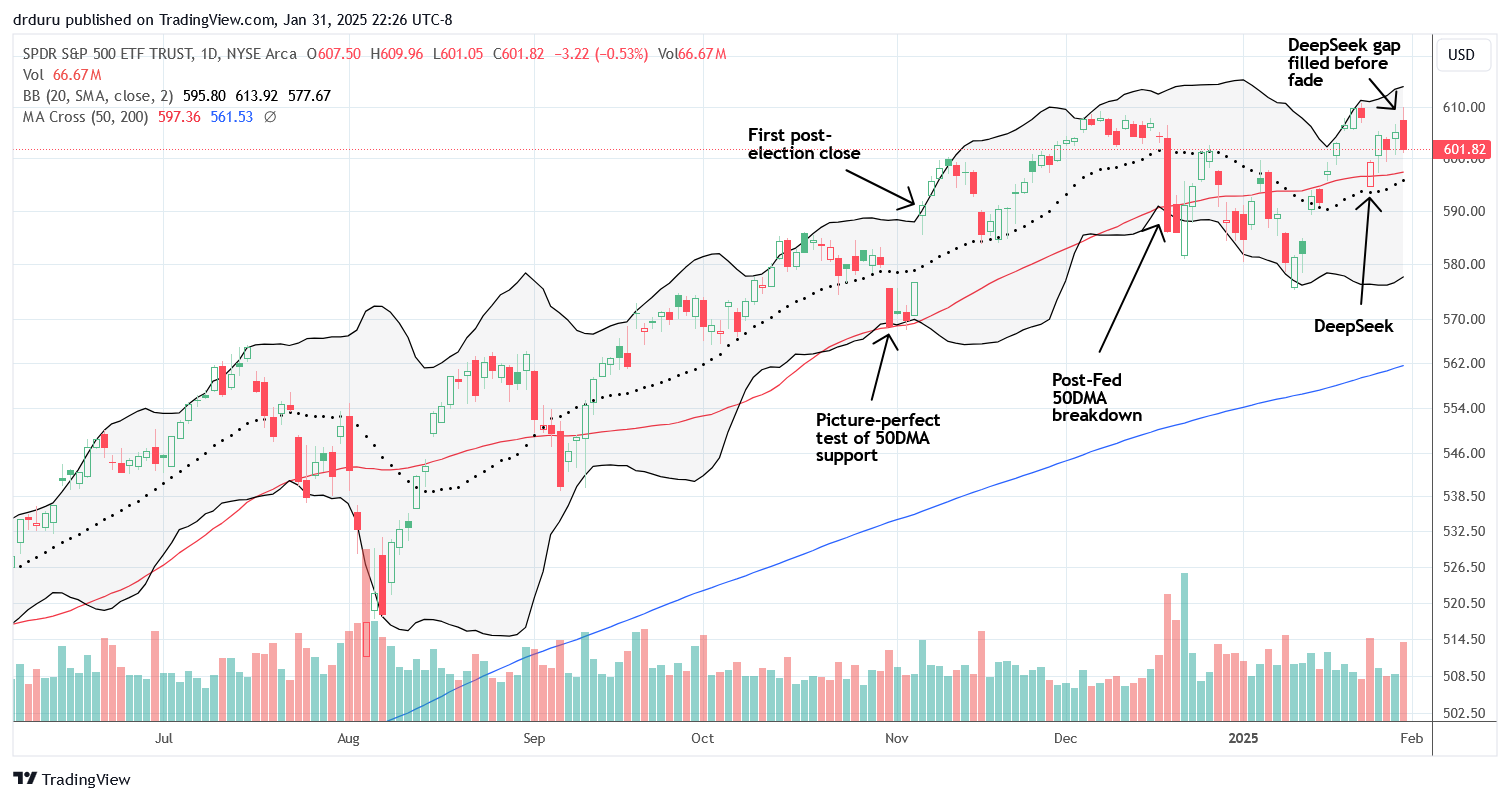
The S&P 500 (SPY) rallied nearly straight up from oversold enough levels to the all-time high that sealed the deal on confirming oversold enough. And then the DeepSeek dive hit. The S&P 500 (SPY) gapped down on Monday’s open by 2.2%. Given my short-term (cautiously) bullish trading call and the extreme nature of the reaction, I bought SPY calls after the index pushed off 20DMA (dashed line) support and above its 50-day moving average (DMA) (the red line). I took profits the next day. On Wednesday’s Fed day, the S&P 500 lost 0.5%; the Fed had no good news and no new news for markets. The tariff headlines loomed in the background until reaching a crescendo on Friday. As soon as the S&P 500 tapped its all-time closing high and filled its gap from the DeepSeek dive, sellers stepped in and voted for a 0.5% loss on the day.
Given the headlines, I am surprised the index is around all-time highs, much less able to get away with minimal losses. The S&P 500 is even still above its 50DMA and technically remains in bullish position. Moreover, it gained a healthy 2.7% for the month of January.
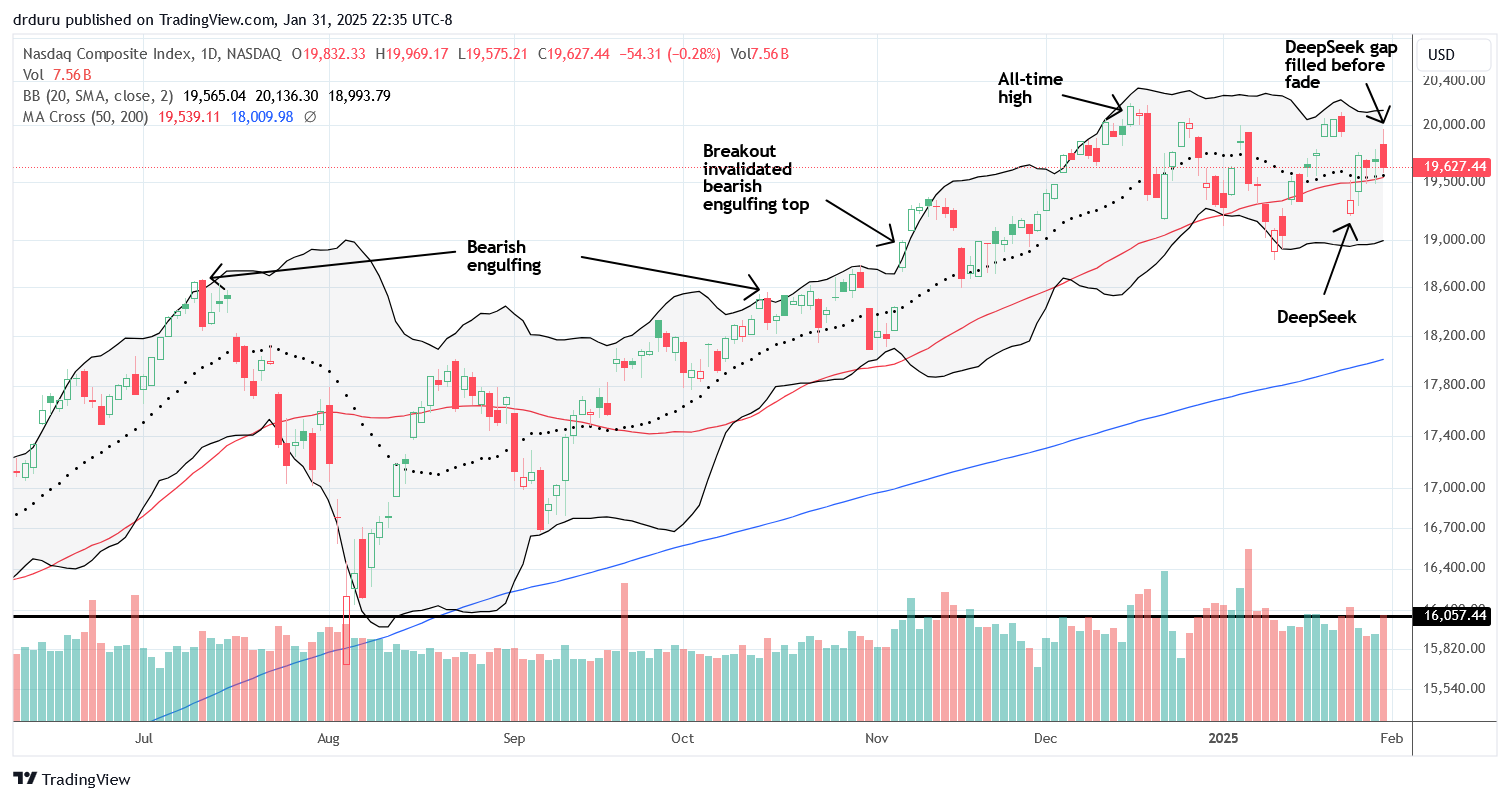
The NASDAQ (COMPQX) followed the same journey as the S&P 500. However, the gap fill for the tech-laden index left behind an “abandoned” three days of trading right at the all-time high. Thus, the NASDAQ is looking toppy all over again despite holding on to 50DMA support. In the short-term, I would only get officially bearish on the NASDAQ after it closed below January’s low. The NADAQ gained 1.6% for the month.
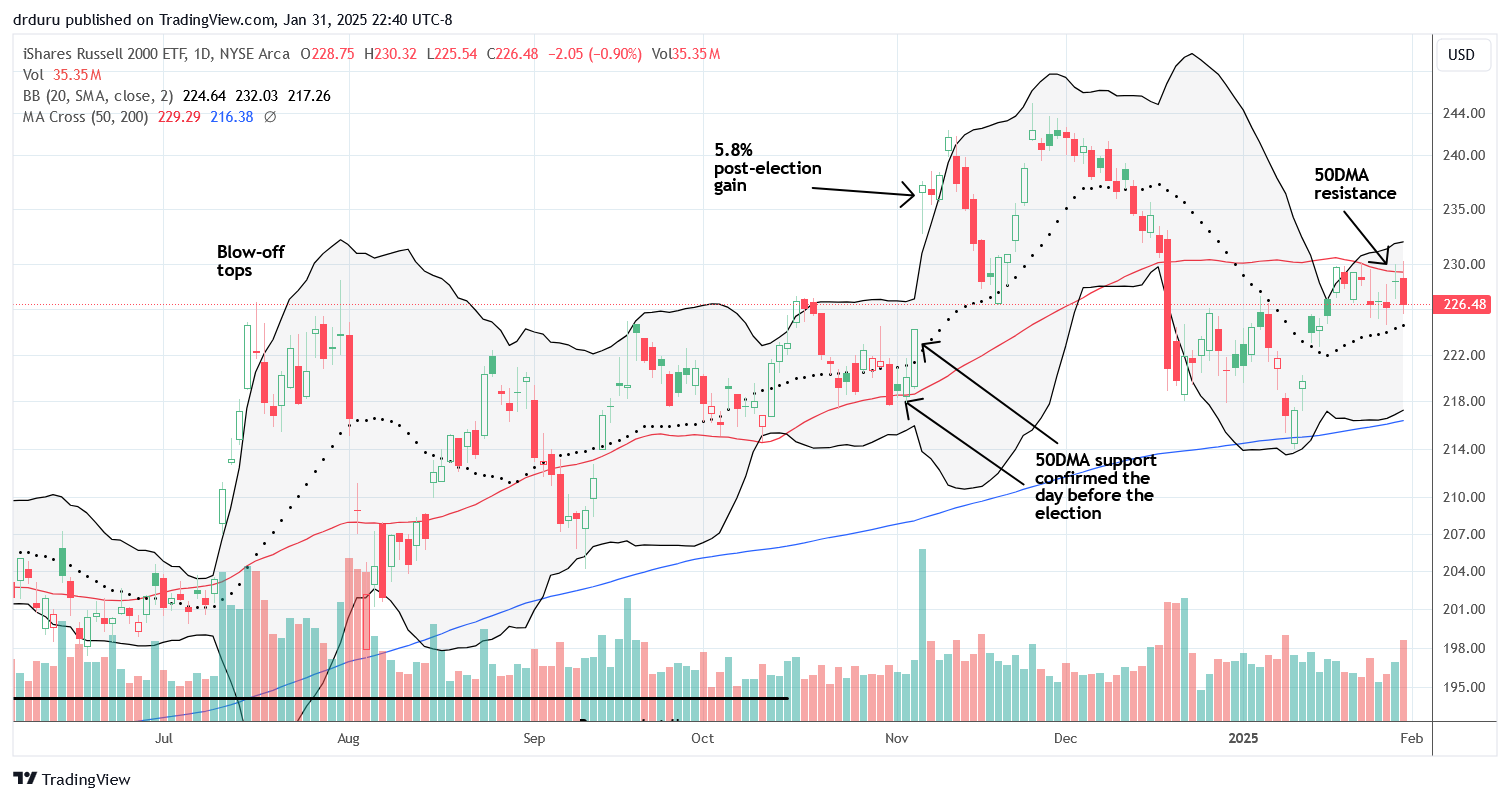
The iShares Russell 2000 ETF (IWM) managed to gain 2.6% for the month despite a 2-week struggle to break out above resistance at its 50DMA. Support at the 200DMA saved the ETF of small caps from an ugly start to the year. I am waiting to buy a next round of weekly call options after a 50DMA breakout and/or retest of 200DMA support. IWM should be least impacted by a tariff toll, but we will see.
The Short-Term Trading Call After A DeepSeek Dive
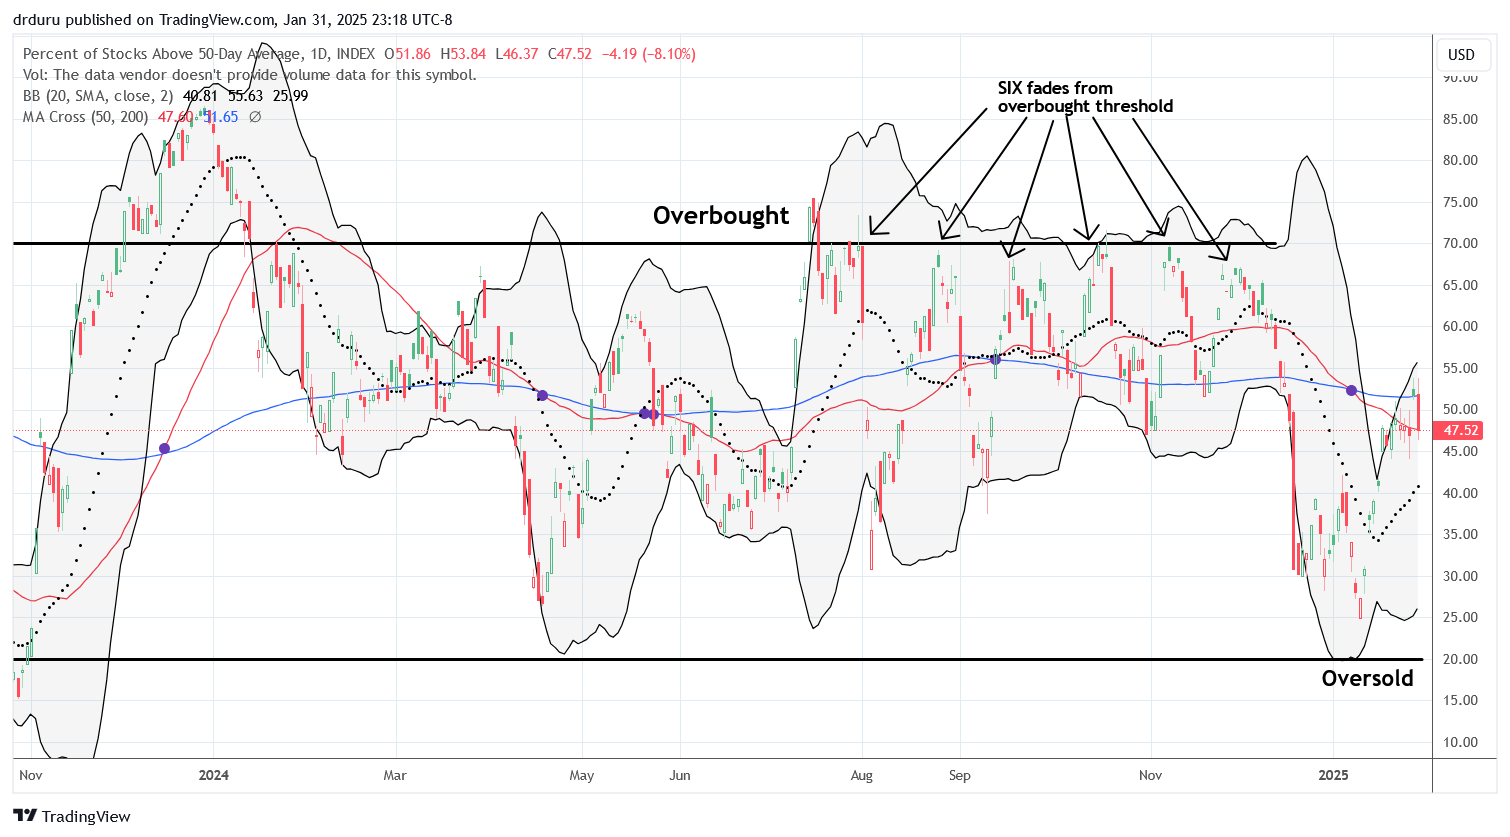
- AT50 (MMFI) = 47.5% of stocks are trading above their respective 50-day moving averages
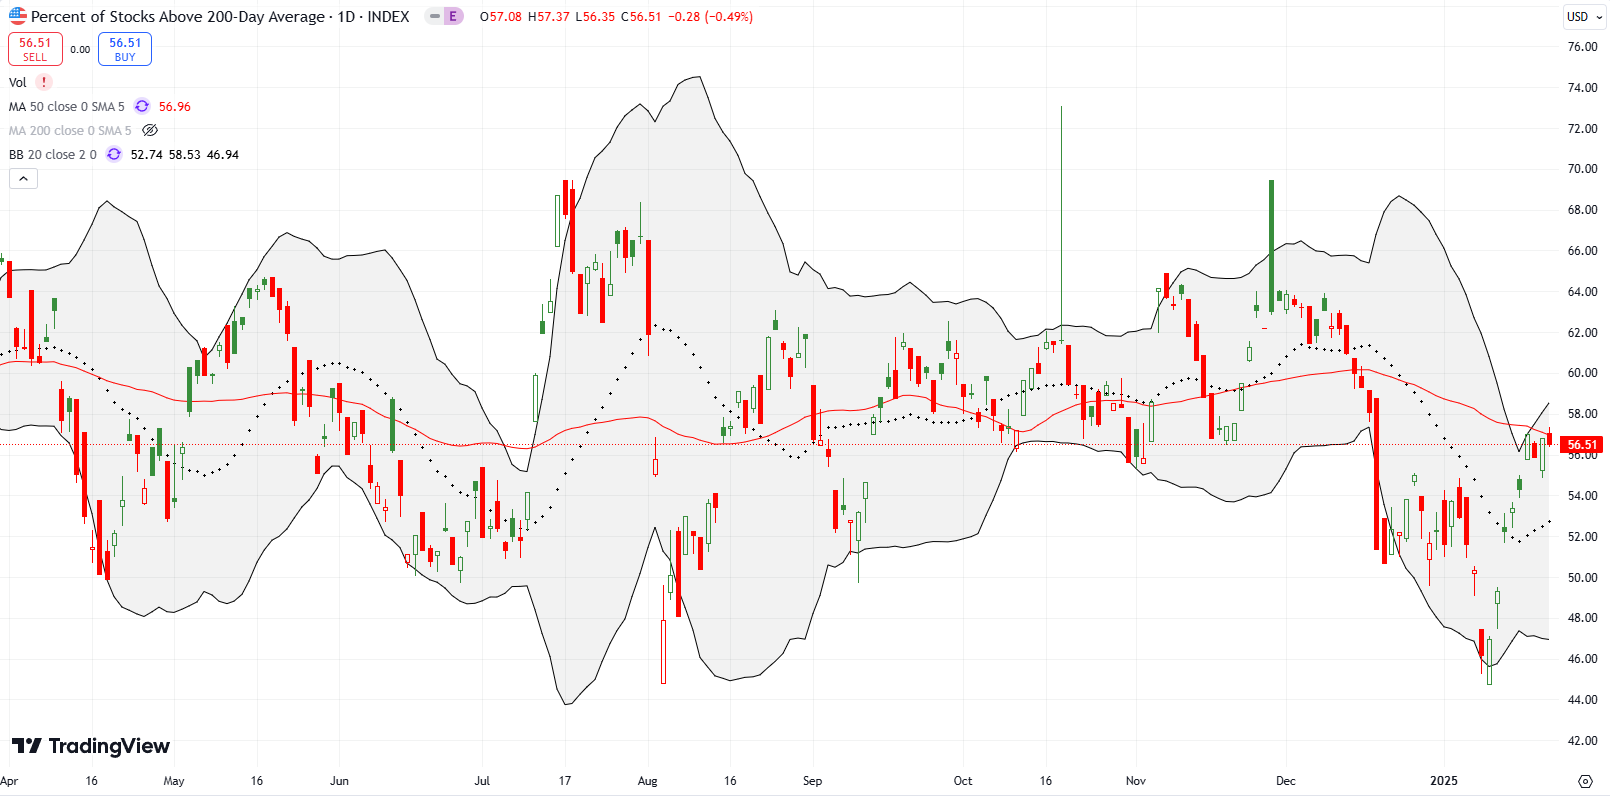
- AT200 (MMTH) = 55.3% of stocks are trading above their respective 200-day moving averages
- Short-term Trading Call: neutral
AT50 (MMFI), the percentage of stocks trading above their respective 50DMAs, closed the week at 47.5%. Friday’s sharp pullback reversed the previous day’s surge. Thursday’s jump in market breadth left me thinking both the S&P 500 and the NASDAQ were ready to resume their respective pushes for fresh all-time highs. It looked like the DeepSeek dive was already a panic in the rear view mirror and that no one cared about the imminent tariffs. Instead, Friday’s toppy price action forced me to go neutral on the short-term trading call. I highly doubt I will go bullish again on this market until the next oversold period…or at least that is my current plan!
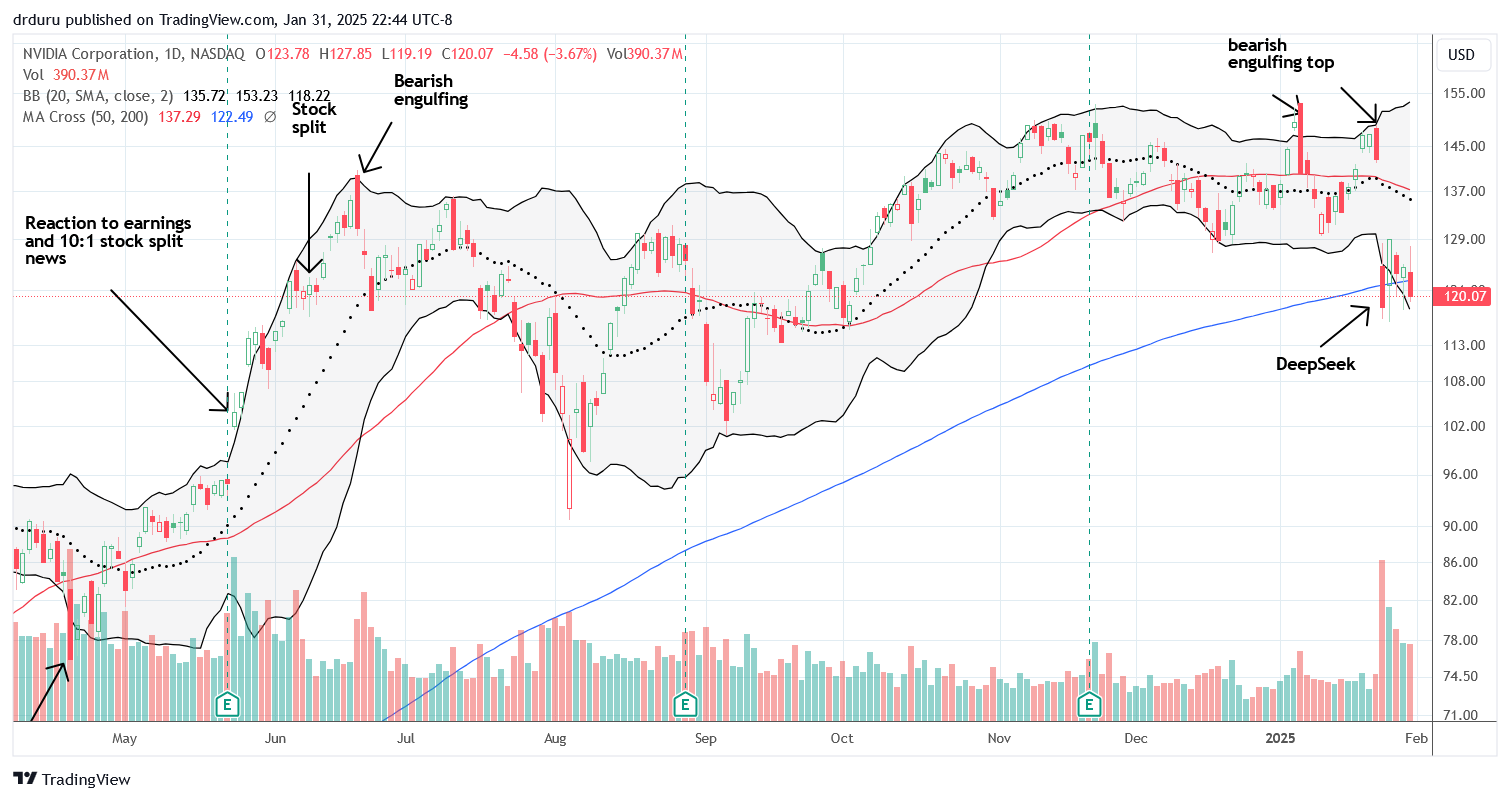
NVIDIA Corporation (NVDA) is ground zero for the DeepSeek Dive. The semiconductor company makes critical chips at the center of the AI universe. Accordingly, the promise of a significant reduction in computing needs for DeepSeek’s AI model took NVDA down 17.0%. Sellers were panicked enough to slice NVDA right through 200DMA support. A valiant 8.9% relief rally the next day failed to save the stock from follow-up selling. NVDA ended the week in a fresh bearish position closing below its 200DMA. Even more ominous are the double bearish engulfing top patterns NVDA just left behind. As I suggested in my video technical review of the AI carnage, NVDA looks like it will take many months to set its next all-time high. If the DeepSeek dive holds, NVDA may have set its last all-time high for quite some time to come…
The calendar put spread I mentioned in the video closed out on Friday with a profit. I was actually hoping to go into the coming week holding the long side of the spread.
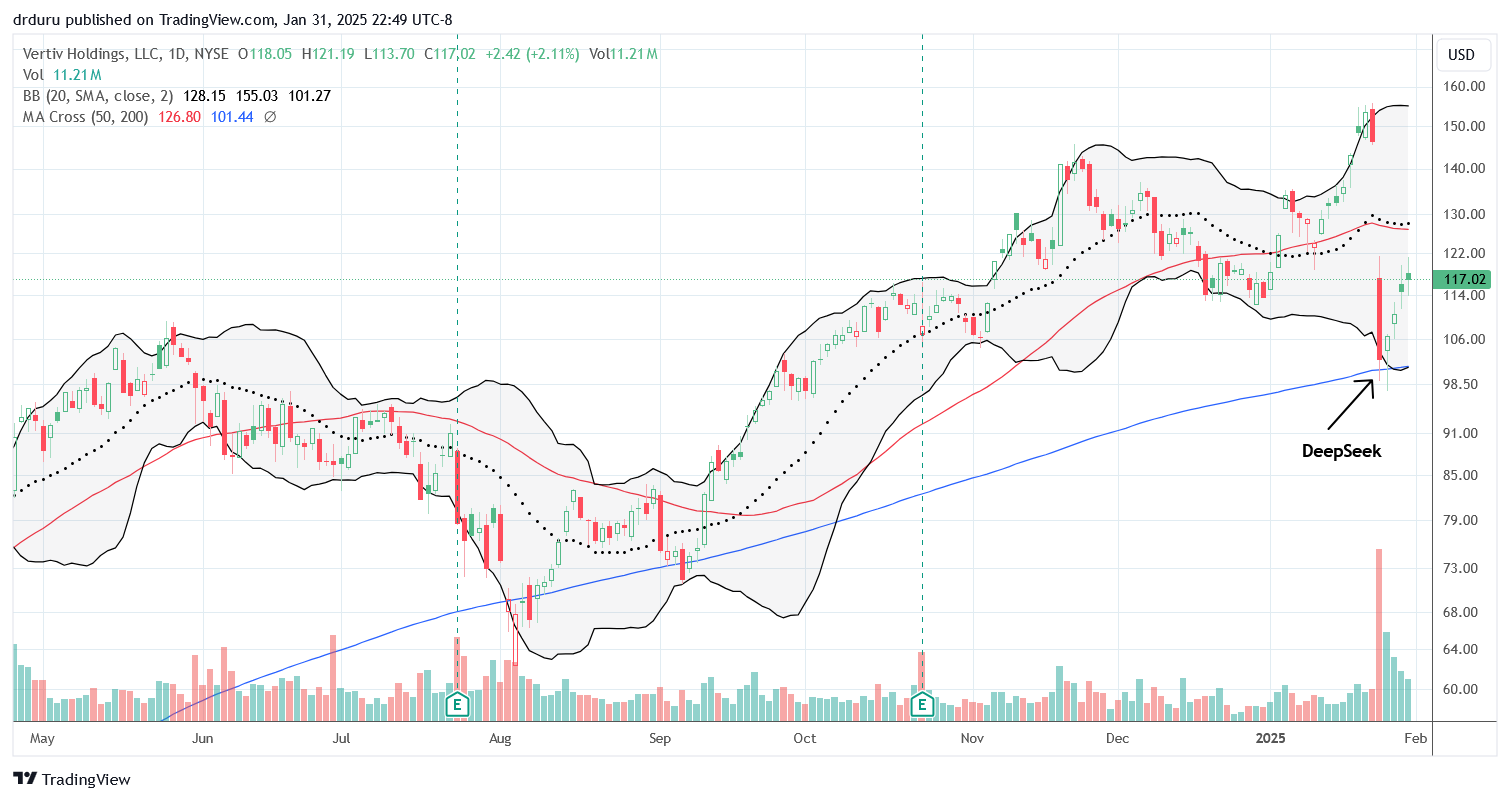
Some AI-related stocks were able to sustain recoveries in the wake of the DeepSeek dive. My favorite, AI infrastructure company Vertiv Holdings, LLC (VRT), neatly bounced off 200DMA support. As I explained in my technical review of the AI carnage, I sold a weekly put option into the DeepSeek panic. That trade worked out perfectly. Now I face the question of whether to buy back into shares. Ironically, right before the AI carnage, I wrote about how I took profits on my position at the last low. VRT closed the week right around where I sold my position.
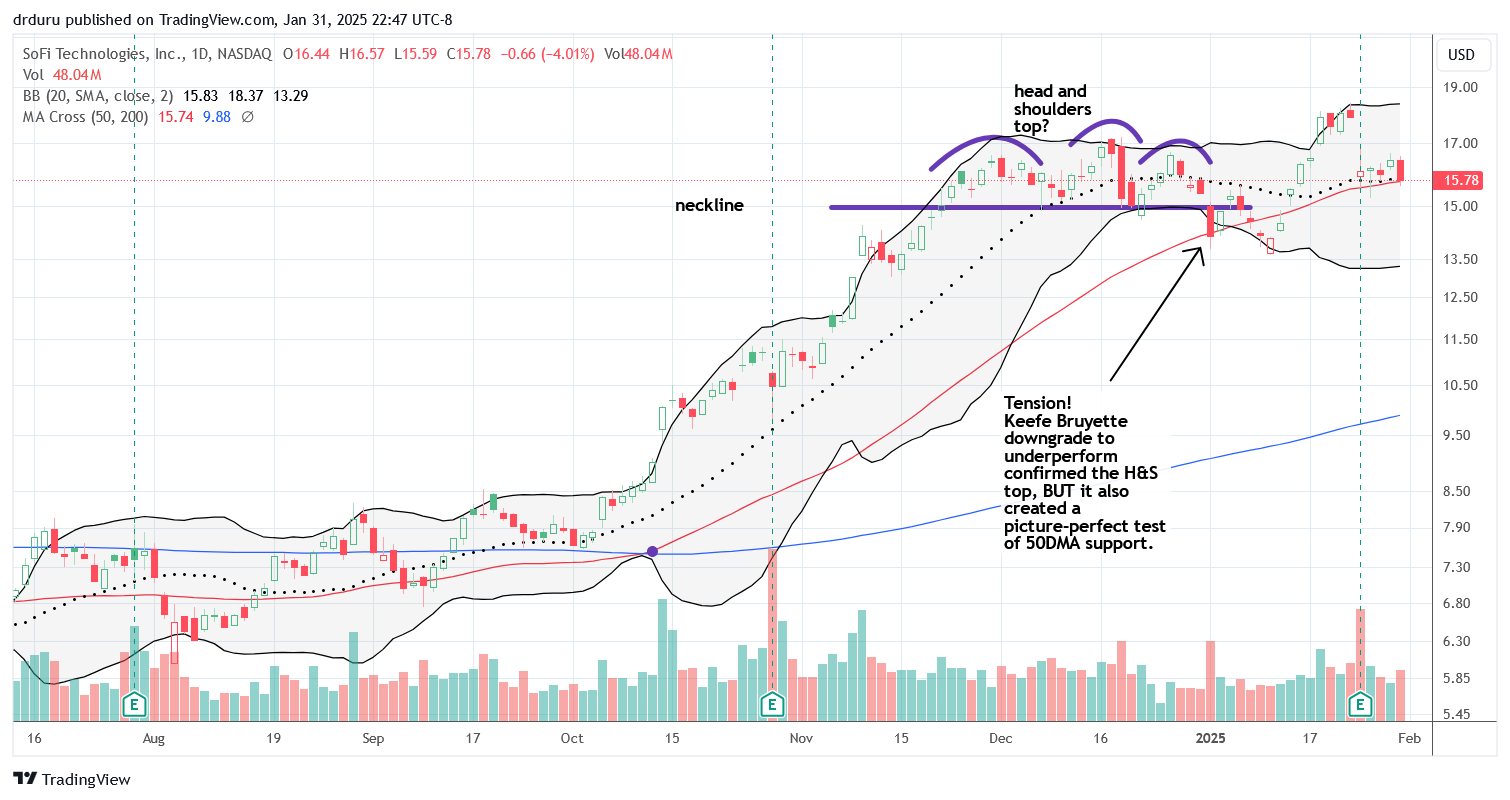
In early January, I talked about the topping pattern in SoFi Technologies, Inc (SOFI). The stock flipped bullish after closing above the neckline of the head and shoulders pattern. The bullishness was further strengthened by a 50DMA breakout and a subsequent close above the entire H&S topping pattern. With earnings so close, I decided not to trade it. I missed a nice pre-earnings run-up. I also missed the agony of watching all that profit evaporate with a 10.3% post-earnings loss. SOFI is currently holding on to 50DMA support. A close above Friday’s high finally gets me back into SOFI and hopefully I can hold at least until the next earnings announcement.
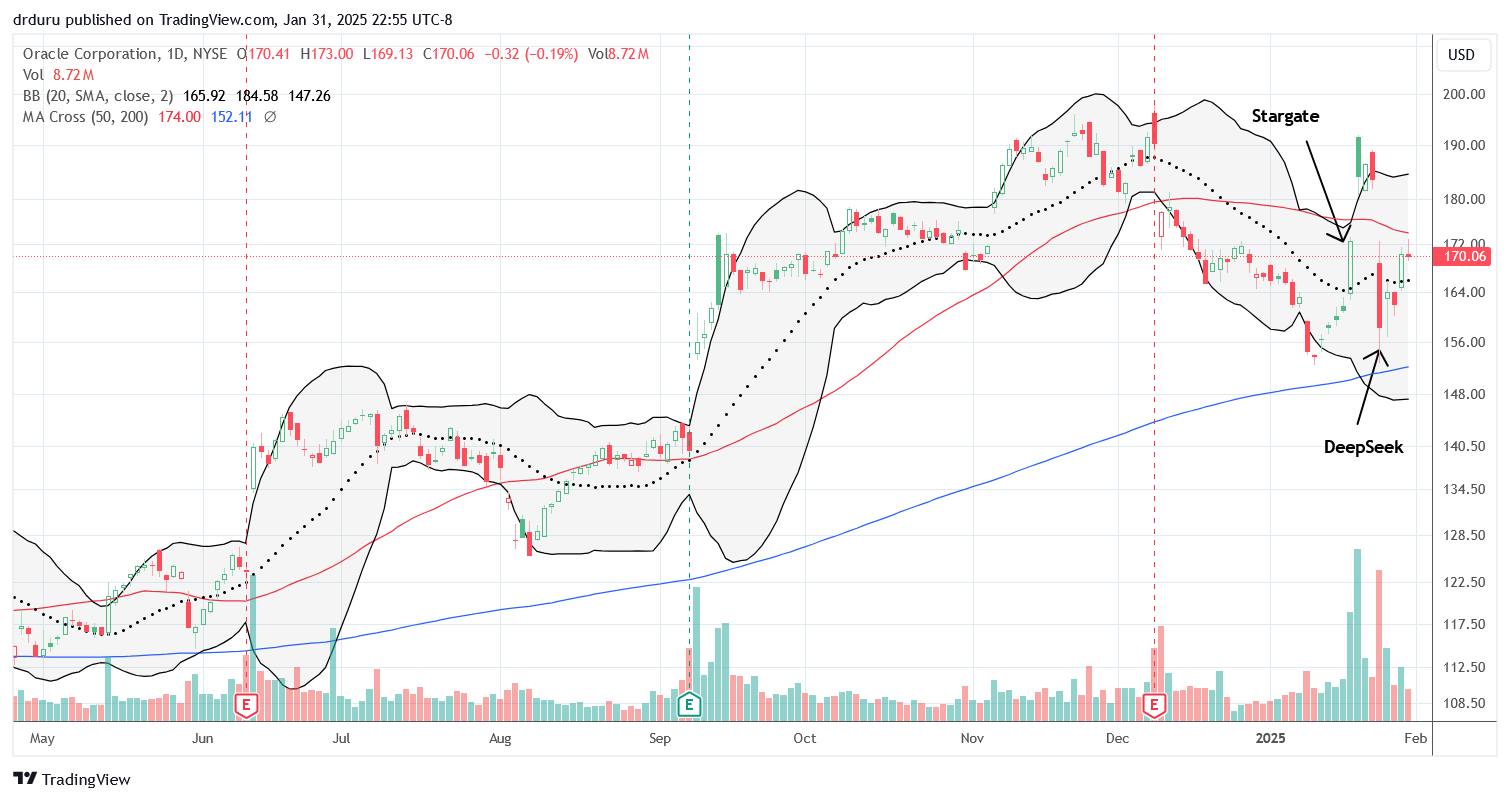
When I wrote about database software company Oracle Corporation (ORCL) in the wake of Stargate and ahead of the DeepSeek dive, I made the case for buys on the dip. At the time, I was thinking of tests of 50DMA support. The DeepSeek dive gapped ORCL well below its 50DMA and almost tested 200DMA support. ORCL ended the week short of 50DMA resistance and now trades in a no-man’s land. At the moment, I cannot envision a scenario for buying ORCL…
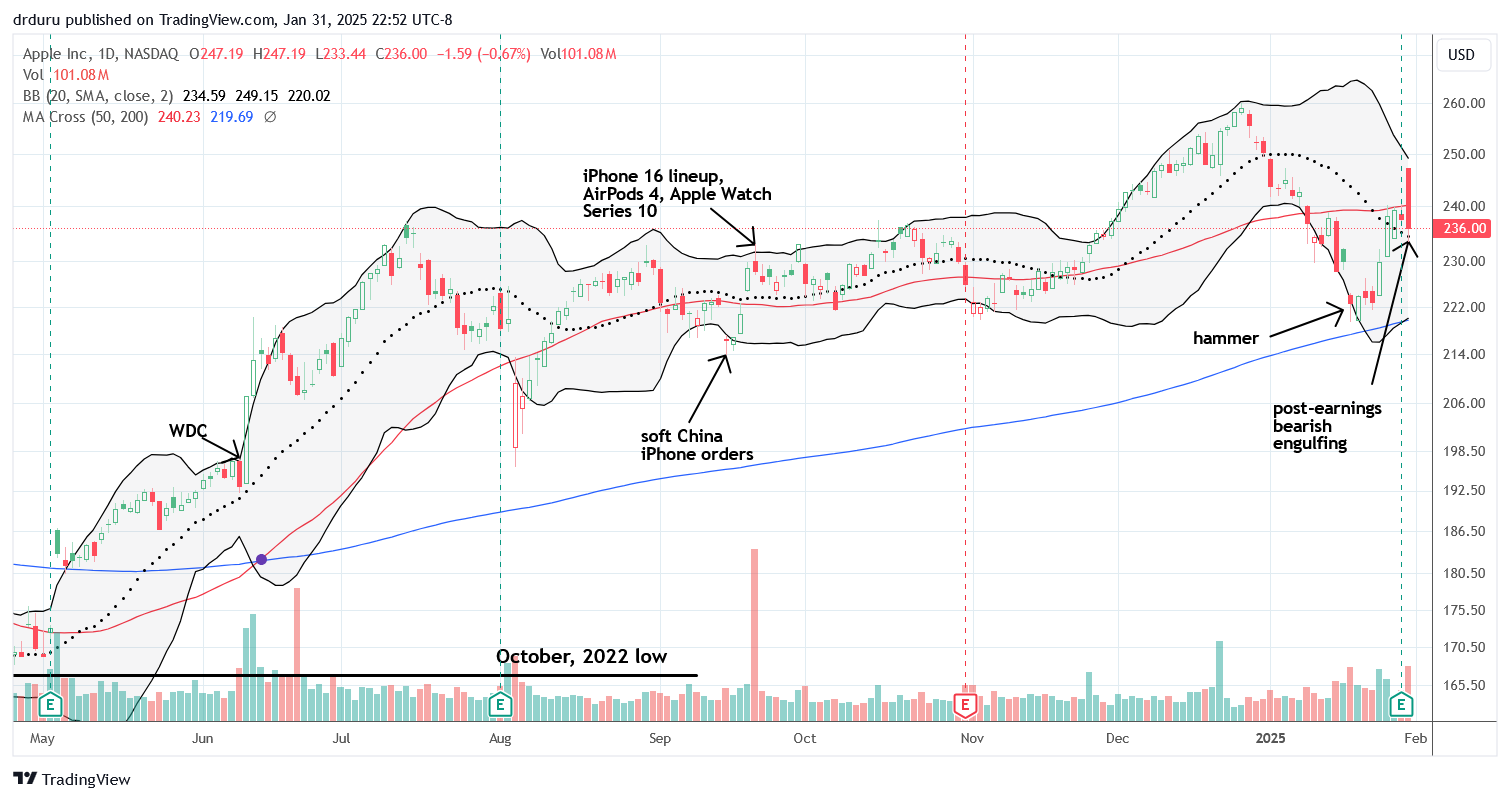
The hammer bottom and setup on Apple Inc (AAPL) worked out perfectly. I took profits on my call spread early Monday as I felt fortunate AAPL survived the DeepSeek dive. I could have held on for my upside scenario of a test of 50DMA resistance before earnings.
Earnings brought a lot of confusing price action. In the after hours CNBC reported AAPL was down and then it rebounded. At the open, AAPL gapped higher a healthy 4.0% before fading under 50DMA support. The 0.7% loss on the day stopped at 20DMA support. Something tells me AAPL will be stuck churning for some time to come.
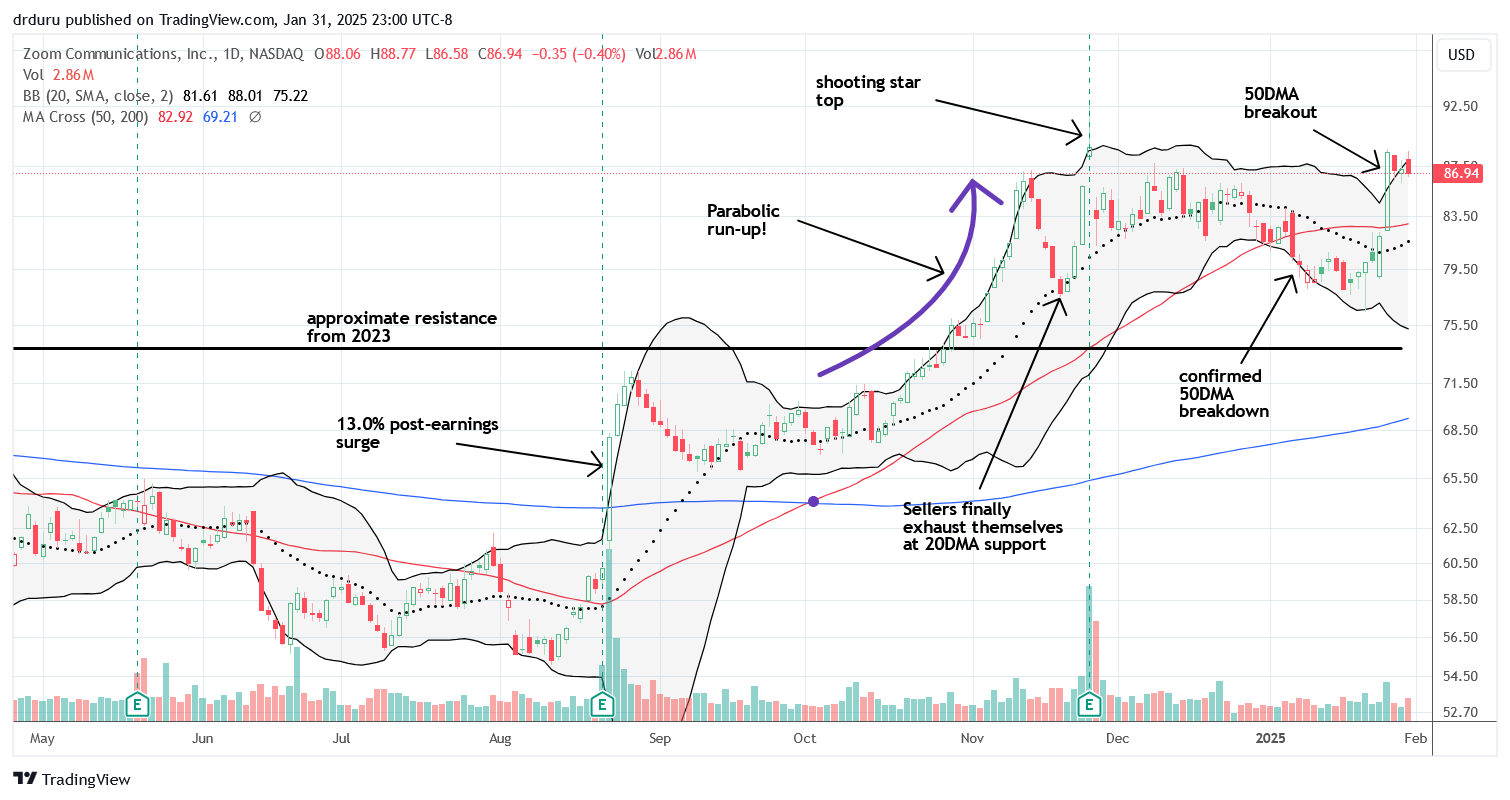
The bearish tidings on Zoom Communications, Inc (ZM) ended last week. I could not find any news to explain the sudden surge in interest, but I rushed anyway into a call spread soon after ZM sliced through 50DMA resistance. The buying came to a screeching halt after that day’s 8.1% gain. It’s a surreal picture. Now ZM needs to invalidate the shooting star top left behind by the last earnings report.
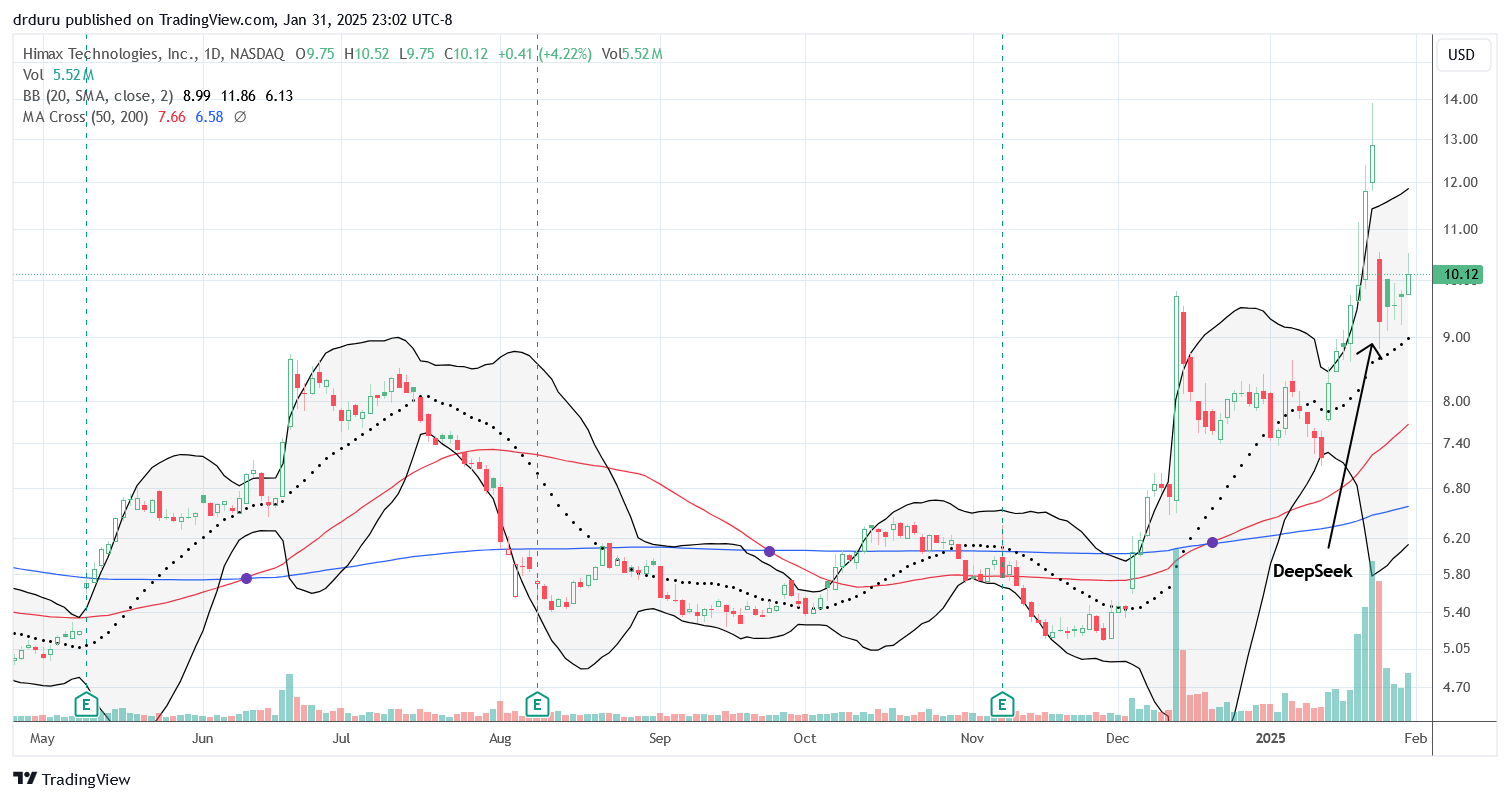
Fabless semiconductor company Himax Technologies, Inc (HIMX) was another stock that I analyzed right before it got crushed by the DeepSeek dive. The 27.8% sell-off seemed extreme enough to warrant buying shares. So far, so good.
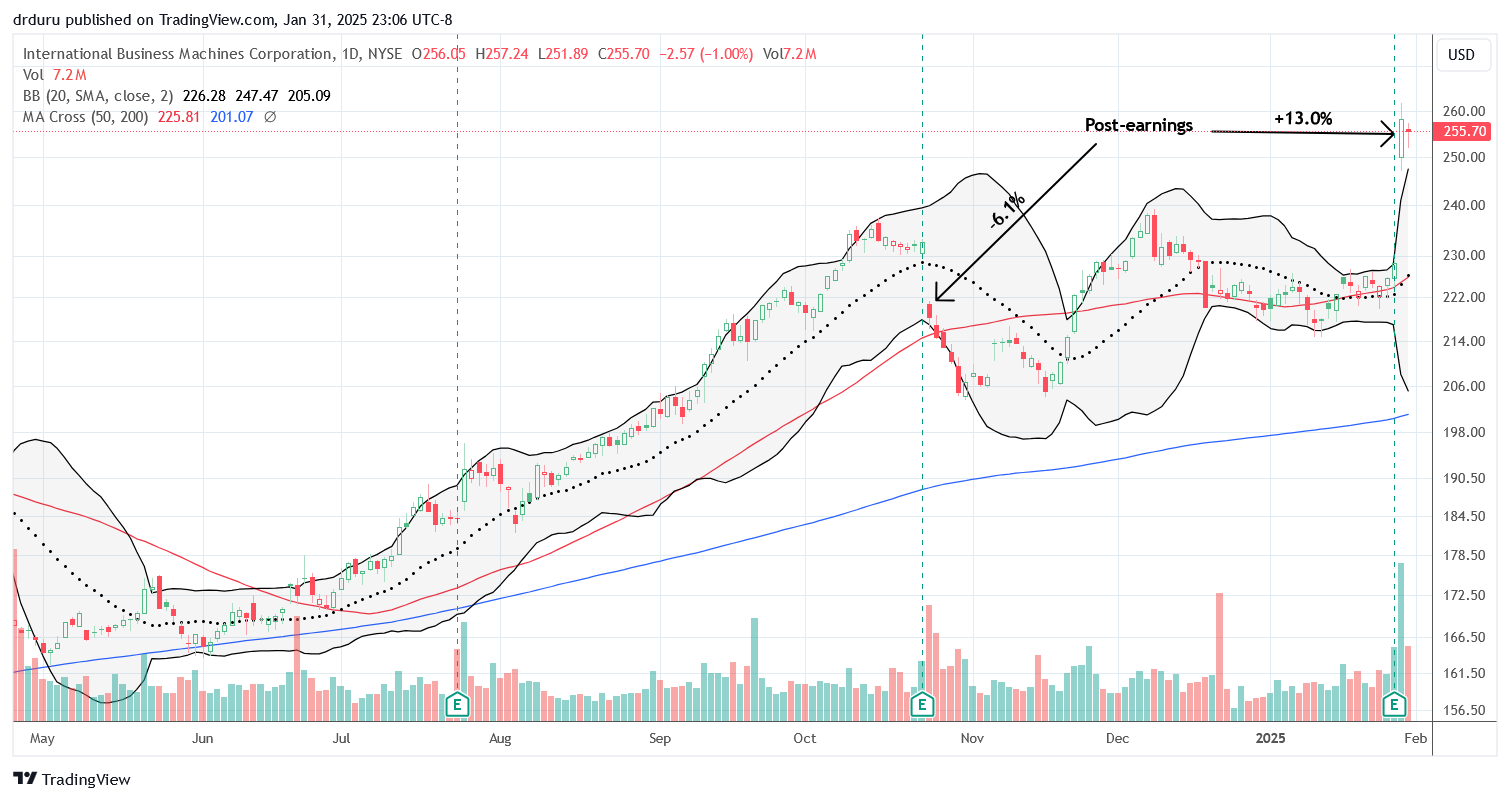
International Business Machines Corporation (IBM) is in my list of AI-related stocks, but the stock slipped by my earnings radar. The first good sign was Monday’s minimal 0.3% loss in the week of the DeepSeek dive. IBM held converged 20 and 50DMA support from there. The 13.0% post-earnings surge is a stark contrast to the 6.1% loss following the previous earnings report. Note that IBM eventually reversed that loss in December – another good sign ahead of the next earnings report. IBM is a buy the dips from here.
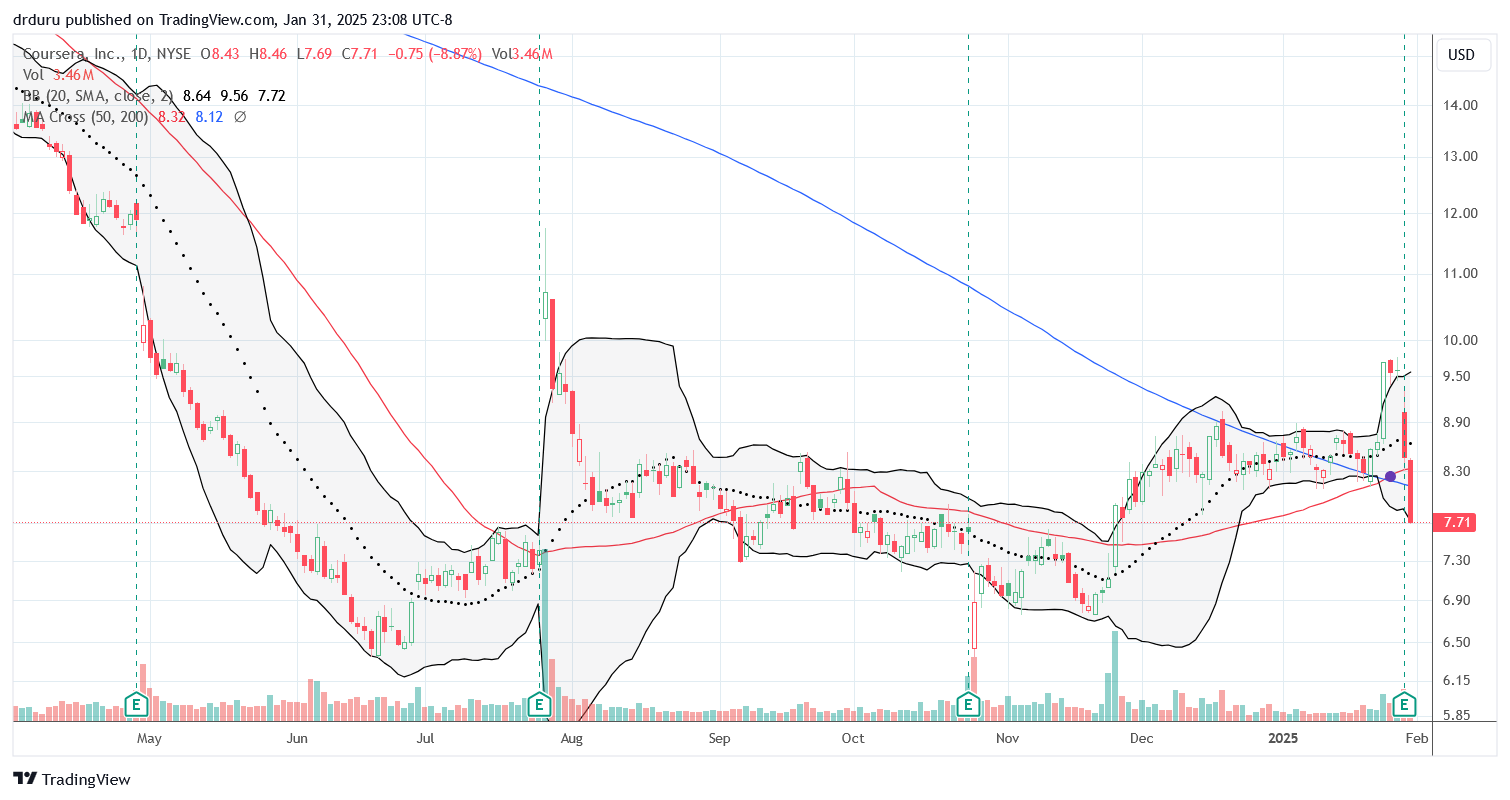
I was hopeful after buying Coursera, Inc (COUR) in early December. I even held back my trade trigger finger after a 12.0% pre-earnings surge. COUR proceeded to disappoint from there. I held shares after the post-earnings 11.7% loss. However, I had to bail in order to preserve my remaining minimal profits after follow-on selling took COUR below both 50DMA and 200DMA support.
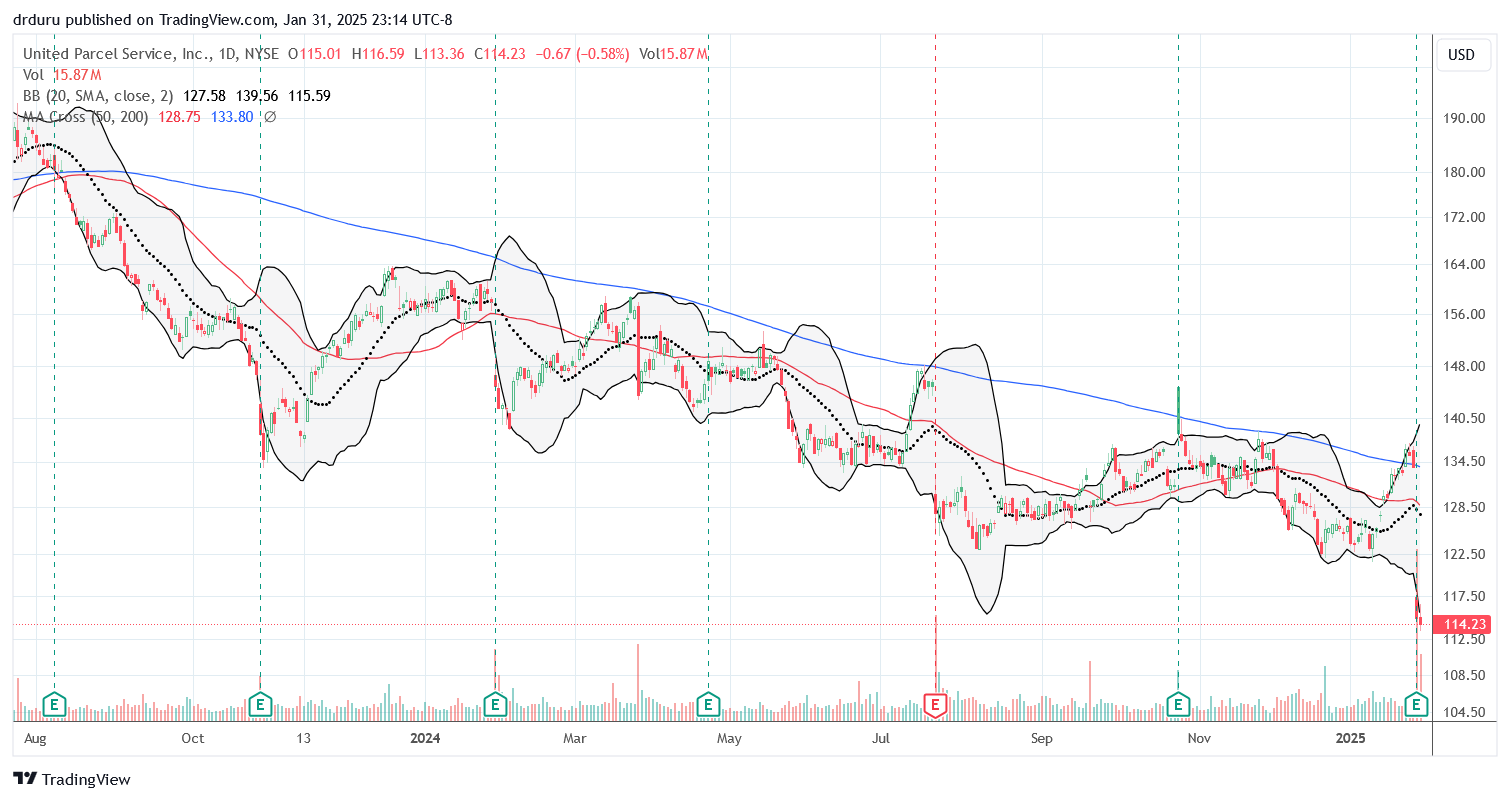
United Parcel Service, Inc (UPS) is a hard stock and company to understand. E-commerce is on fire and packages are piling up on front porches. Yet, UPS peaked in 2022 and has been declining ever since. Last week, UPS plunged 14.1% post-earnings and reached an incredible 4 1/2 year low. A major adjustment in UPS’s relationship with AMZN caused market angst despite the CEO’s reassurances. From the Seeking Alpha transcript of the conference call:
“Amazon is our largest customer, but it’s not our most profitable customer. Its margin is very dilutive to the U.S. domestic business. Our contract with Amazon came up this year, and so we said it’s time to step back for a moment and reassess our relationship, because if we take no action, it will likely result in diminishing returns. So we considered a number of different options and landed on what we think is the best option for our company, and that is to accelerate the glide down of their volume with us, as we commented in our prepared remarks, by more than 50% by June of 2026…as we glide down the volume, we will also be gliding out those assets and resources which gives us the margin expansion that we’ve explained.”
So less revenue and more profit. Something tells me this is a final flush for UPS, but I dare not even think about stepping into UPS until it ends the major downtrend marked by the declining 200DMA .
Be careful out there!
Footnotes
Subscribe for free to get email notifications of future posts!
“Above the 50” (AT50) uses the percentage of stocks trading above their respective 50-day moving averages (DMAs) to measure breadth in the stock market. Breadth defines the distribution of participation in a rally or sell-off. As a result, AT50 identifies extremes in market sentiment that are likely to reverse. Above the 50 is my alternative name for “MMFI” which is a symbol TradingView.com and other chart vendors use for this breadth indicator. Learn more about AT50 on my Market Breadth Resource Page. AT200, or MMTH, measures the percentage of stocks trading above their respective 200DMAs.
Active AT50 (MMFI) periods: Day #283 over 20%, Day #4 over 30% (overperiod), Day #16 under 40%, Day #16 under 50%, Day #20 under 60%, Day #121 under 70%
Source for charts unless otherwise noted: TradingView.com
Full disclosure: long SPY put spread, long IWM, long ZM call spread, long HIMX,
FOLLOW Dr. Duru’s commentary on financial markets via StockTwits, BlueSky, and even Instagram!
*Charting notes: Stock prices are not adjusted for dividends. Candlestick charts use hollow bodies: open candles indicate a close higher than the open, filled candles indicate an open higher than the close.

1 thought on “A DeepSeek Dive and A Tariff Toll – The Market Breadth”