Stock Market Commentary
Investopedia defines the Santa Rally very precisely: “A Santa Claus rally refers to the sustained increases found in the stock market during the last five trading days of December through the first two trading days of January.” Based on this definition, Santa is failing…and just as the stock market risks a January sell-off from pent-up desires to lock in capital gains. I think of the rebound going into Christmas as a Santa Rally where traders tried to get ahead of post-Christmas positivity. However, this early Santa Rally failed to fade the Fed fallout from mid-December. That one-day plunge where the market went from euphoria to (quasi) oversold still looms large over the stock market. The stock market needs to recover from this reversal to get back into “full bull” mode. For now, it looks like 2025 is going to start off in tenuous shape.
The Stock Market Indices
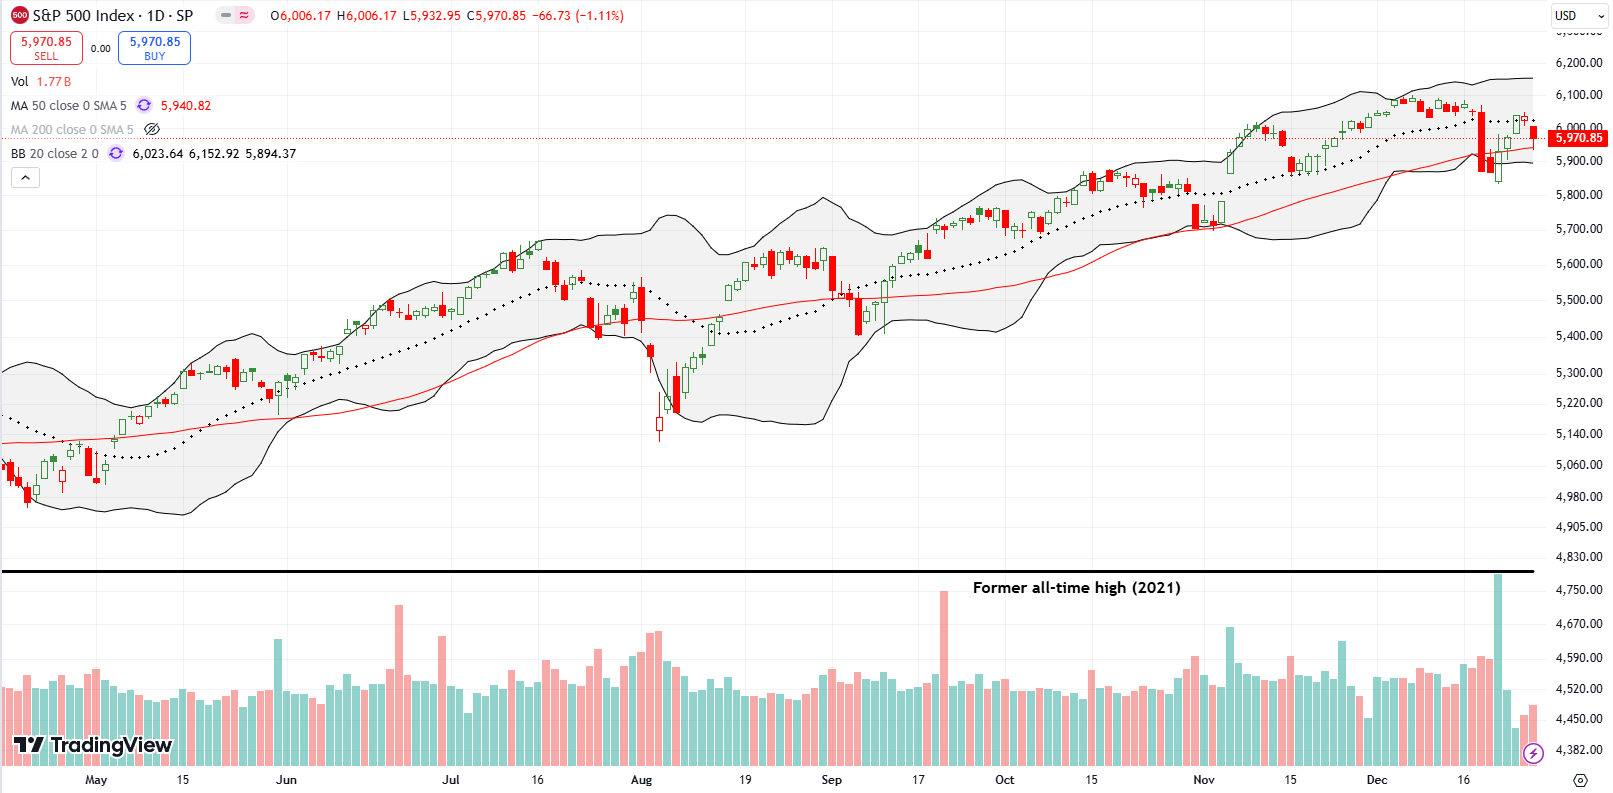
The S&P 500 (SPY) recovered from its breakdown below support at its 50-day moving average (DMA) (the red line) only to get stymied by resistance at its 20DMA (the dotted line). Friday’s fade of the late Santa rally pushed the index right into a fresh test of 50DMA support. The S&P 500 lost 1.1% after bouncing off 50DMA support. This price action is toppy and a very poor way to go into 2025. A close below the last 50DMA breakdown will generate a bearish warning…and a very new tone to the market.
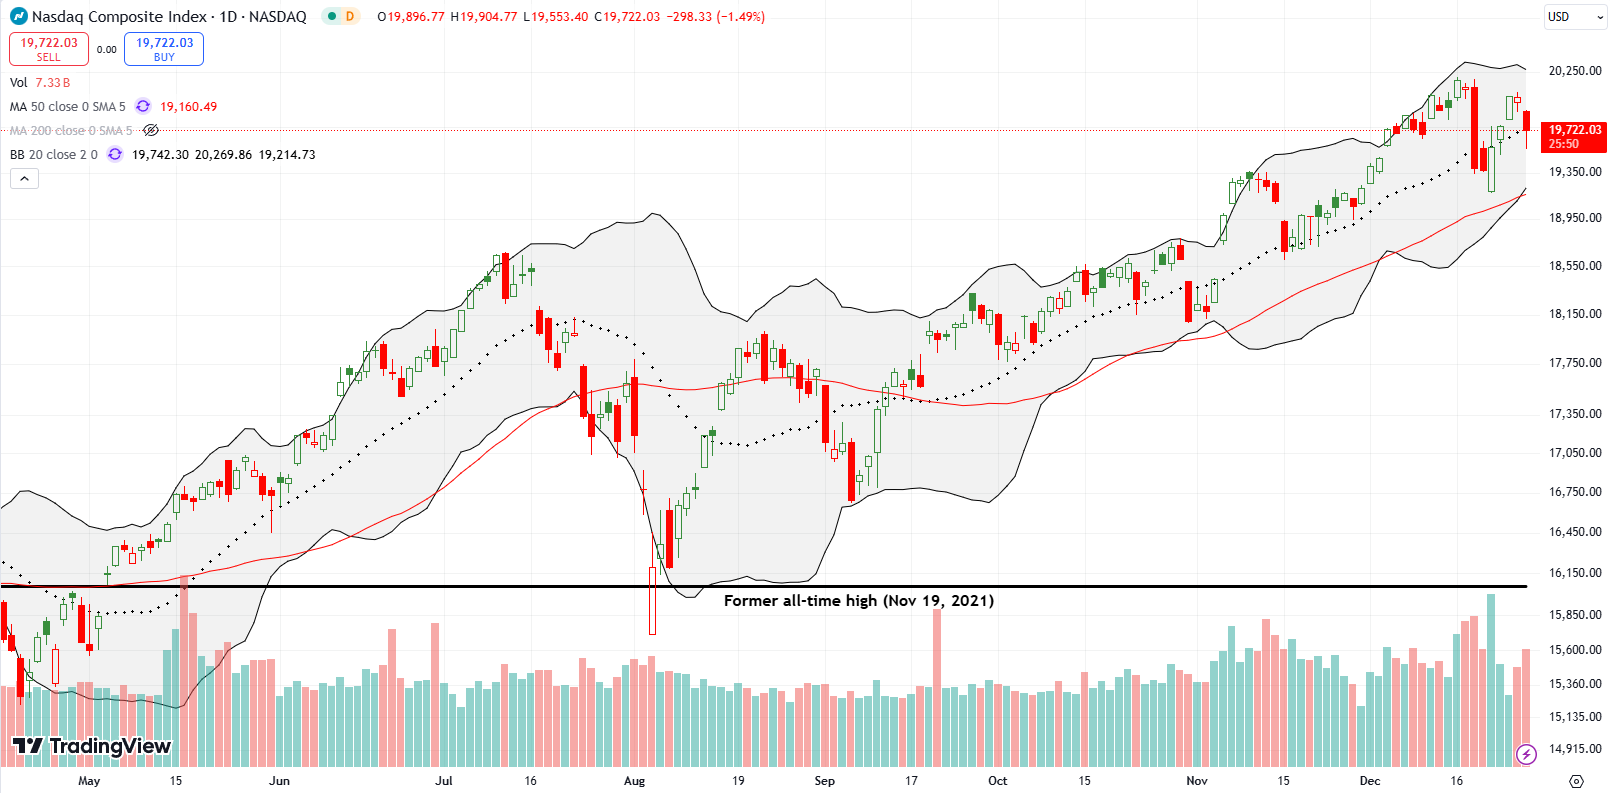
The NASDAQ (COMPQX) followed a path similar to the S&P 500, but the tech-laden index still has a tailwind from its uptrending 20DMA. While the S&P 500 struggled to break out above its 20DMA, the NASDAQ is pivoting around its 20DMA. It will take a lot more downward price action to flag a bearish warning on the NASDAQ.
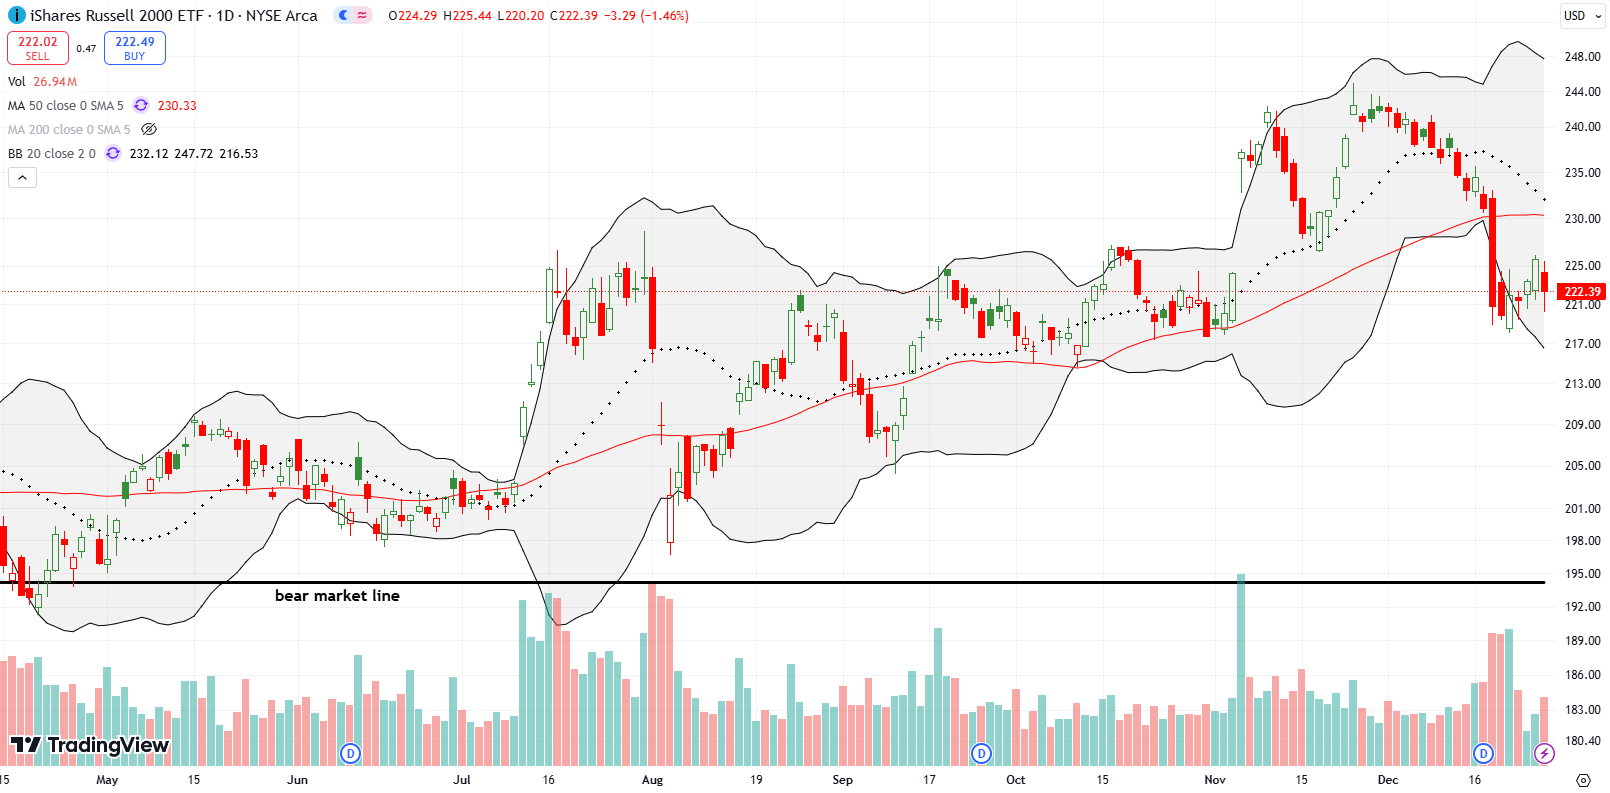
The iShares Russell 2000 ETF (IWM) looks like damaged goods compared to the S&P 500 and the NASDAQ. My decision to stick by IWM has not been rewarded. Last week, IWM just churned in a small range while it flails in bearish territory below its 50DMA. IWM’s 20DMA is also now trending down.
The Short-Term Trading Call With A Faded Early Santa Rally
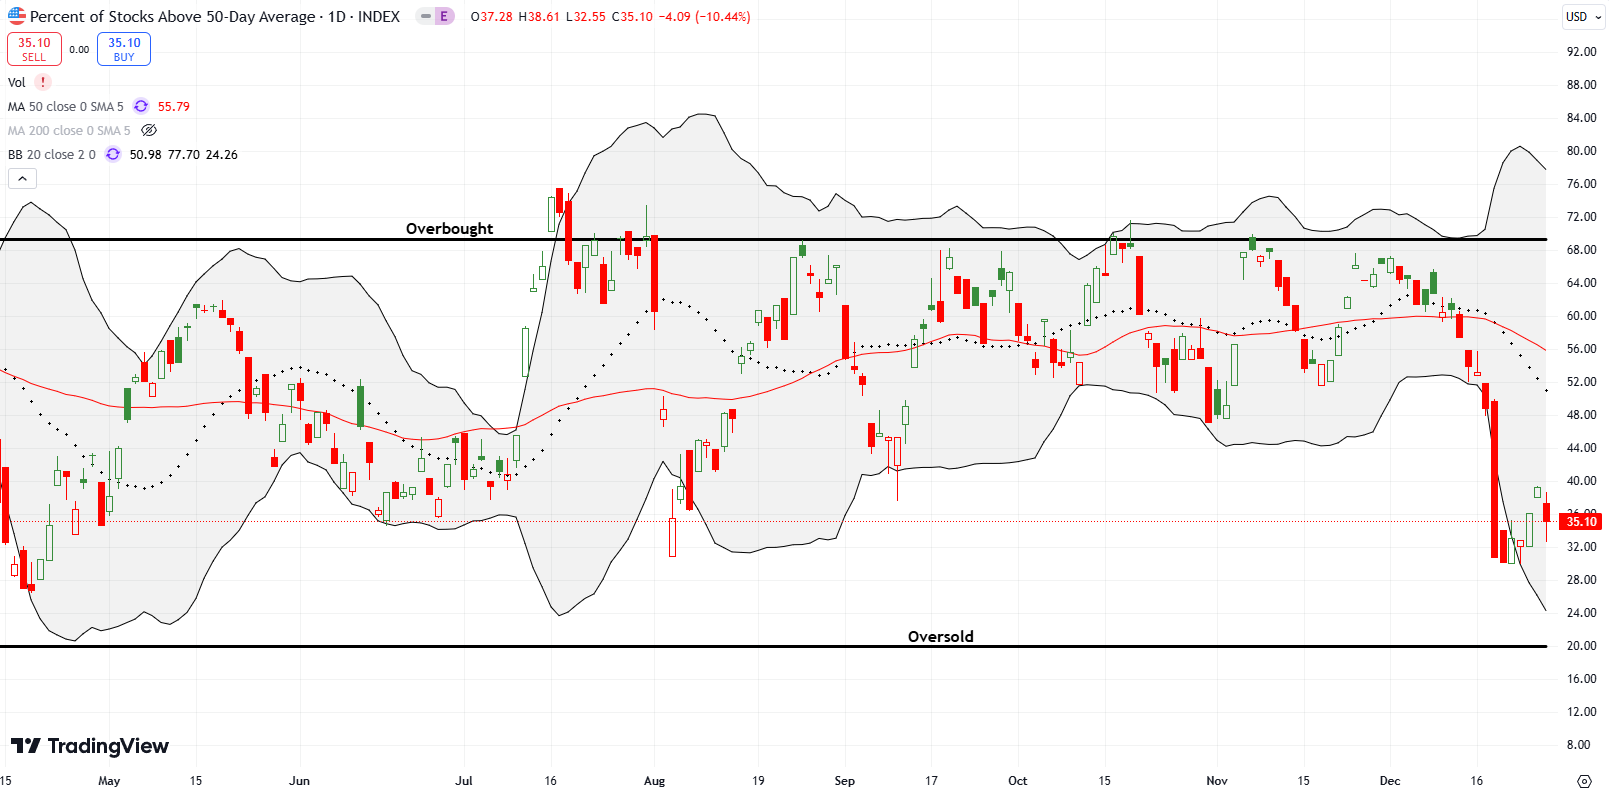
- AT50 (MMFI) = 35.1% of stocks are trading above their respective 50-day moving averages
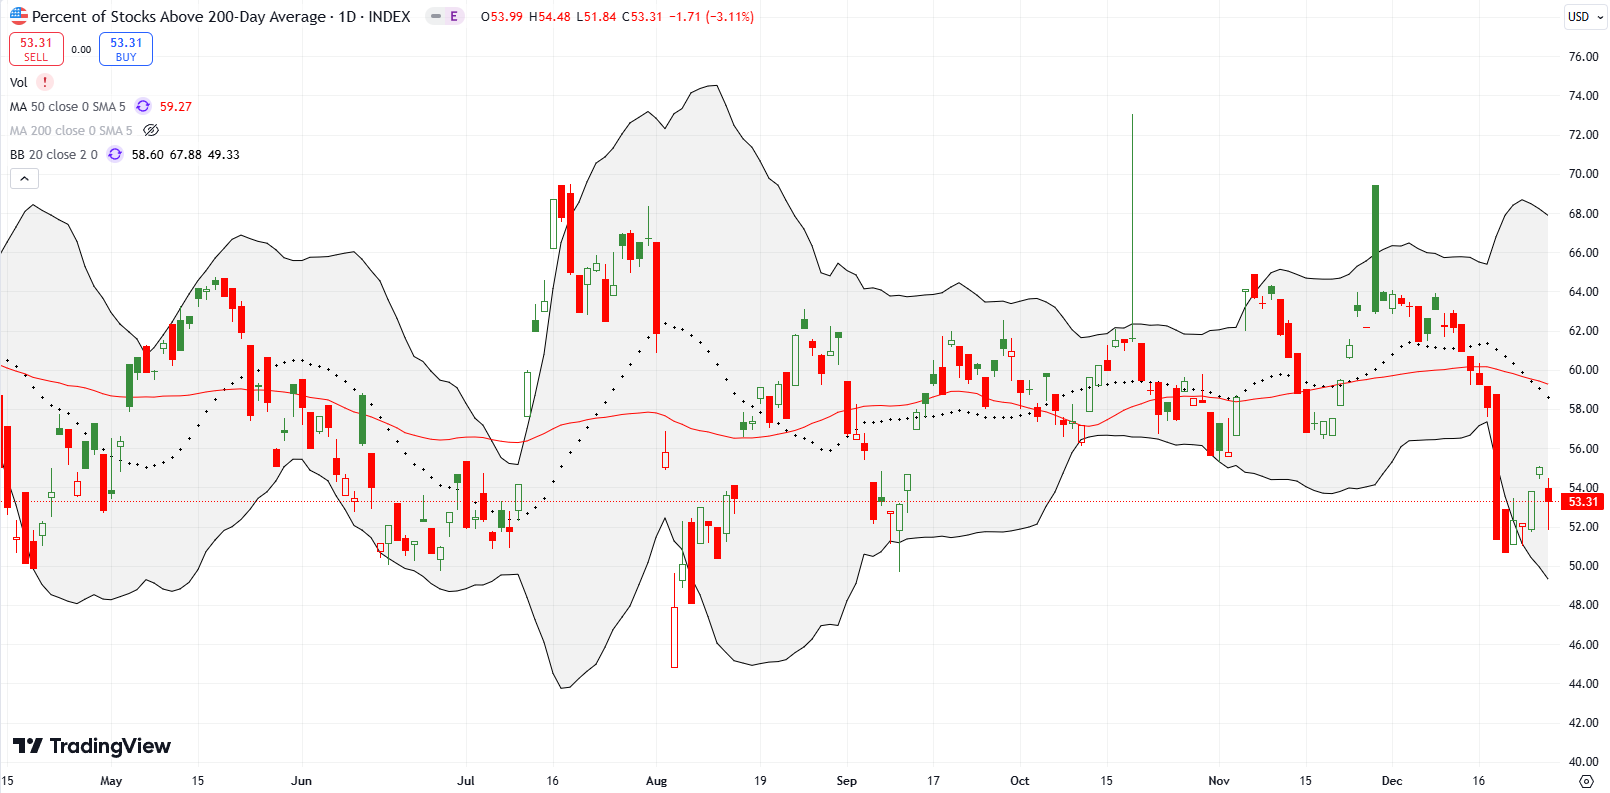
- AT200 (MMTH) = 53.3% of stocks are trading above their respective 200-day moving averages
- Short-term Trading Call: cautiously bullish
AT50 (MMFI), the percentage of stocks trading above their respective 50DMAs, closed the week at 35.1%. My favorite technical indicator made very little progress reversing its post-Fed loss unlike the S&P 500 and the NASDAQ. Still, the rebound that formed the late Santa rally created the bottoming in market breadth that I expected. That expectation motivated me to flip the short-term trading call to cautiously bullish. That trading call now looks tenuous after the early Santa rally failed to fade the Fed fallout. I am warily watching 50DMA support for the S&P 500. IWM is already in bearish position. The NASDAQ remains firmly bullish.
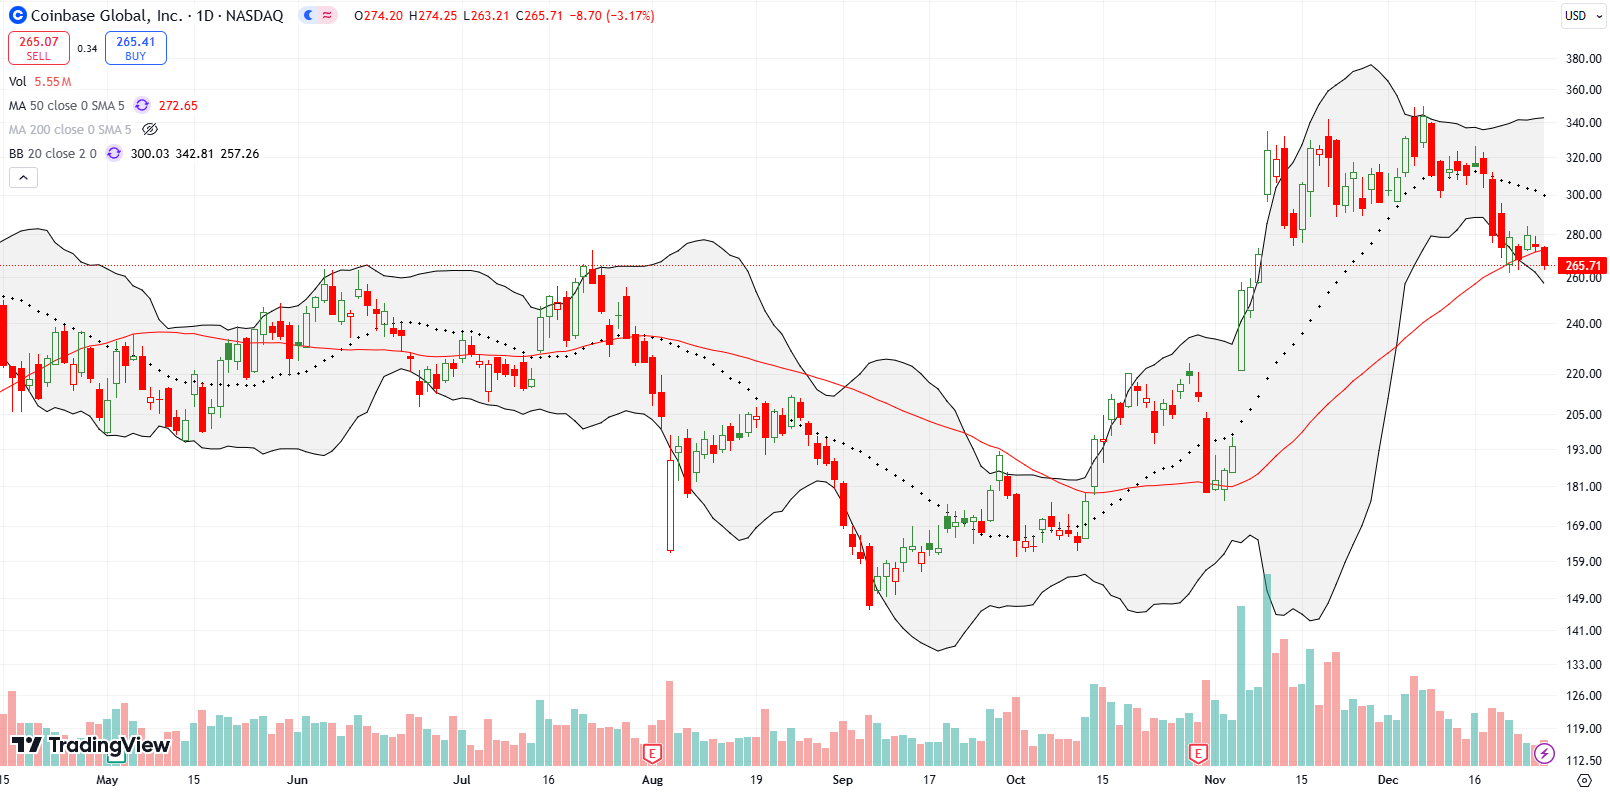
Cryptocurrency trading platform Coinbase Global, Inc (COIN) is on the edge of a bearish 50DMA breakdown. A lower close from Friday will confirm the breakdown. The consolidation that preceded this teetering looks like a top waiting for confirmation. A first downside target would be a complete reversal of the post-election rally, a return to $195.
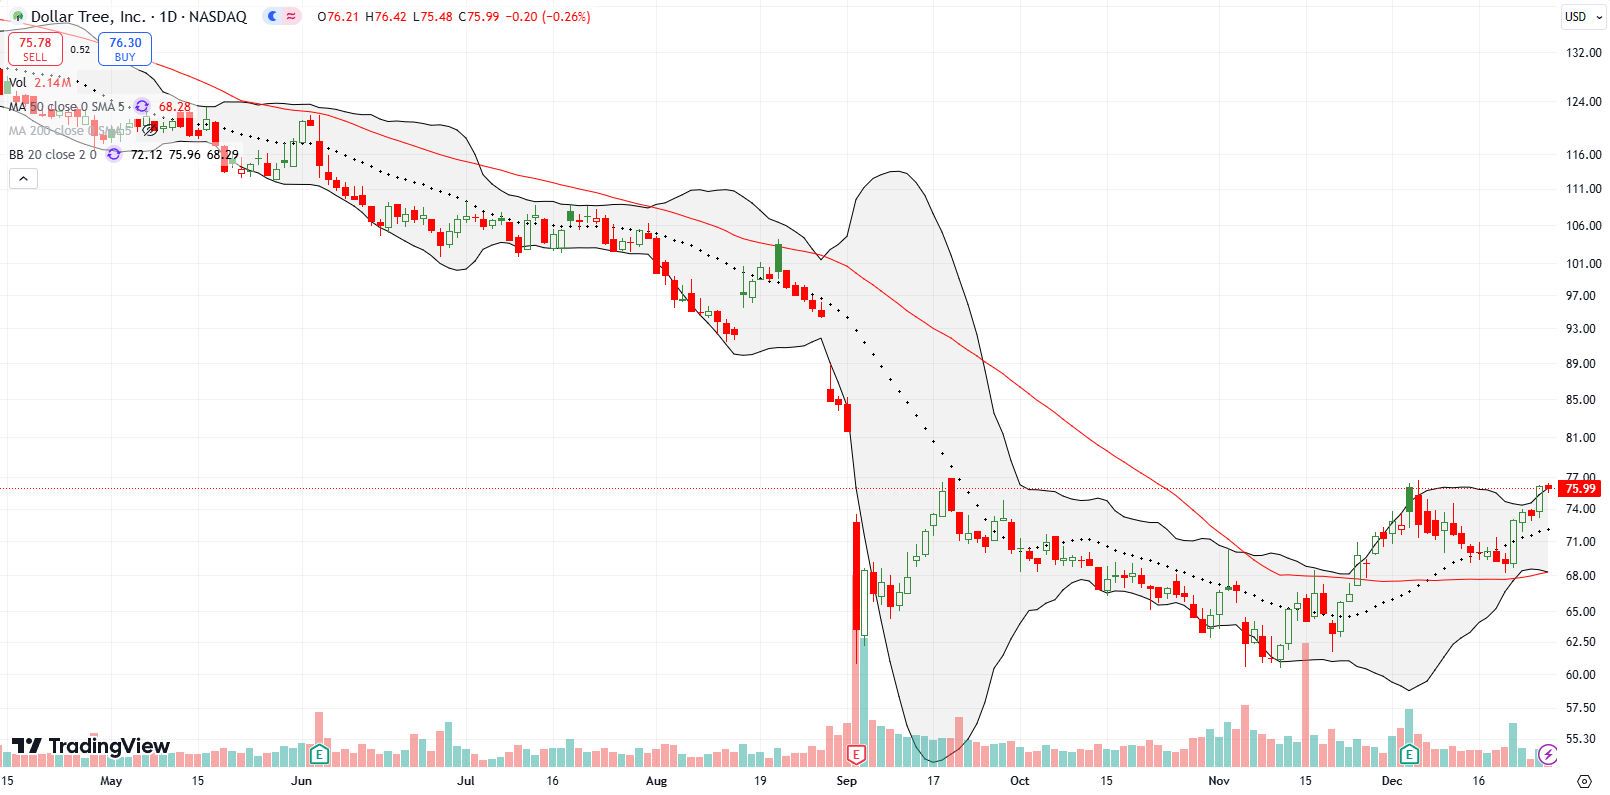
Discount retailer Dollar Tree, Inc (DLTR) looks like it is still in recovery mode. In the previous week, DLTR confirmed 50DMA support with a 5.6% one day rally. I should have bought there or the next day. Unfortunately, I did not notice the move until Thursday at which point I bought a February call spread. I want to give this recovery time. I do not expect a rapid recovery.
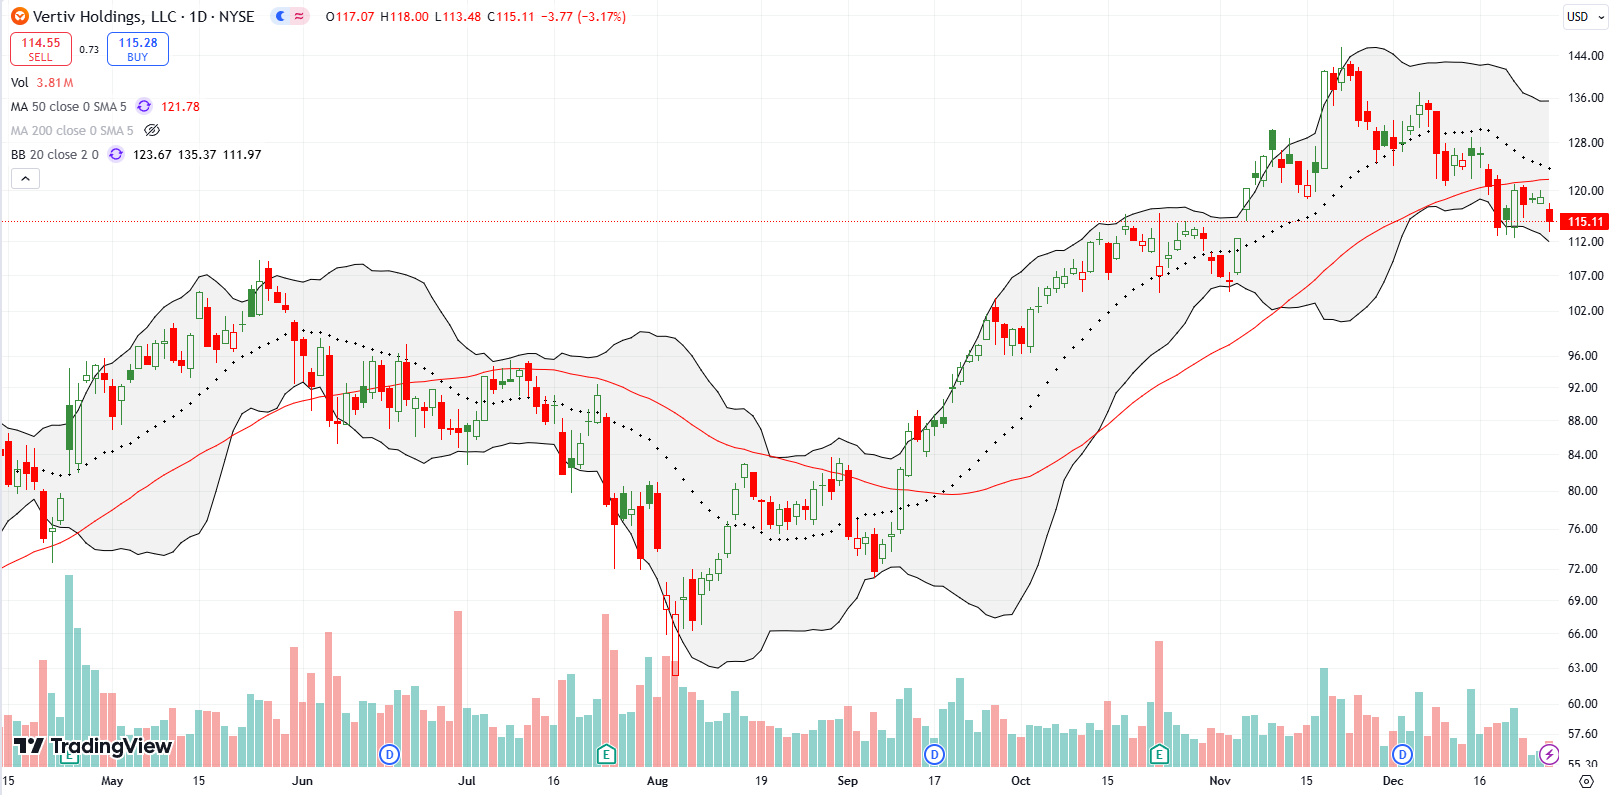
In late September I reaffirmed my resolve to hold Vertiv Holdings Co (VRT) over the long-term. Unfortunately, last week dissolved my resolve. The technicals soured too much on VRT with confirmed 50DMA resistance and a downtrending 20DMA. A lower close from here would even make VRT a short for the bears. With the potential for a lot of capital gains selling in January, I did some risk management by taking profits in VRT here. I am definitely not going to short VRT and instead will be looking to return at lower prices. VRT remains in my generative AI basket of stocks (and yes I am well overdue on updating my AI investing/trading strategy).
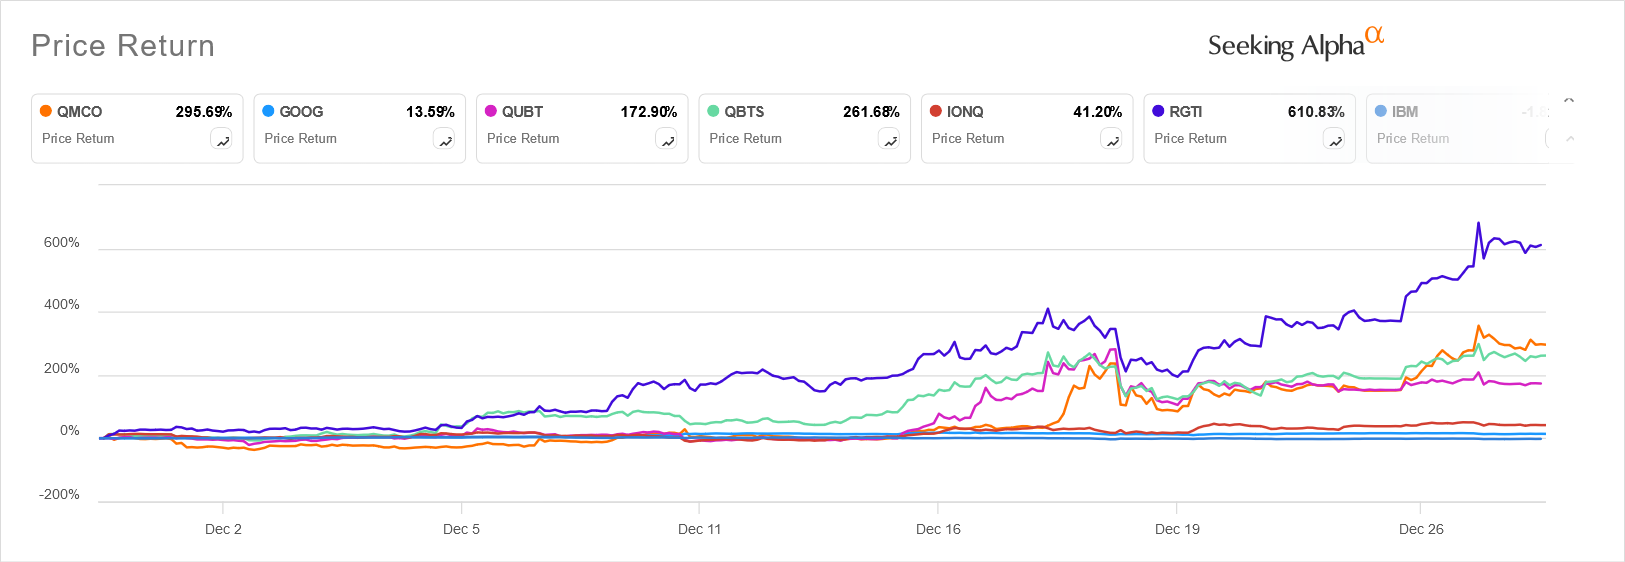
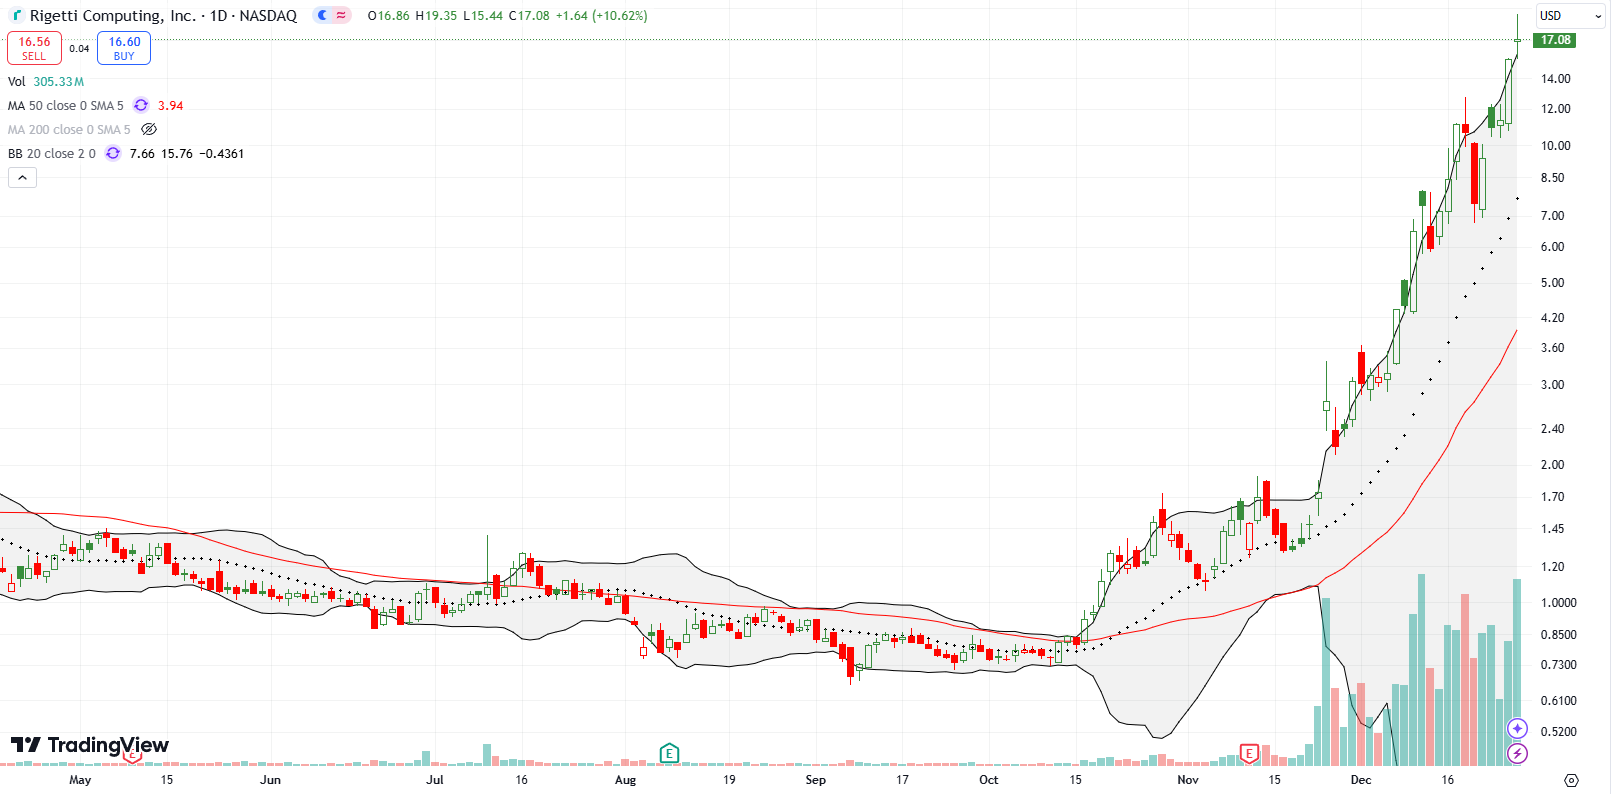
Alphabet, Inc (GOOG) has had trouble following through on its entrance into the recent quantum computing hype. I find this hesitancy ironic because the most speculative quantum computing plays have displayed little hesitancy. The hottest of them all is now Rigetti Computing, Inc (RGTI). Ever since its bullish 50DMA breakout in mid-October, RGTI is up an astonishing 19x in value. RGTI is rushing up its upper Bollinger Band (BB) without going parabolic. The buying is mostly methodical with the volume really surging after mid-November’s 58% gap higher.
RGTI may also be my biggest miss ever, certainly for this year. I have been following quantum computing stocks for over three years. Their stories were always highly speculative and extremely futuristic. So the current hype caught me completely off-guard as I continued to treat them like stocks to buy on sell-offs and sell into rallies. I sold RGTI on that 58% surge, relieved to get out at a small loss. My idea at the time was to focus on IonQ (IONQ). I bought back into IONQ on that day but sold a few days later after a quick 15% gain. IONQ’ went on to gain 24% month-to-date gain, but I have no regrets. However, these double-digit gains are peanuts compared to other stocks in the group. Here are just the ONE MONTH gains for the universe of quantum computing stocks in my watchlist (IBM is -1.8%).
Quantum computing stocks are too small to take over the animal spirits in the stock market, but they can sure siphon money away from the AI hype. They are collectively way too extended and over-heated for me to trade now, but I am watching this universe for insights on speculative fever in the market. I fully expect a major sell-off, perhaps even a crash, in these stocks at some point.
Be careful out there!
Footnotes
Subscribe for free to get email notifications of future posts!
“Above the 50” (AT50) uses the percentage of stocks trading above their respective 50-day moving averages (DMAs) to measure breadth in the stock market. Breadth defines the distribution of participation in a rally or sell-off. As a result, AT50 identifies extremes in market sentiment that are likely to reverse. Above the 50 is my alternative name for “MMFI” which is a symbol TradingView.com and other chart vendors use for this breadth indicator. Learn more about AT50 on my Market Breadth Resource Page. AT200, or MMTH, measures the percentage of stocks trading above their respective 200DMAs.
Active AT50 (MMFI) periods: Day #274 over 20%, Day #173 over 30% (overperiod), Day #7 under 40% (underperiod), Day #7 under 50%, Day #11 under 60%, Day #112 under 70%
Source for charts unless otherwise noted: TradingView.com
Full disclosure: long SPY put spread, long IWM shares and call options, long DLTR call spread
FOLLOW Dr. Duru’s commentary on financial markets via StockTwits, BlueSky, and even Instagram!
*Charting notes: Stock prices are not adjusted for dividends. Candlestick charts use hollow bodies: open candles indicate a close higher than the open, filled candles indicate an open higher than the close.


