Stock Market Commentary
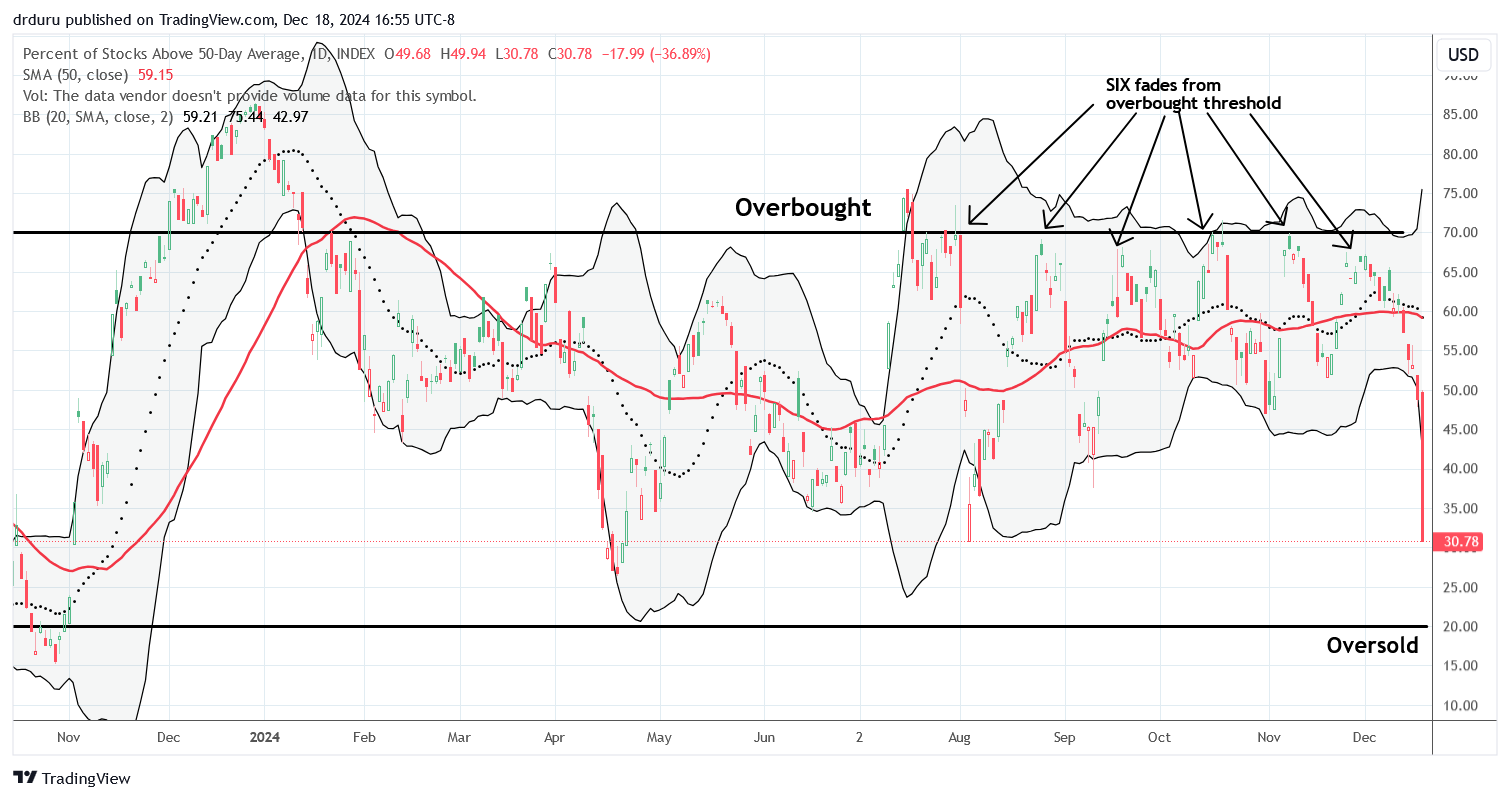
If you followed December’s deterioration in market breadth and/or paid attention to the inflation numbers and the smoke signals from the Federal Reserve, today’s market sell-off does not surprise you. What surprises me at the time of writing is the complete collapse in market breadth. The stock market essentially plunged from euphoria to oversold in a day. While my favorite indicator of market breadth did not hit official oversold conditions, the extreme nature of today’s move creates a “quasi” oversold condition. I recorded the video below to provide an updated description of the strengthening warnings going into the Fed decision.
Fed-related disappointment was the catalyst that finally got the entire stock market’s attention. Fed Chair Jerome Powell delivered the clear message in today’s decision on monetary policy: the Fed MIGHT cut at most twice next year because inflation has been “firmer” than expected. The core news first came in the updated Summary of Economic Projections. While the Fed cut rates as expected by 25 basis points (bps) (to a range of 4-1/4 to 4-1/2 percent), the Fed slashed its expectations for 2025 rate cuts from 100 to 50 bps. Moreover, inflation expectations (the 2025 core PCE inflation rate) increased from 2.2% to 2.5%. The market took zero solace in a slight increase in projected real GDP growth from 2.0% to 2.1%.
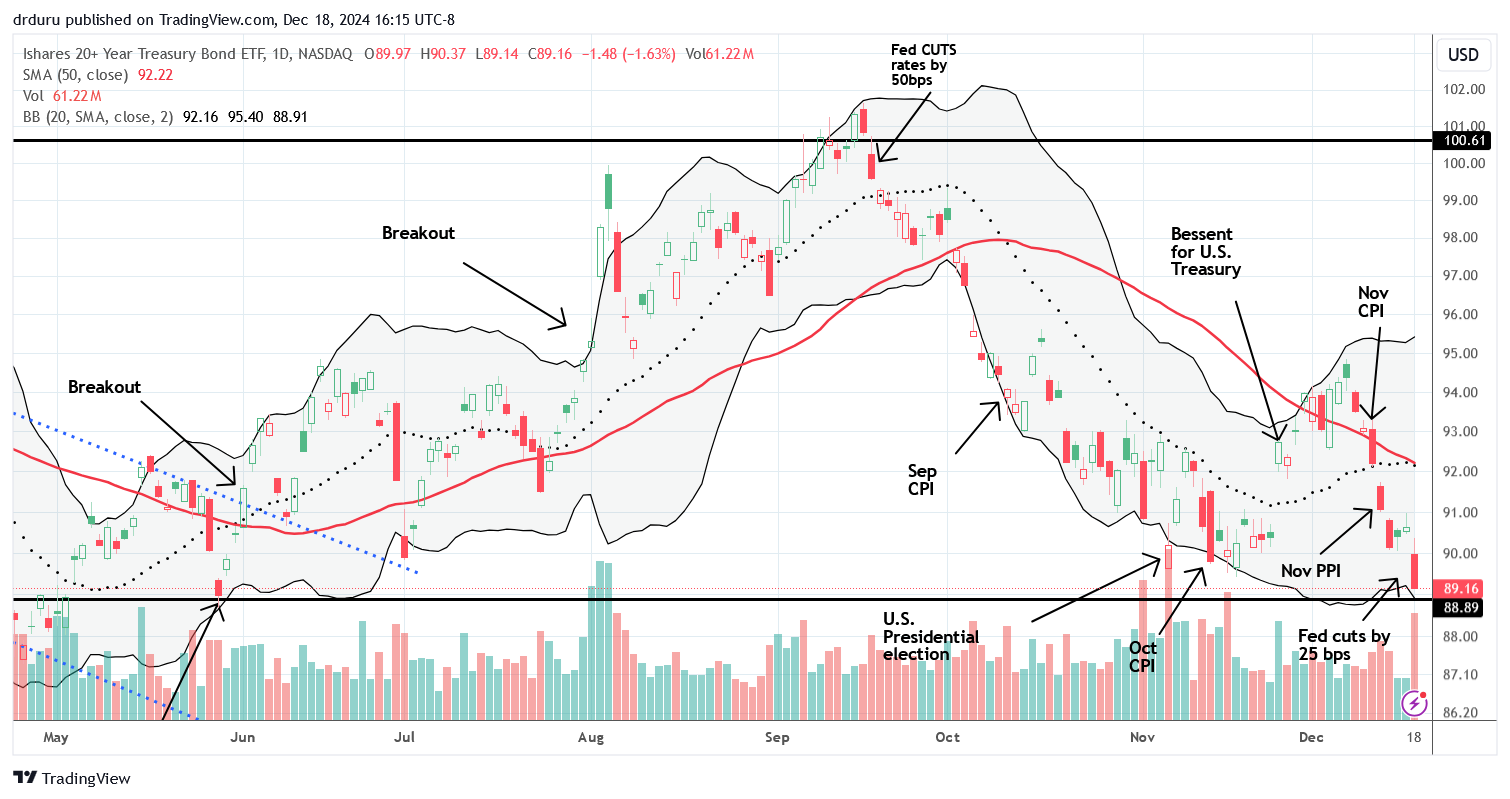
All month long, in fact ever since the Fed’s first rate cut in September, the bond market paid attention even as the stock market whistled blithely along. Last week the iShares 20+ Year Treasury Bond ETF (TLT) finished reversing the initial (and misplaced) euphoria about the pick to run the U.S. Treasury in the next administration. Today, TLT almost tested the bottom of the presumed trading range. A breakdown from here should keep the stock market’s attention. I took profits last week on my last round of TLT puts.
The Stock Market Indices
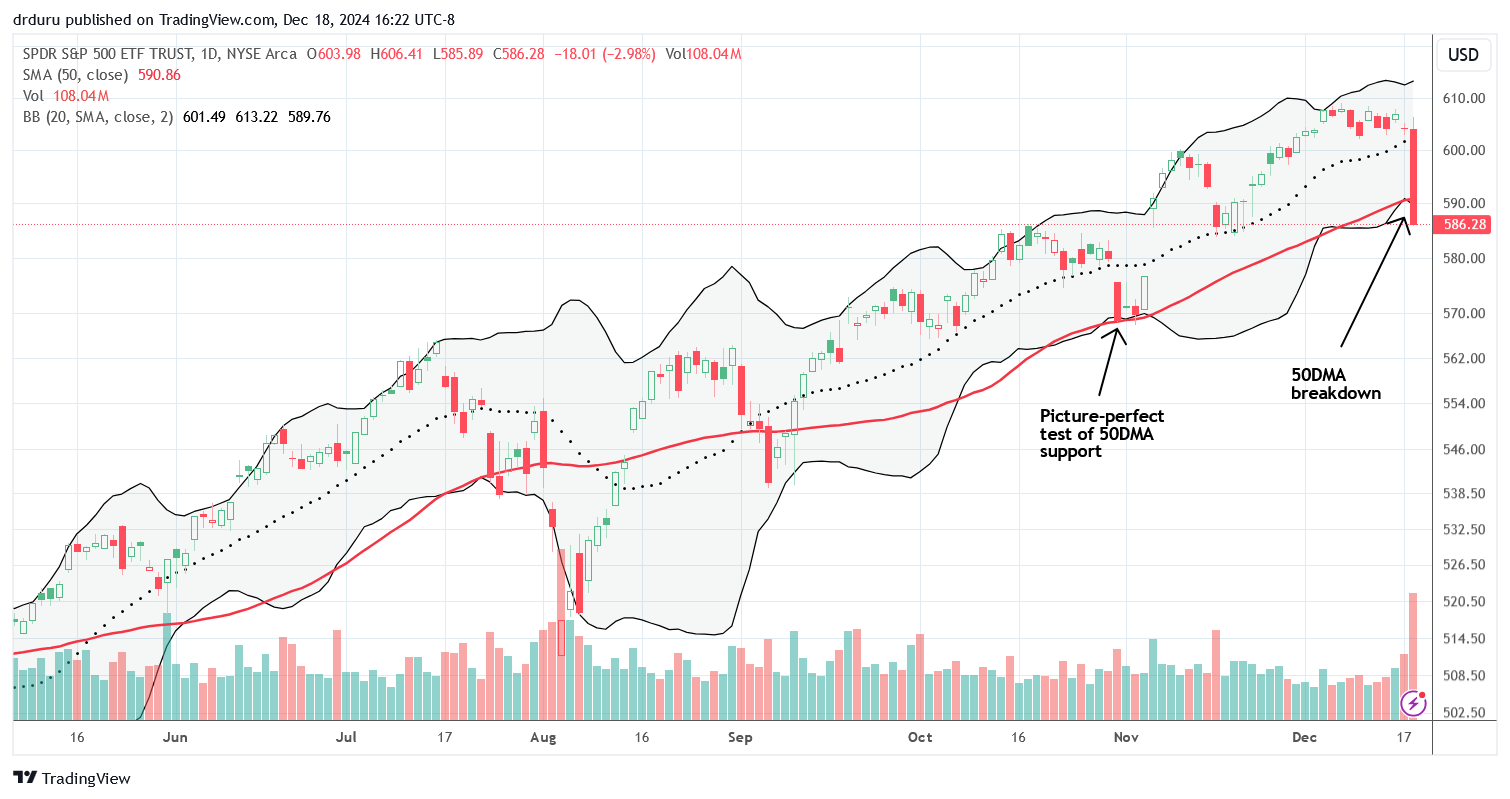
The S&P 500 (SPY) sliced right through support at its 50-day moving average (DMA) (the red line below). Sellers finally stopped dumping stocks overboard right at the closing low from last month. That low created a picture-perfect test of 20DMA support (the dashed line). A complete reversal of post-election gains seems imminent now (the gap up that last confirmed 50DMA support).
Once I recognized that the stock market was waking up to risk, I loaded up on SPY $590 put options expiring on Friday. However, the put options quickly doubled in value at which point I took profits. An old options trading rule dictates taking profits on a quick double. Besides, the S&P 500 was already down about 1.9% with 45 minutes left to closing and looming 50DMA support. An oversold bounce could have kicked in anytime. Instead, sellers maintained their fury into the close and those same put options more than tripled from my selling price! Wow!
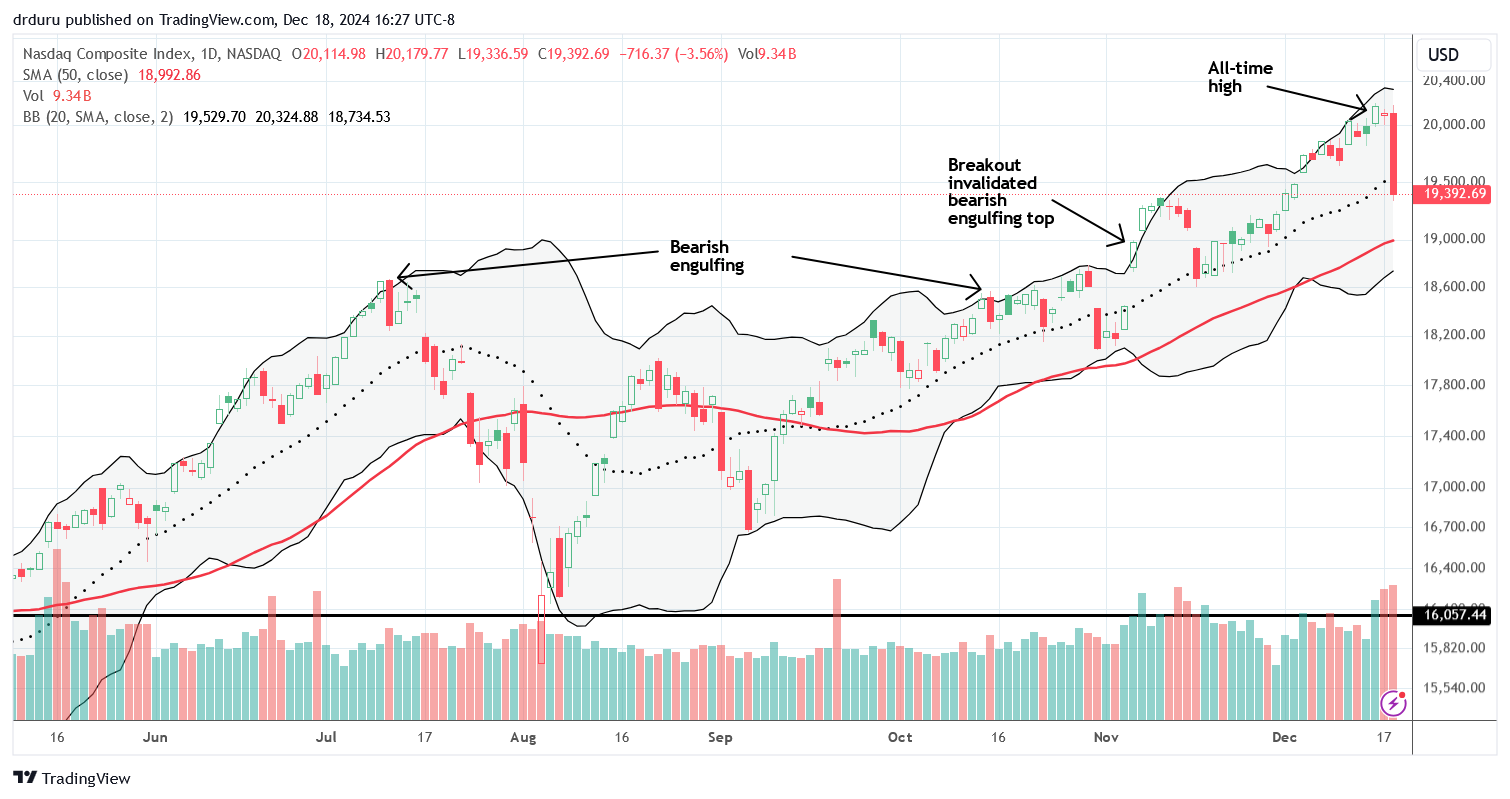
The NASDAQ (COMPQX) has been the paragon of strength this month and through the (presumed) Santa Claus rally. Before today, the tech-laden index was up a nifty 4.6% versus the S&P 500’s flat performance. That divergence was even more dramatic given the S&P 500 equal weighted index was DOWN 4.1% before today (and plunged another 3.0% today!). While the S&P 500 now looks ready to reverse all its post-election gains, the NASDAQ may be just getting started. First, a test of 50DMA support…
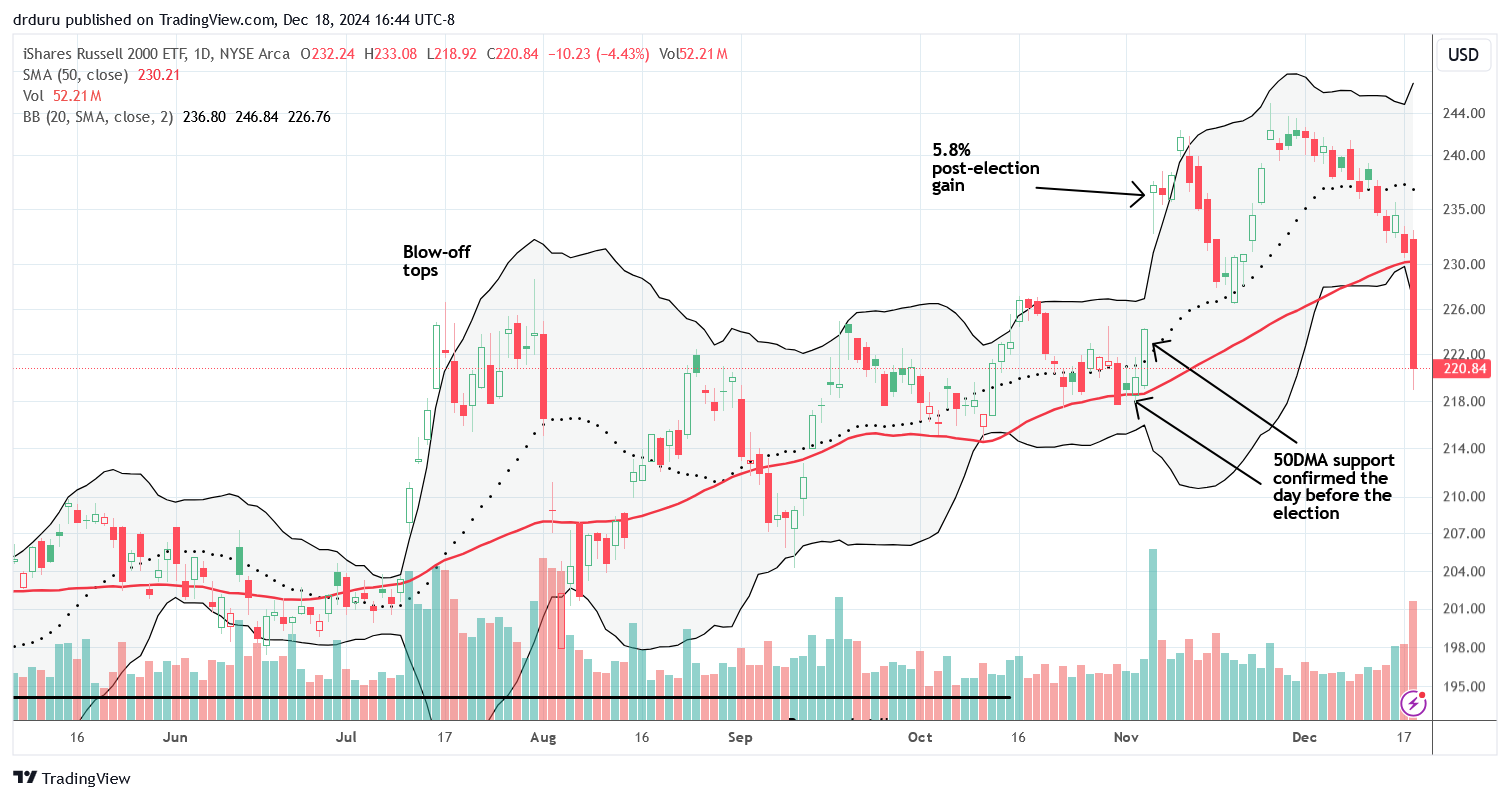
The iShares Russell 2000 ETF (IWM) is MY big disappointment. My hopes for a turn-around at some point were completely smashed by today’s 4.4% collapse. IWM gave up all its post-election gains and then some. It looks poised to next test the lows that were part of its last successful test of 50DMA support. IWM is even once again below the summer’s blow-off tops. My last batch of IWM call options were of course evaporated. I will stubbornly look to open a fresh round as early as Thursday.
The Short-Term Trading Call From Euphoria to Oversold
- AT50 (MMFI) = 30.8% of stocks are trading above their respective 50-day moving averages
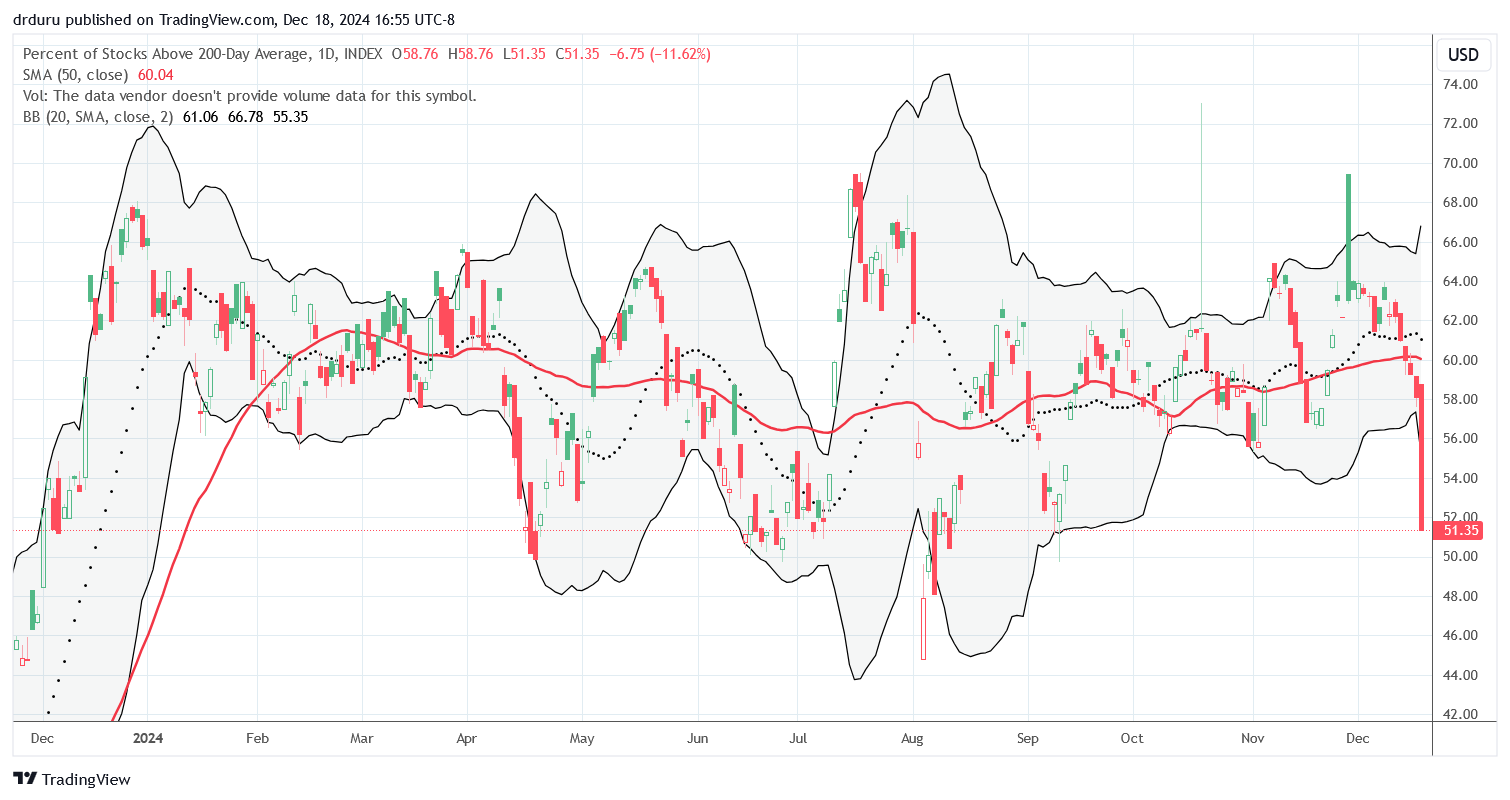
- AT200 (MMTH) = 51.4% of stocks are trading above their respective 200-day moving averages
- Short-term Trading Call: cautiously bullish
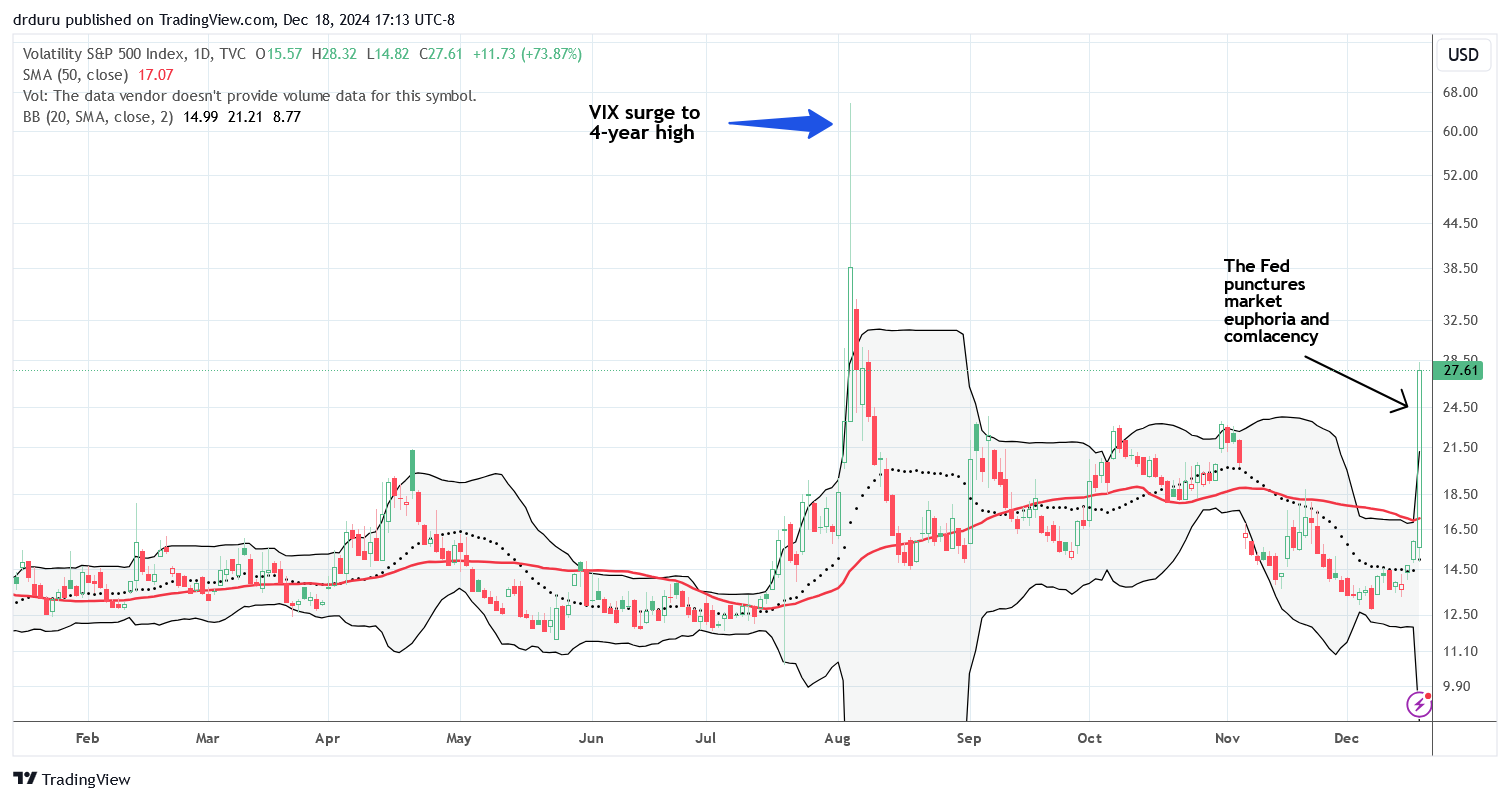
AT50 (MMFI), the percentage of stocks trading above their respective 50DMAs, plunged from 48.8% to 30.8%. This one-day collapse is the most dramatic suffered by my favorite technical indicator since the pandemic. From that vantage point alone, AT50 is essentially in an oversold extreme even though the AT50 trading rules define oversold conditions below 20%. The volatility index (VIX) added to the extreme nature of the move by soaring 73.9% to its 4th highest close of the year and the highest percentage closing gain of the year. If AT50 were officially oversold, I would be aggressively bullish with plans to start buying “something” first thing Thursday morning. Instead, I am tentatively upgrading the stock market from neutral to cautiously bullish. This short-term trading call acknowledges the outsized extremes of today’s trading action while providing me “psychological license” to stay on the trading sidelines until more of the dust settles.
Note well that this year continues to be a strange year for AT50. This tried and true indicator of market breadth has yet to drop into oversold territory even on an intraday basis. On the bearish side, AT50 fell from overbought resistance (70%) SIX times with each episode resulting in tepid trading for shorts. This sixth episode was the strangest of all because of the extreme and extended nature of the divergence in the S&P 500 and the NASDAQ. I never felt comfortable downgrading from neutral to bearish.
If the stock market gaps down at the open along with a fresh surge in the VIX, I will get into “buy something” mode.
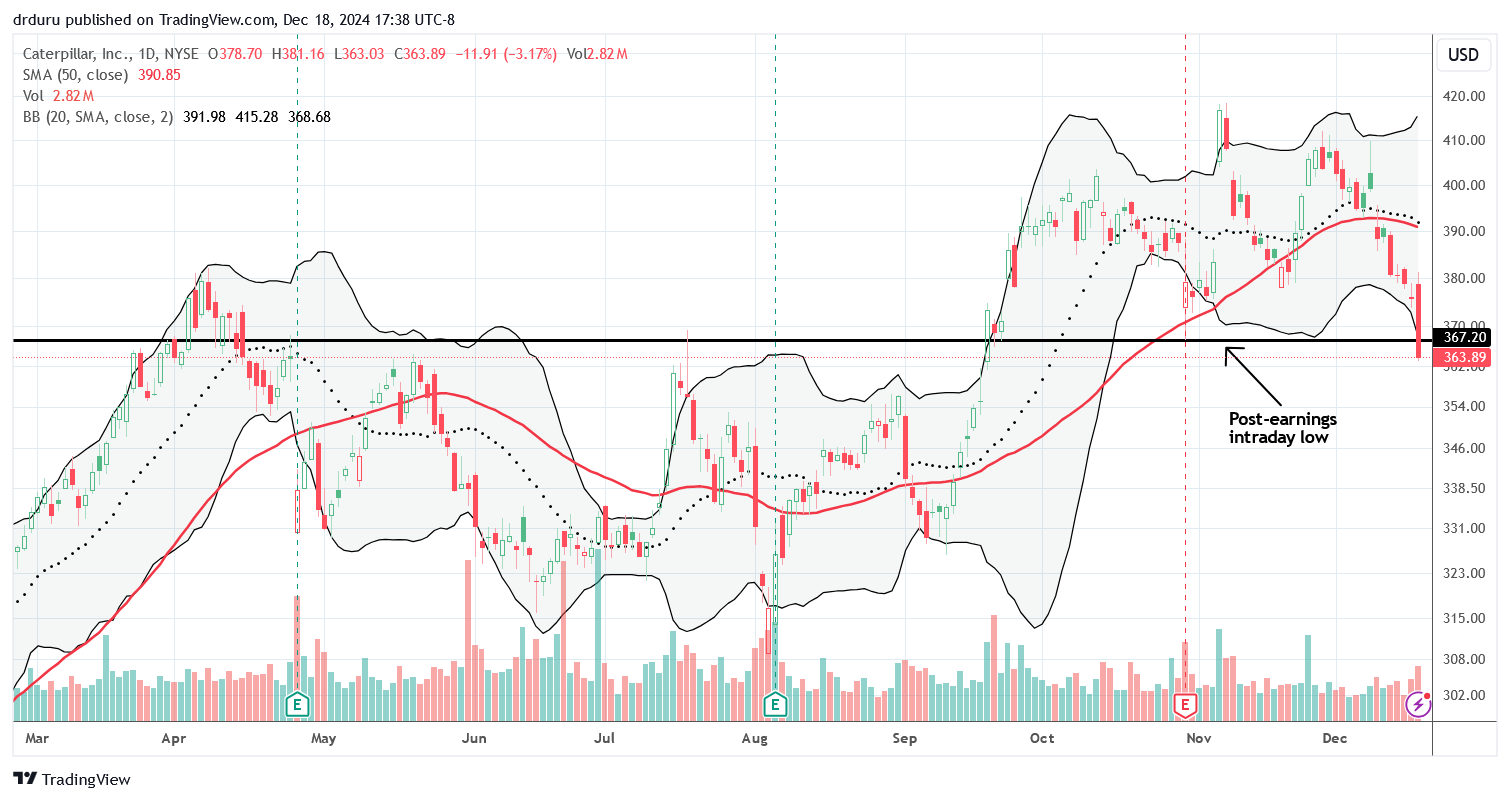
My first order of business will be to clear my decks of almost all remaining bearish positions. My biggest one is my go-to hedge against bullishness: Caterpillar, Inc (CAT). Given the market’s deteriorating technicals, I got bold enough to add to my puts going into the Fed meeting. Moreover, CAT’s two rebounds after initially dropping 2.1% post-earnings did not make sense beyond pure technical trading games. I even stopped myself from taking profits today (the options rule for taking profits after a quick double do not apply here). Given the outsized profits on this position and the stretched close below the lower Bollinger Band (BB), CAT will be my first position to close after Thursday’s open.
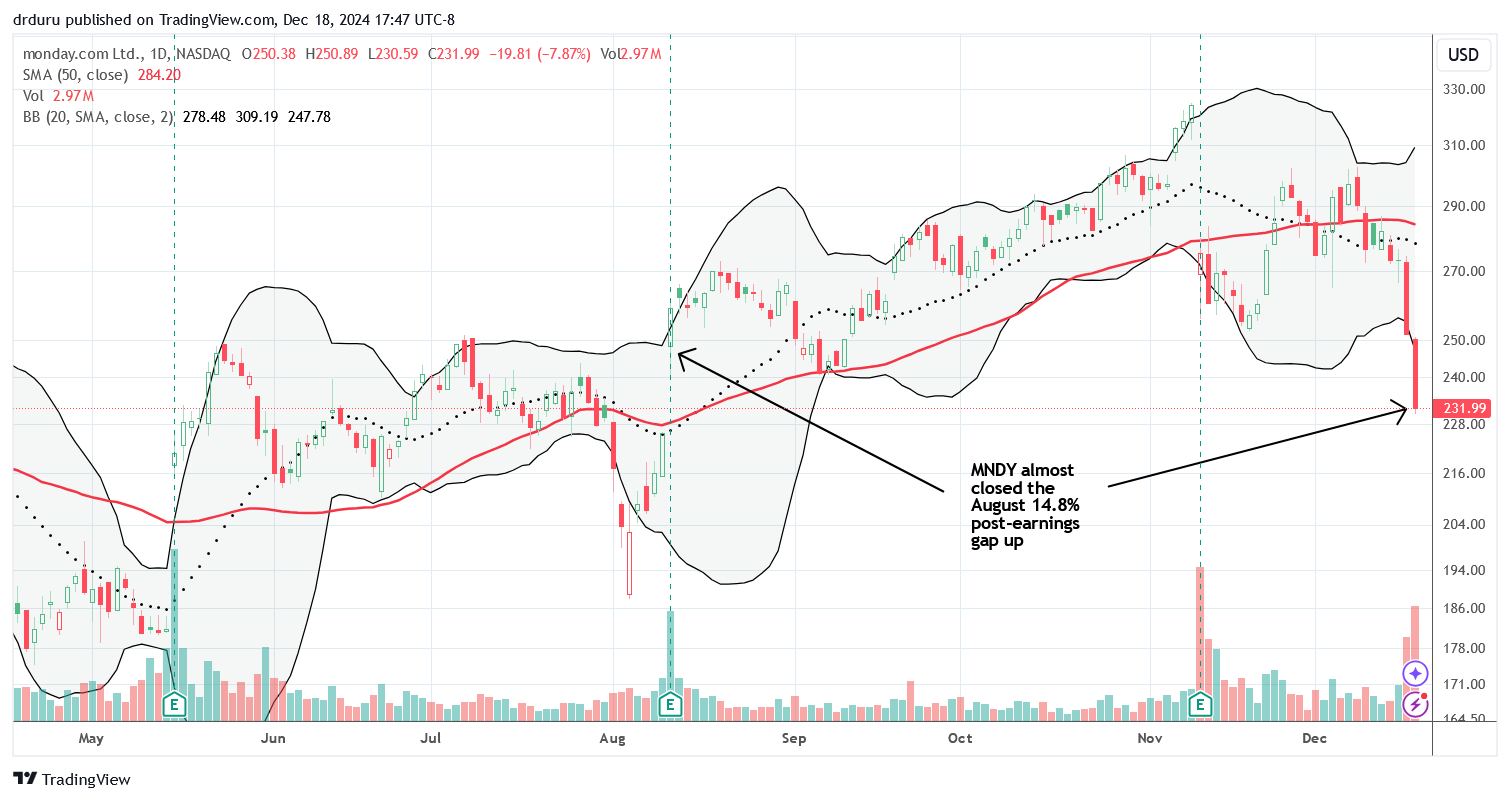
At the beginning of the month, I marveled at how monday.com (MNDY) quickly rebounded after I bought a put spread to play a bearish post-earnings 50DMA breakdown. Fast forward to this week where sellers suddenly accelerated their interest in the stock. A 7.9% plunge the day before managed to put my spread back to flat. After the open, a sudden 3% or so follow-through in selling compelled me to go ahead and take profits. I saw no news to explain the selling, so I figured MNDY was just as likely to bounce as it was to keep selling through the Fed. MNDY ended the day with another 7.9% loss (on the nose!).
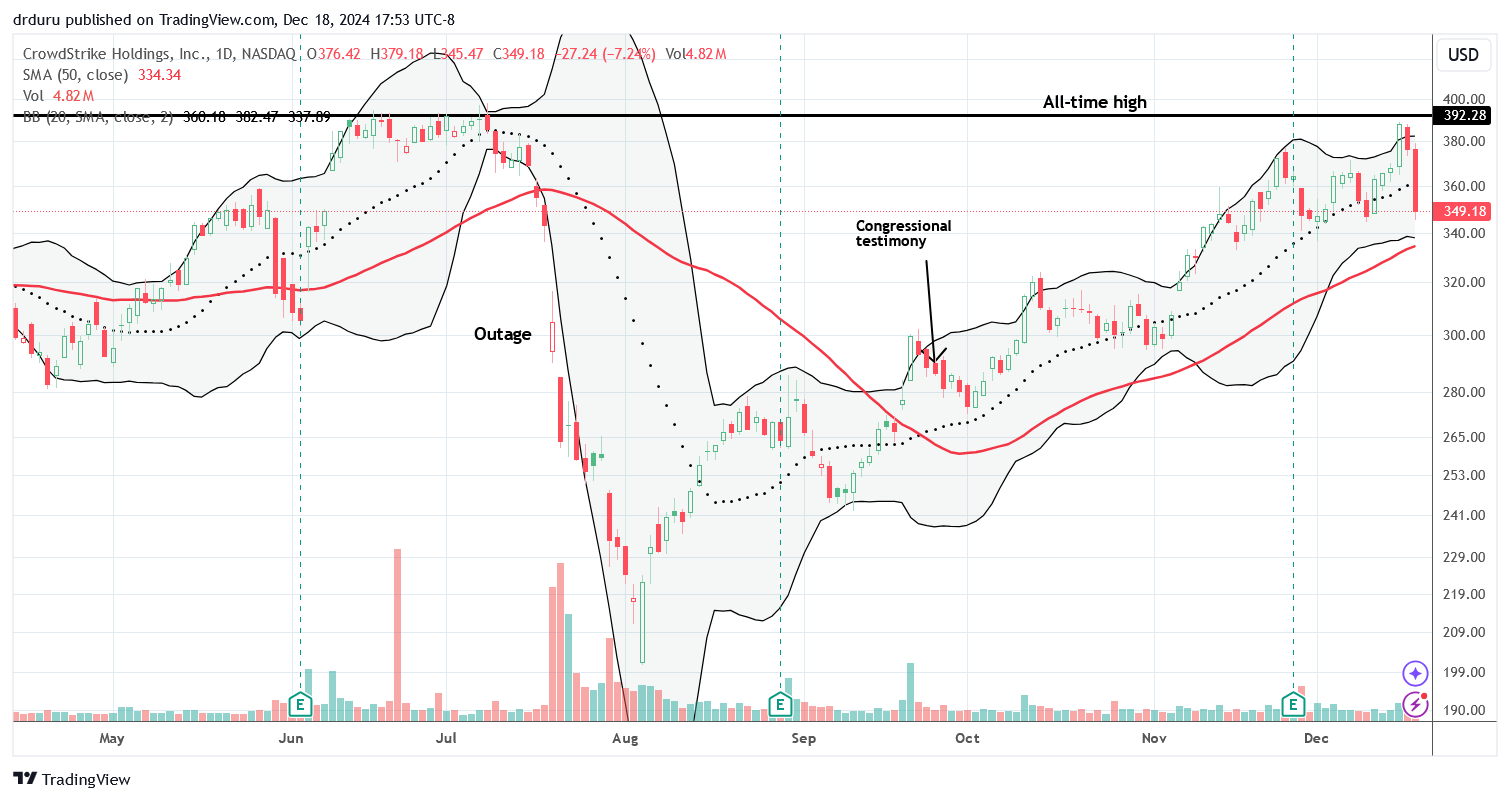
I’ll end on a hopeful note. Crowdstrike (CRWD) is one of the 30% of stocks still trading above its 50DMA. I am surprised that the stock recovered so quickly from the summer’s disastrous outage. Even though I fingered Congressional testimony as a (classic) buying spot, I left the stock alone (hopefully at least one of you out there kept up with CRWD’s news flow and technicals!). Now CRWD is pulling back from a test of all-time highs and looks ready to test uptrending 50DMA support. During oversold trading, I sometimes like to start buying the survivors.
Be careful out there!
Footnotes
Subscribe for free to get email notifications of future posts!
“Above the 50” (AT50) uses the percentage of stocks trading above their respective 50-day moving averages (DMAs) to measure breadth in the stock market. Breadth defines the distribution of participation in a rally or sell-off. As a result, AT50 identifies extremes in market sentiment that are likely to reverse. Above the 50 is my alternative name for “MMFI” which is a symbol TradingView.com and other chart vendors use for this breadth indicator. Learn more about AT50 on my Market Breadth Resource Page. AT200, or MMTH, measures the percentage of stocks trading above their respective 200DMAs.
Active AT50 (MMFI) periods: Day #268 over 20%, Day #167 over 30% (overperiod), Day #1 under 40% (ending 90 days over 40%), Day #1 under 50% (ending 28 days over 50%), Day #5 under 60%, Day #106 under 70%
Source for charts unless otherwise noted: TradingView.com
Full disclosure: long SPY put spread, long IWM shares and call options, long QQQ put spread, long CAT puts, long VXX put options
FOLLOW Dr. Duru’s commentary on financial markets via StockTwits, BlueSky, and even Instagram!
*Charting notes: Stock prices are not adjusted for dividends. Candlestick charts use hollow bodies: open candles indicate a close higher than the open, filled candles indicate an open higher than the close.

Regarding your “sell on a quick double” trading rule, mine is “sell HALF on a quick double”, based on the idea that at that point the rest of the position is house money: risk falls to zero. I sell the rest based on T/A such as a gap fill, reaching an old high, or exceeding the top B-Band. My rule only pays off with better profits about half the time, though. I think the optimum is somewhere in between, which I try to do with stock positions – e.g. sell 60 of 100 shares. Obviously when the position 1 or 2 option contracts, that higher resolution is not available.
Is ITB a buy here and hold for seasonality till April ?
Simple answer: yes, but only because the overall market is essentially oversold.
Longer answer: maybe, because LEN reported a bad earnings print which follows poor results from DHI and disappointment with TOL. So with the biggest and most important builders disappointing the market, I think the sector is going to have a negative and downward bias this season. This means that the seasonal trade will need to be much more opportunistic than usual. That is, shorter-term trades.
I have been scaling into ITB. Honestly, I started buying too early given the macroeconomic headwinds increasing against homebuilders. I will be writing more about the the poor performance of the seasonality trade and what to do about it in my next review of the housing market.
A quick double with stocks is like lightning striking. So I assume you’re talking about over some measure of time, achieving a double. Then yes, definitely sell half and ride the houses money the rest of the way. It’s a great risk management tool. For options, the sell all on a quick double ensures you don’t get greedy only to watch the options quickly decay away your winnings. With time working against you, selling just half of an options trade is a bet that you can secure even more fortune in a very short time. The odds can be poor on that.