Stock Market Commentary
Bearish engulfing patterns flag potential tops at the end of uptrends. They represent the potential exhaustion of buying power as price first opens above the previous day’s high and then closes below the previous day’s close. Thus, the latest round of bearish engulfing patterns in major indices and major stocks should be particularly ominous this month, the third of the stock market’s three most dangerous months. However, bearish engulfing patterns have materialized at many points this year only to get invalidated in short order. Earlier all-time highs defied a number of fundamental warning signs. So I find myself once again tempering bearish inclinations given the potential for yet another bear teaser. Last week’s strong retail sales report for September even delivered a fundamental resistance to bearish tidings.
The Stock Market Indices
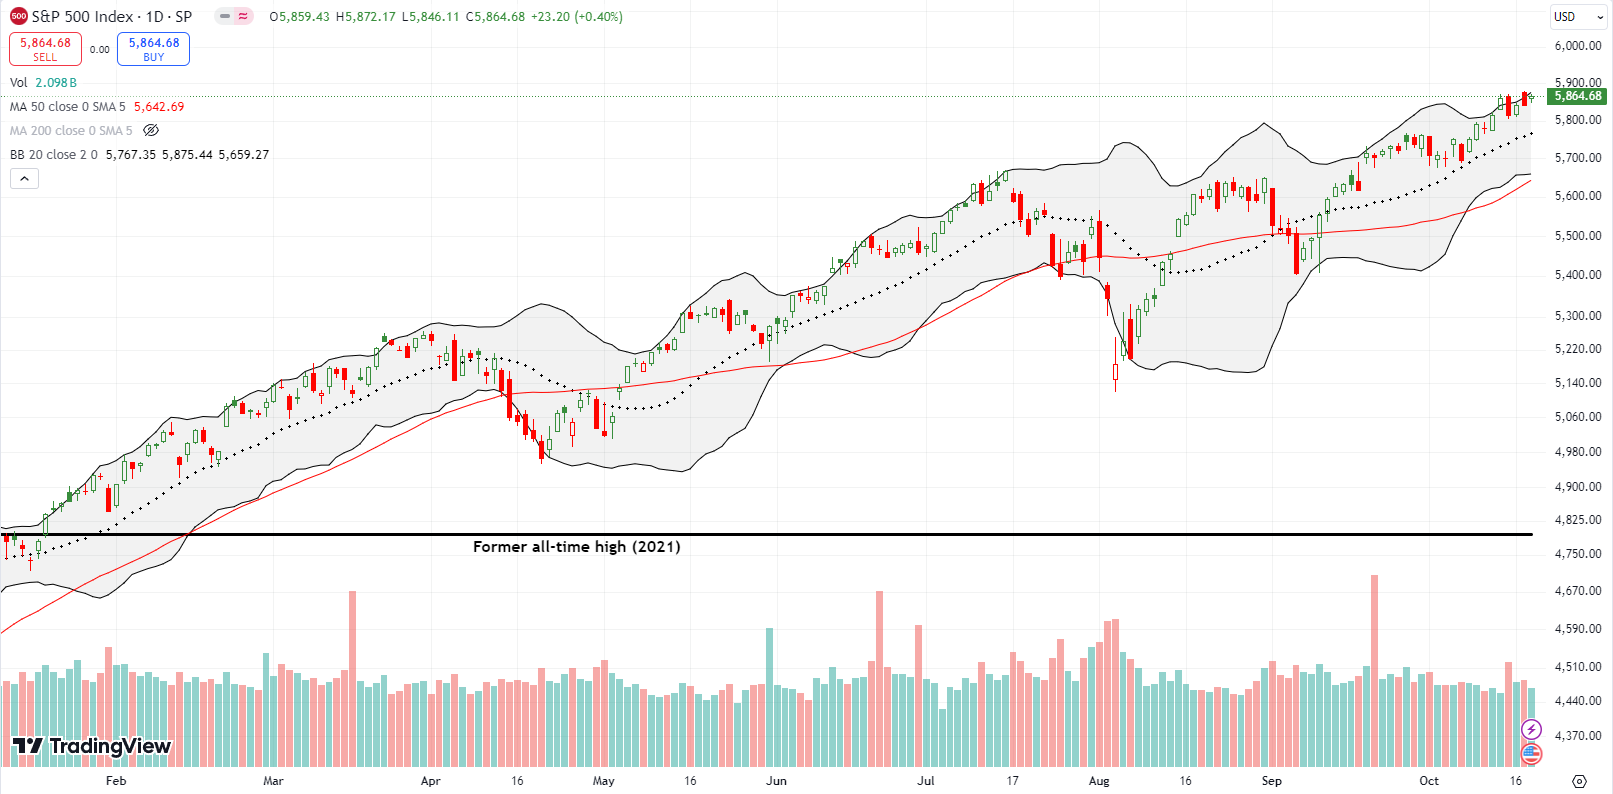
The S&P 500 (SPY) printed a bearish engulfing topping pattern on Tuesday. Like several other bearish signals this year, sellers were unable to follow-through with confirmation. The index turned right around and printed a new all-time closing high on Friday. However, that high did not close above the intraday high of the bearish engulfing topping signal. As a result, bears can still cling to expectations of a top…as tenuous as such an expectation looks at this point and with the strong tailwind from the on-going uptrend. Still, I made sure to jump in to a fresh SPY put spread (December expiration).
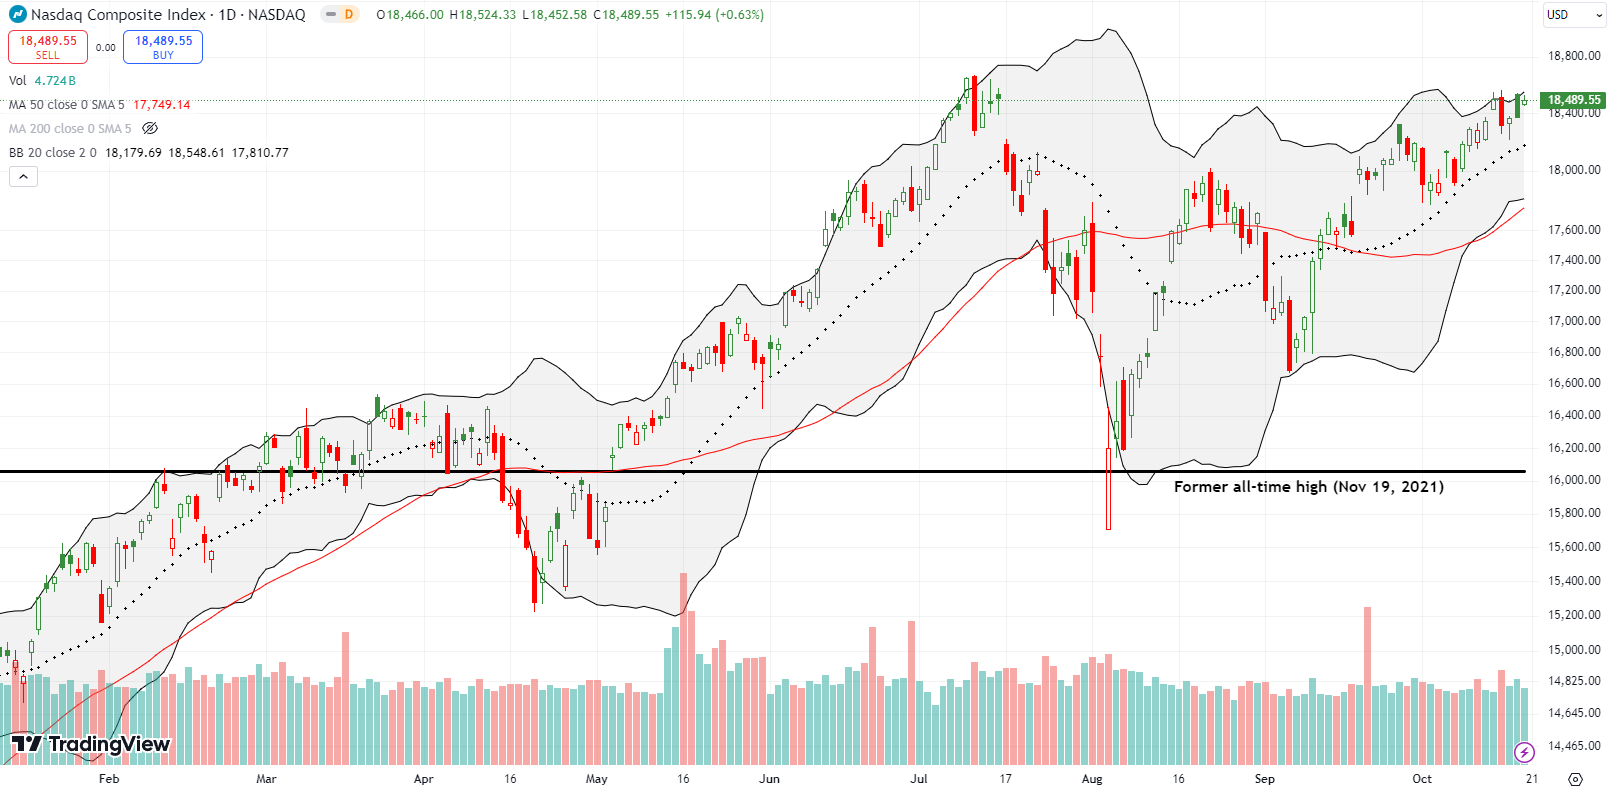
The NASDAQ still looks toppy even as it grinds higher. Like the S&P 500, the tech-laden index failed to completely invalidate its bearish engulfing topping pattern. Moreover, the NASDAQ has yet to invalidate the bearish engulfing top that marked the all-time high back in July. As a result, the technicals present a conundrum of strong upward momentum underneath a cloud of bearishness. The resolution of this conflict could create fireworks, to the upside or the downside.
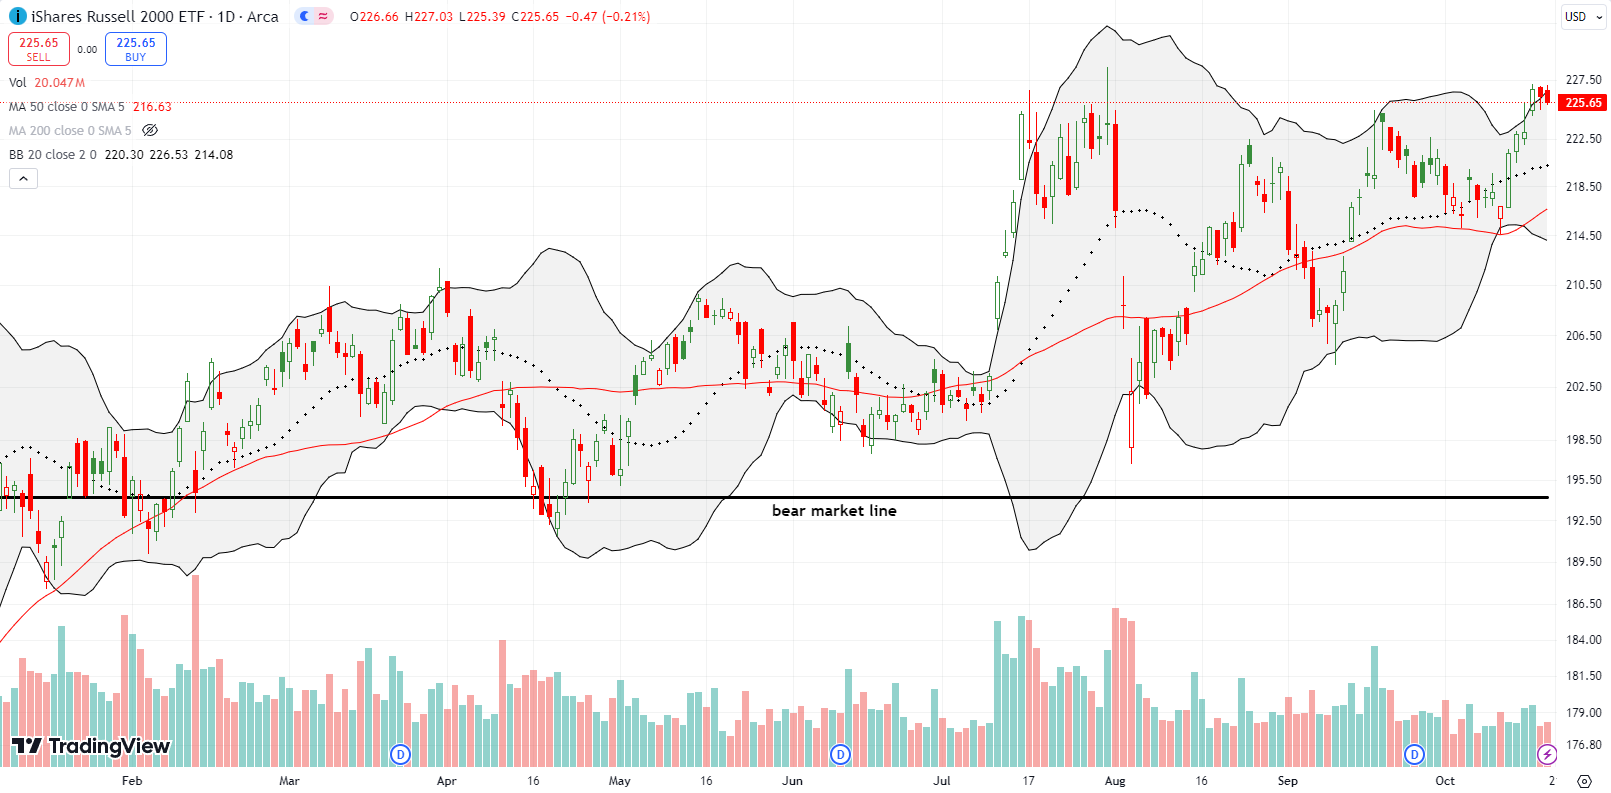
The iShares Russell 2000 ETF (IWM) is fighting with its own topping pattern. The blow-off tops from last summer still stand as resistance despite a hot streak upward from 50DMA support (the red line). IWM completely stalled the last two days, a teaser for both bears and bulls. I took profits on my last IWM call options.
The Short-Term Trading Call With Bearish Engulfing Tops
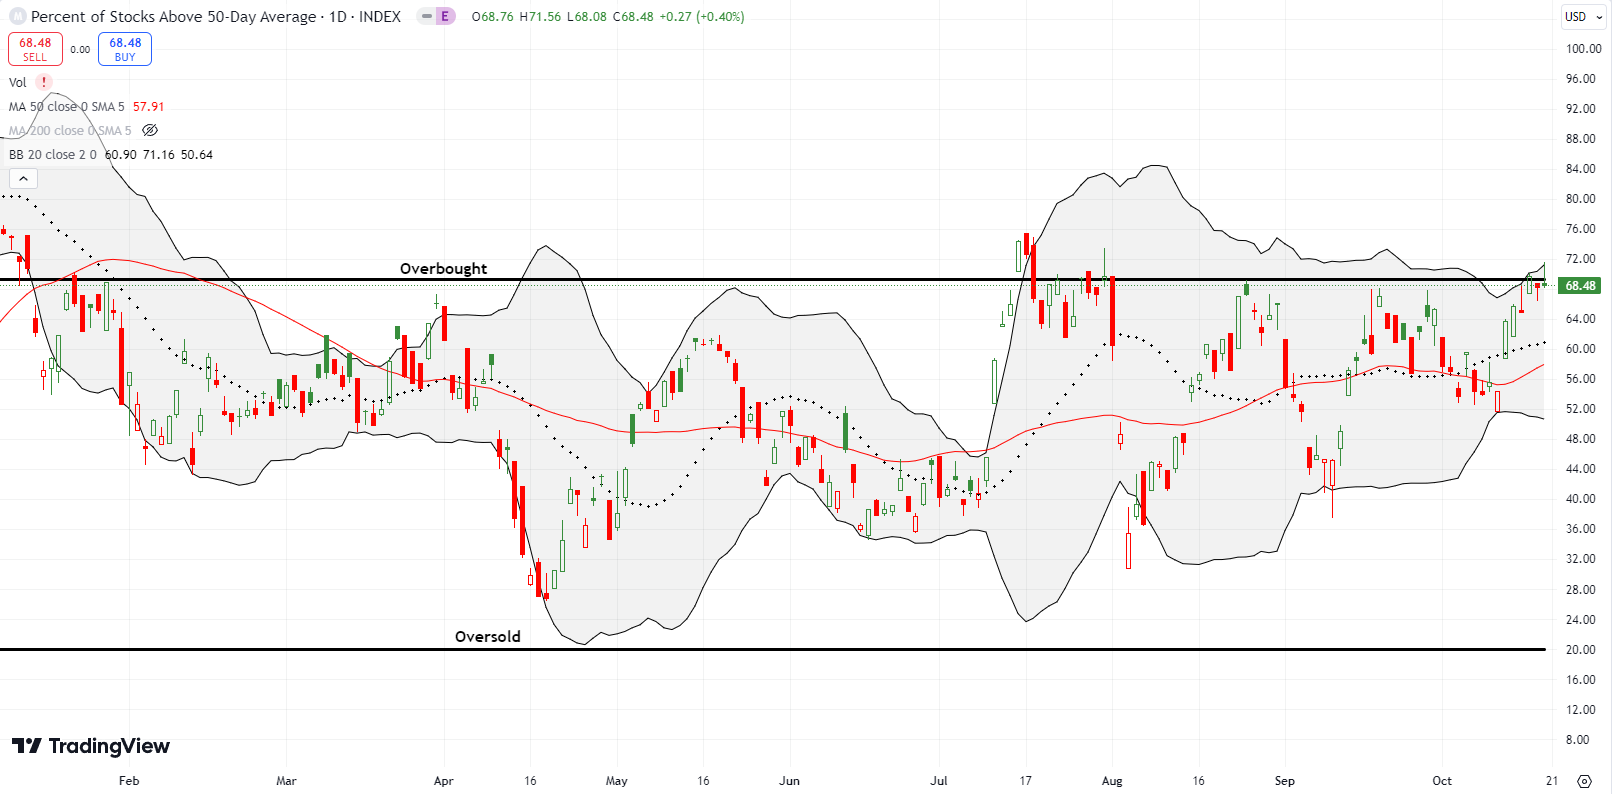
- AT50 (MMFI) = 68.5% of stocks are trading above their respective 50-day moving averages
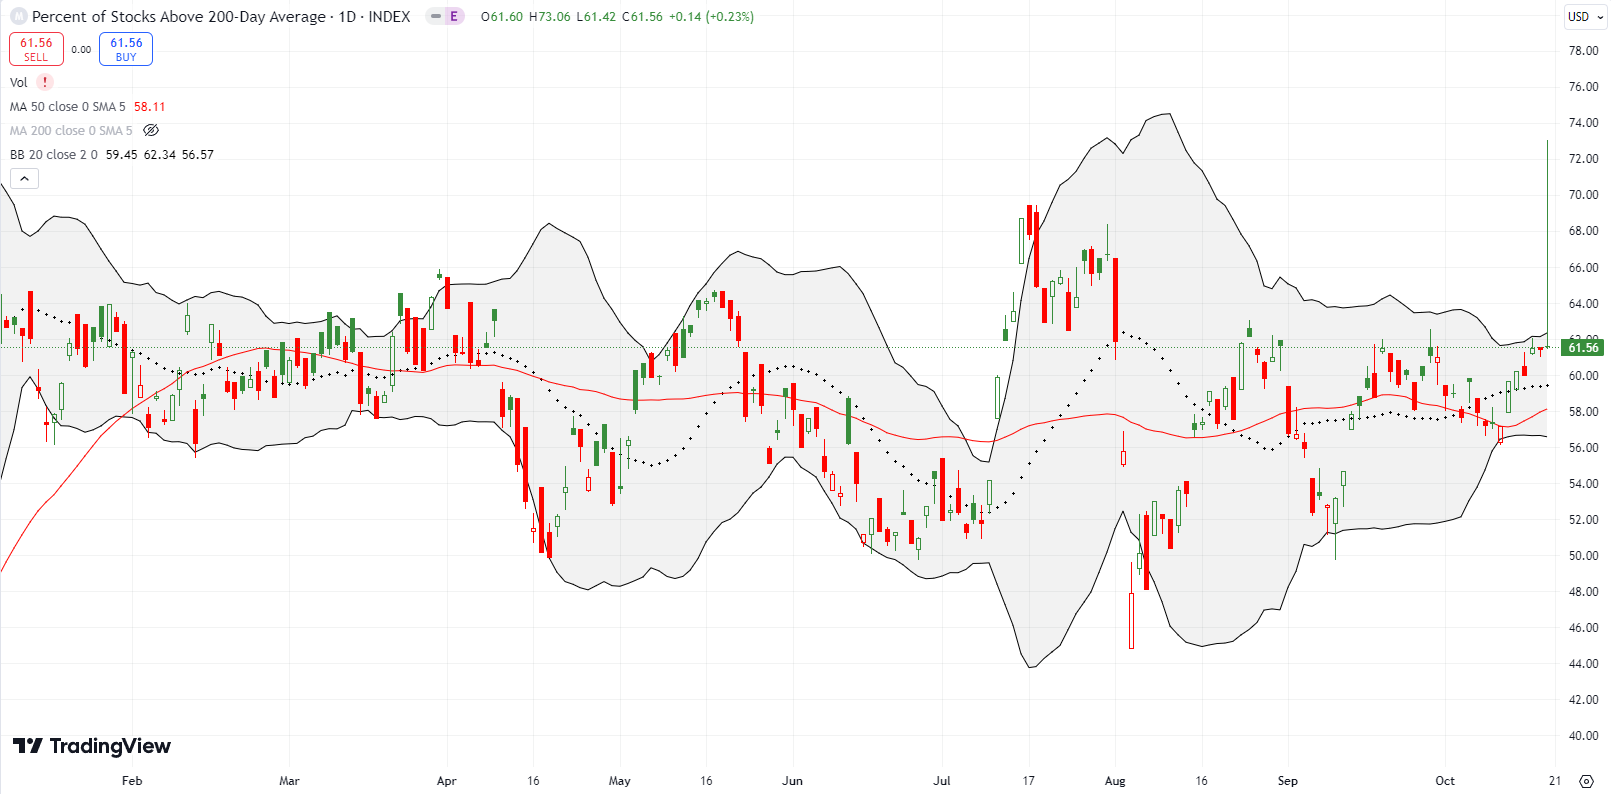
- AT200 (MMTH) = 61.6% of stocks are trading above their respective 200-day moving averages
- Short-term Trading Call: cautiously bearish
AT50 (MMFI), the percentage of stocks trading above their respective 50DMAs, is doing its own bear teaser by closing just under the overbought threshold three days in a row. On Friday, my favorite technical indicator faded sharply from 71.6%. Per the AT50 trading rules, this trading action is bearish but awaiting confirmation with a lower close for AT50. I was a little aggressive in switching the short-term trading call from neutral to cautiously bearish on the first test of the overbought threshold on Tuesday. Regardless, I am still seeing a lot more bullish than bearish setups. In fact, and ironically, I am most excited about a collection of stocks that look like they are turning around from recent lows. (I hope to write or record a quick post on these stocks soon).
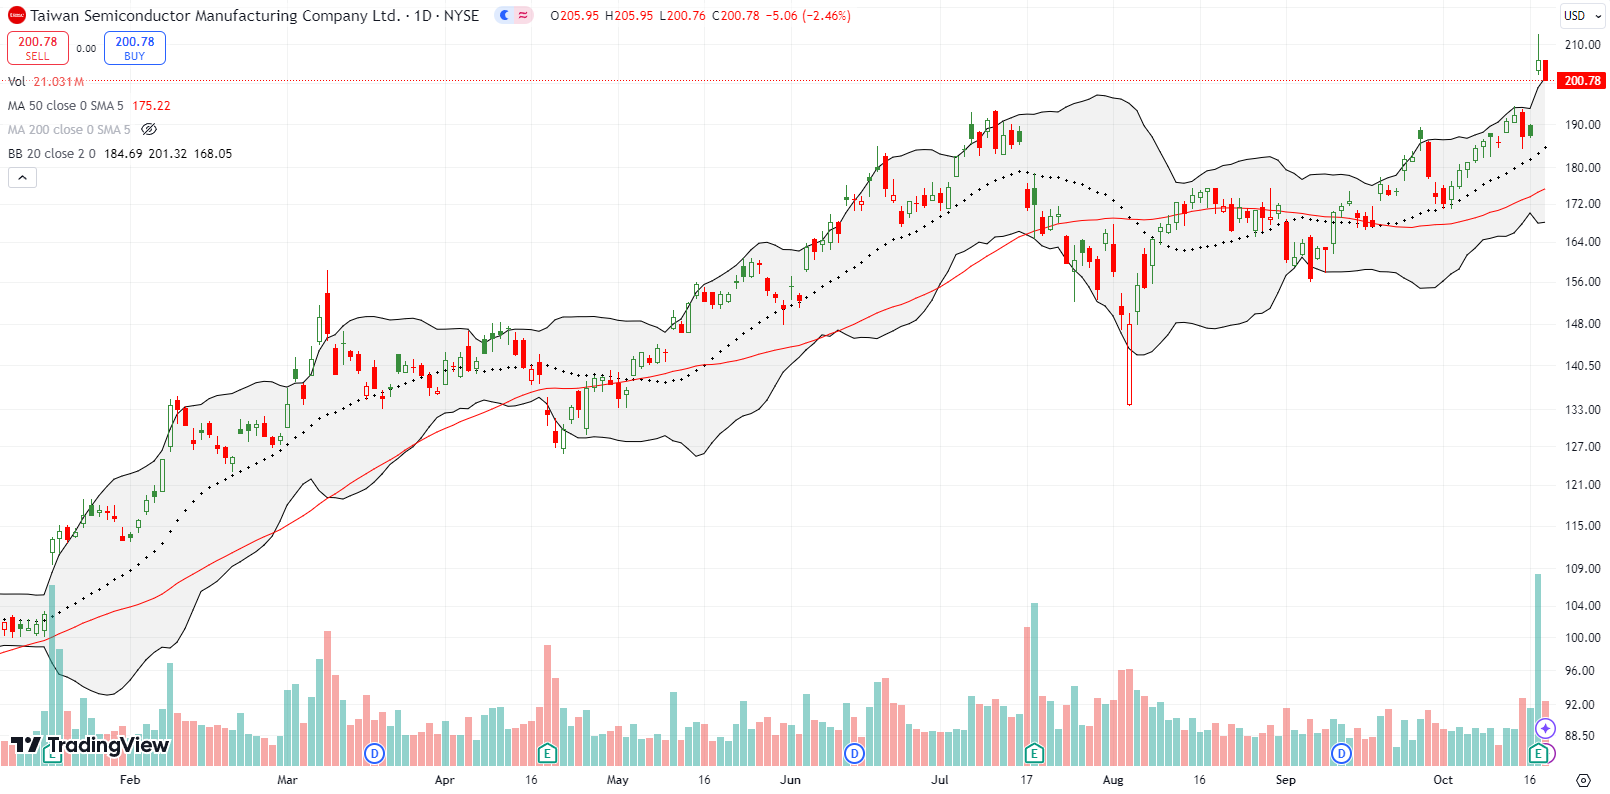
Taiwan Semiconductor Manufacturing Company Ltd (TSM) single-handedly turned around the semiconductor sector two days after ASML Holding N.V. (ASML) deflated it with a disastrous earnings report. TSM soared to an all-time high on a 9.8% post-earnings gain. However, TSM faded from the intraday high well above the upper Bollinger Band (BB). Sellers followed through by taking TSM down 2.5%. Just like that, TSM transformed from a bullish breakout to a bearish engulfing pattern. This bullish/bearish combination is another example of a bear teaser given the tailwinds definitely favor the buyers.
At the same time (not shown), NVIDIA Corporation (NVDA) stopped just short of invalidating its bearish engulfing topping pattern from June. I will be watching semis closely this week given these strong techincal signals.
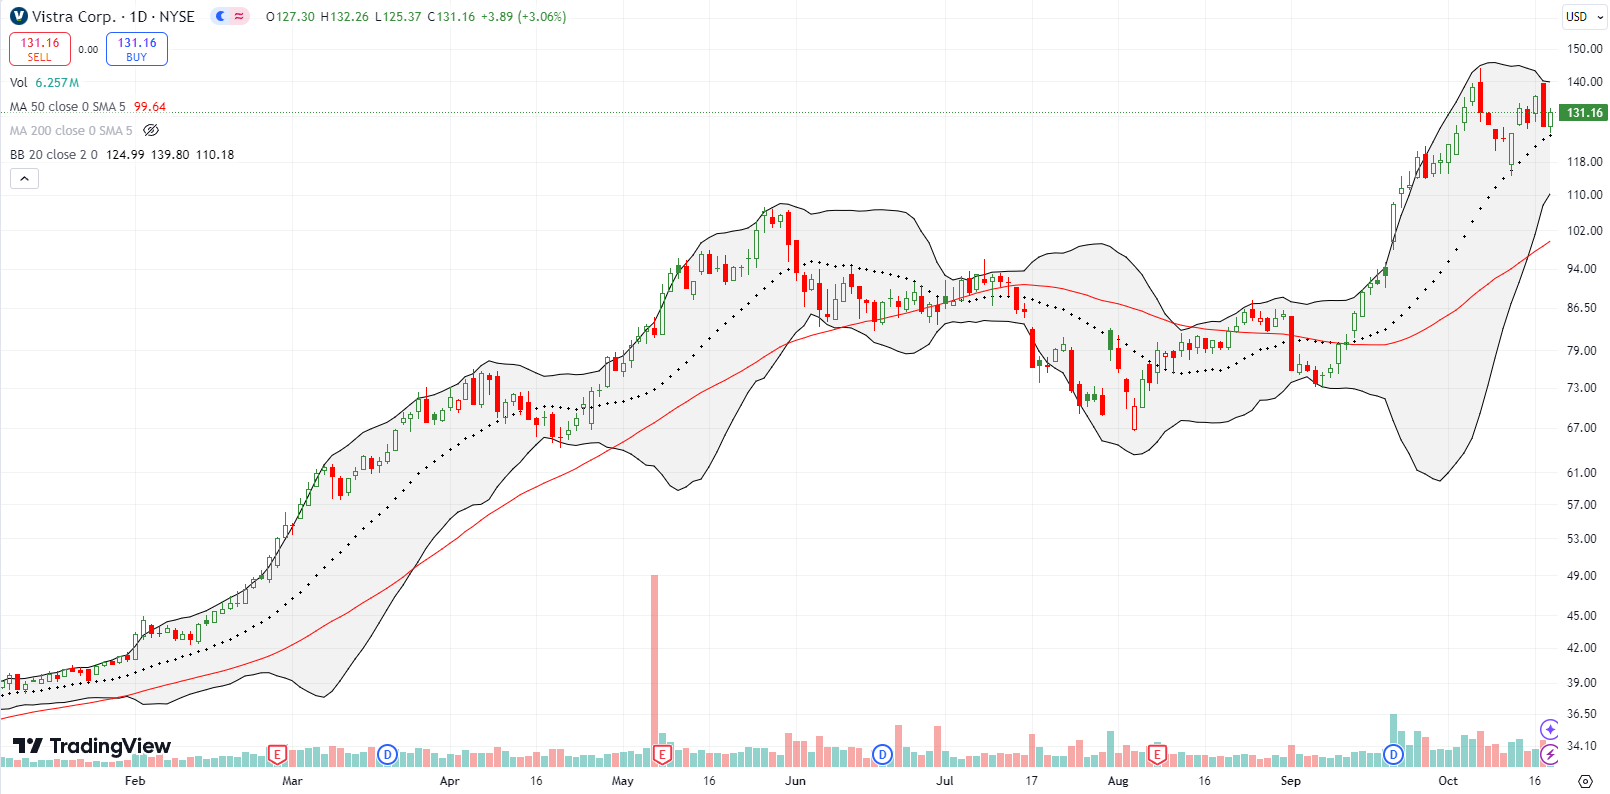
Popular integrated retail electricity and power generation company Vistra Corp (VST) has suddenly become on of my best holdings. VST’s latest breakout has been quite persistent and impressive. However, I had to put VST on watch for a double top after, you guessed it, a bearish engulfing top waved a red flag. This bearish engulfing occurred right where the first one occurred earlier in the month. I will be aggressive in protecting profits with an exit on a close below the 20DMA (the dashed line).
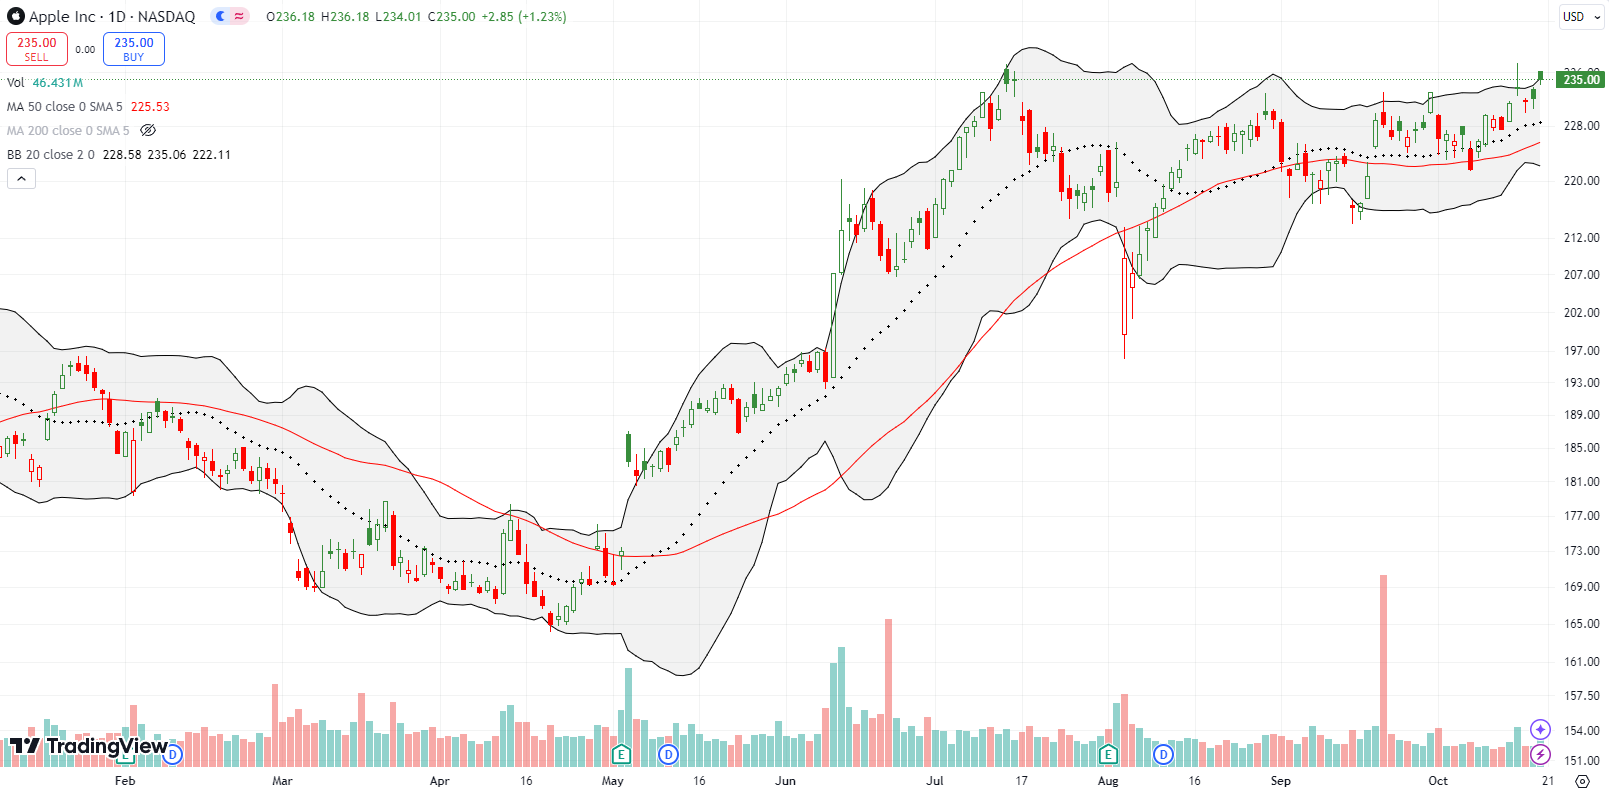
Apple Inc (AAPL) is teasing a bullish breakout. Twice last week AAPL faded from an intraday all-time high. On Friday, AAPL closed right at the all-time high set in July. The higher low since AAPL’s gap down in the August calamity biases the stock for upside pressure. Since the NASDAQ also topped out in July, I will treat an AAPL breakout as a major bullish event that essentially invalidates my recent switch to a short-term bearish trading call.
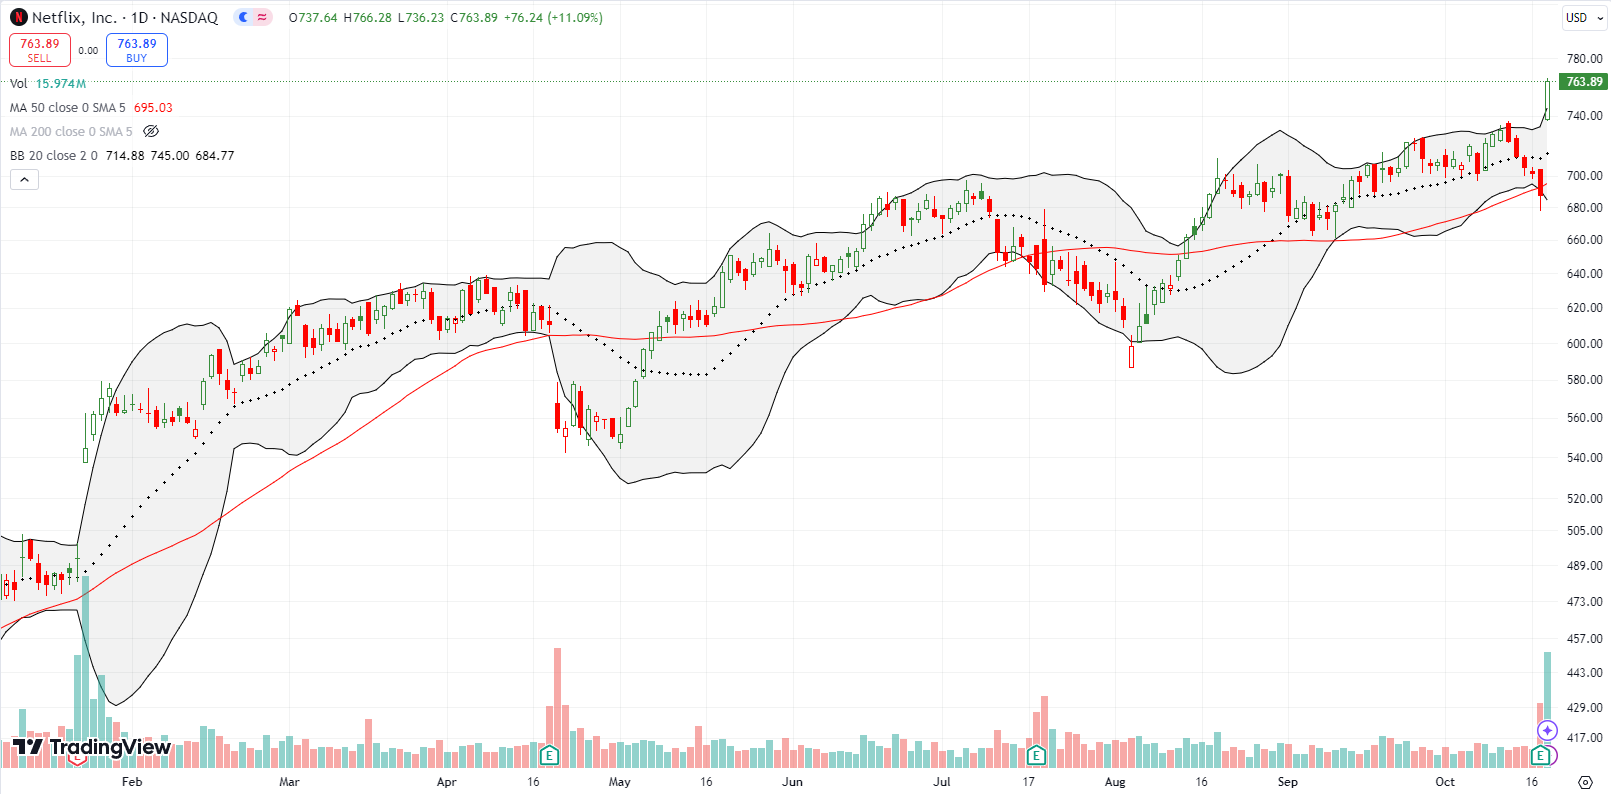
Netflix (NFLX) made a clean, bullish breakout thanks to an 11.1% post-earnings gain and a close near the highs of the day. The trend going into this all-time high speaks for itself. NFLX even traded to 50DMA support (the red line below) ahead of earnings. Charts of important stocks like NFLX reduce my expectations for the current bearish period.
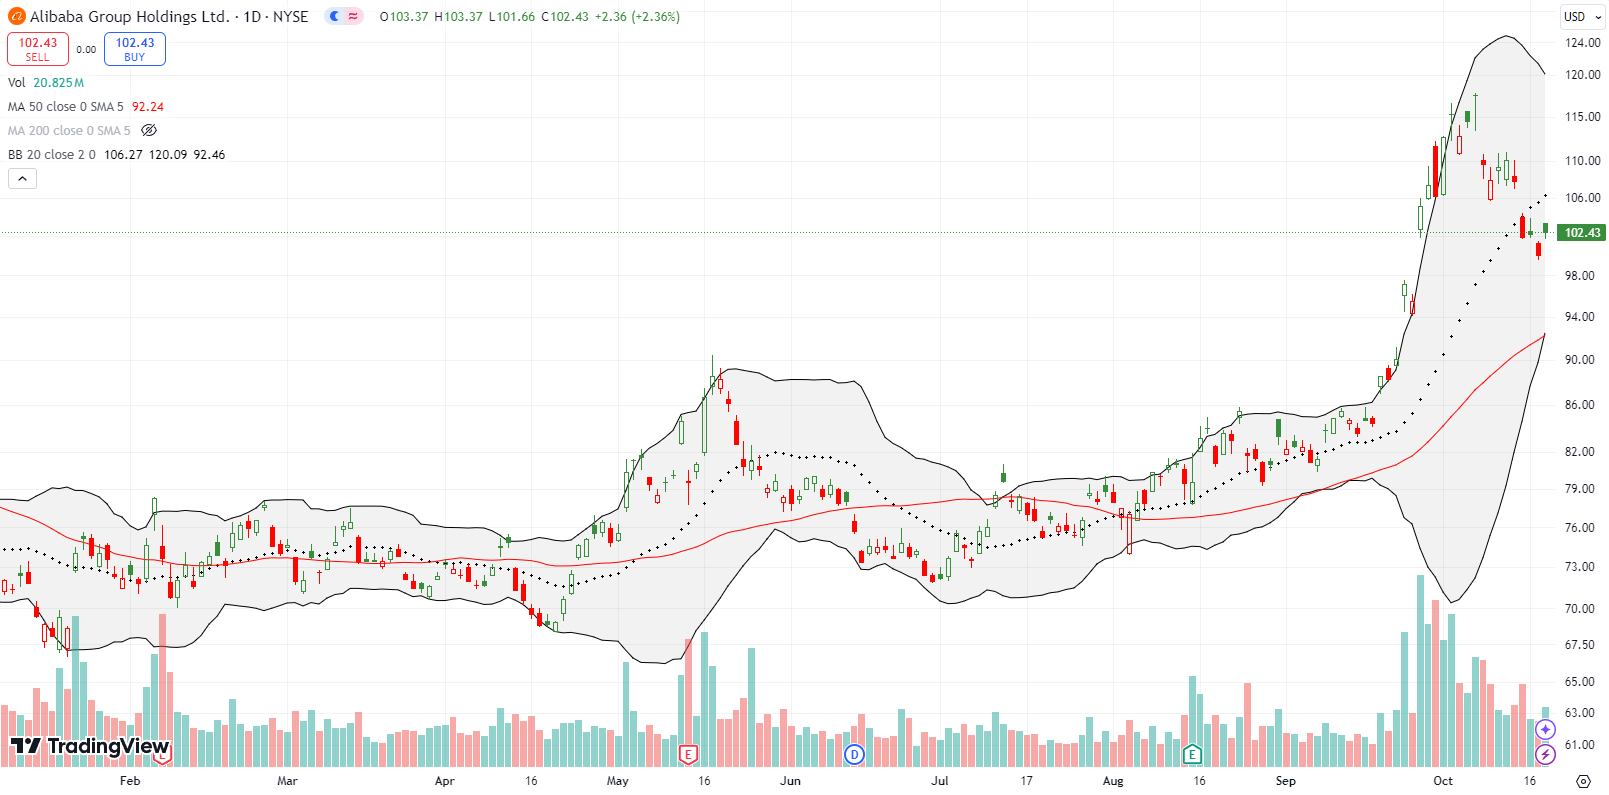
The excitement over Chinese stocks has quickly faded as the Chinese government has failed to deliver the full package of goodies that investors want. This disappointment catalyzed the inevitable reversal from the parabolic run-up. I am assuming this pullback and the churn last week sets up the next phase of volatility. Accordingly I bought a fresh set of call options. I created a hedge with put options on KraneShares CSI China Internet ETF (KWEB). Given BABA’s 20DMA breakdown, the stock is at high risk of tumbling to 50DMA support….ditto for KWEB.
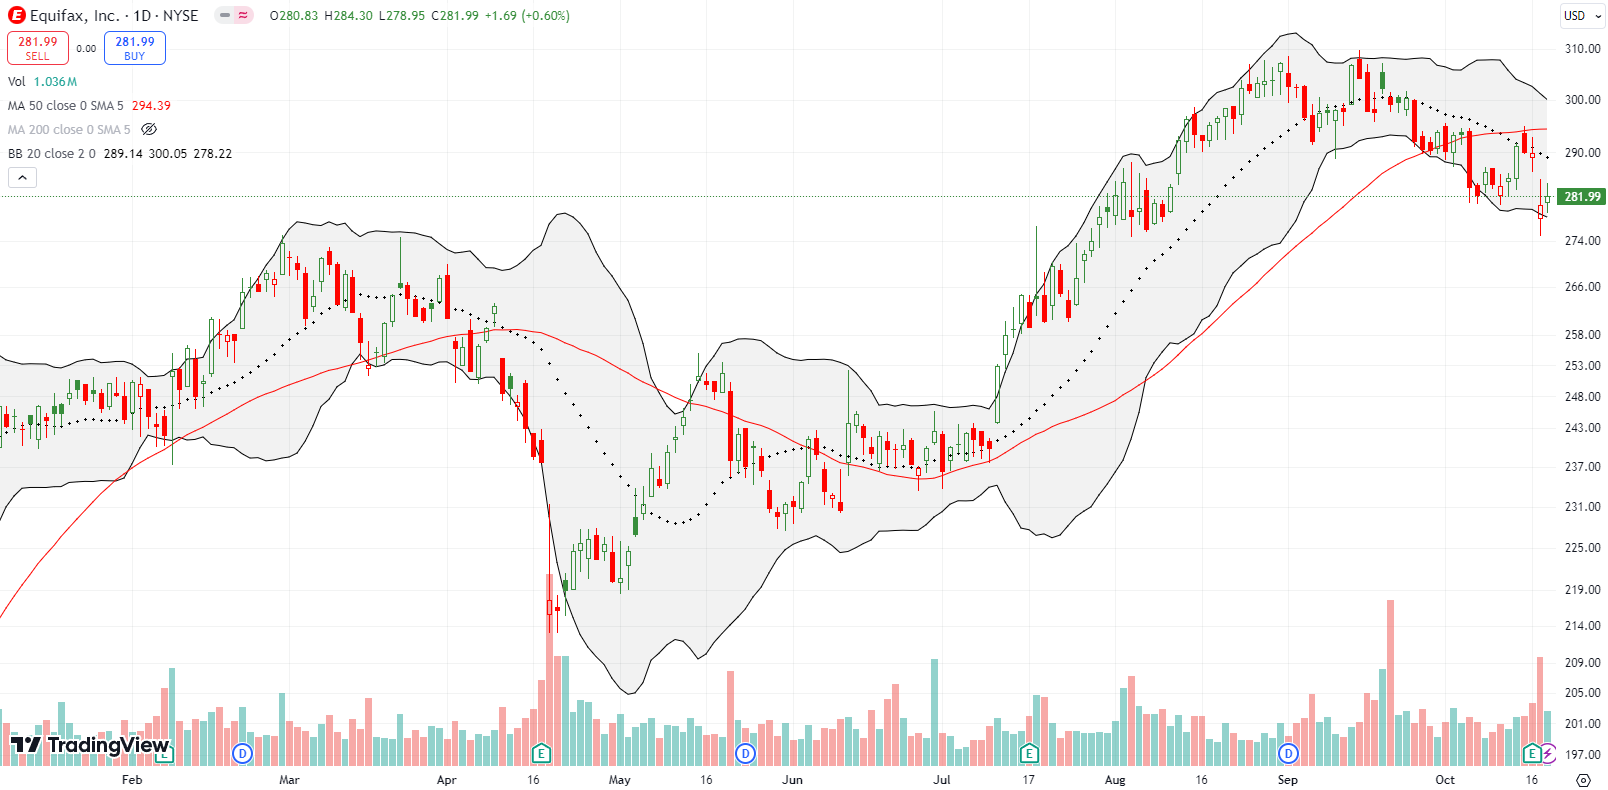
Equifax, Inc (EFX) set up a more classic bearish pattern. After a 3.4% tumble from 50DMA resistance, EFX failed to recover. A pre-earnings failure at 50DMA resistance and a 3.3% post-earnings gap down solidly plants EFX in bearish territory.
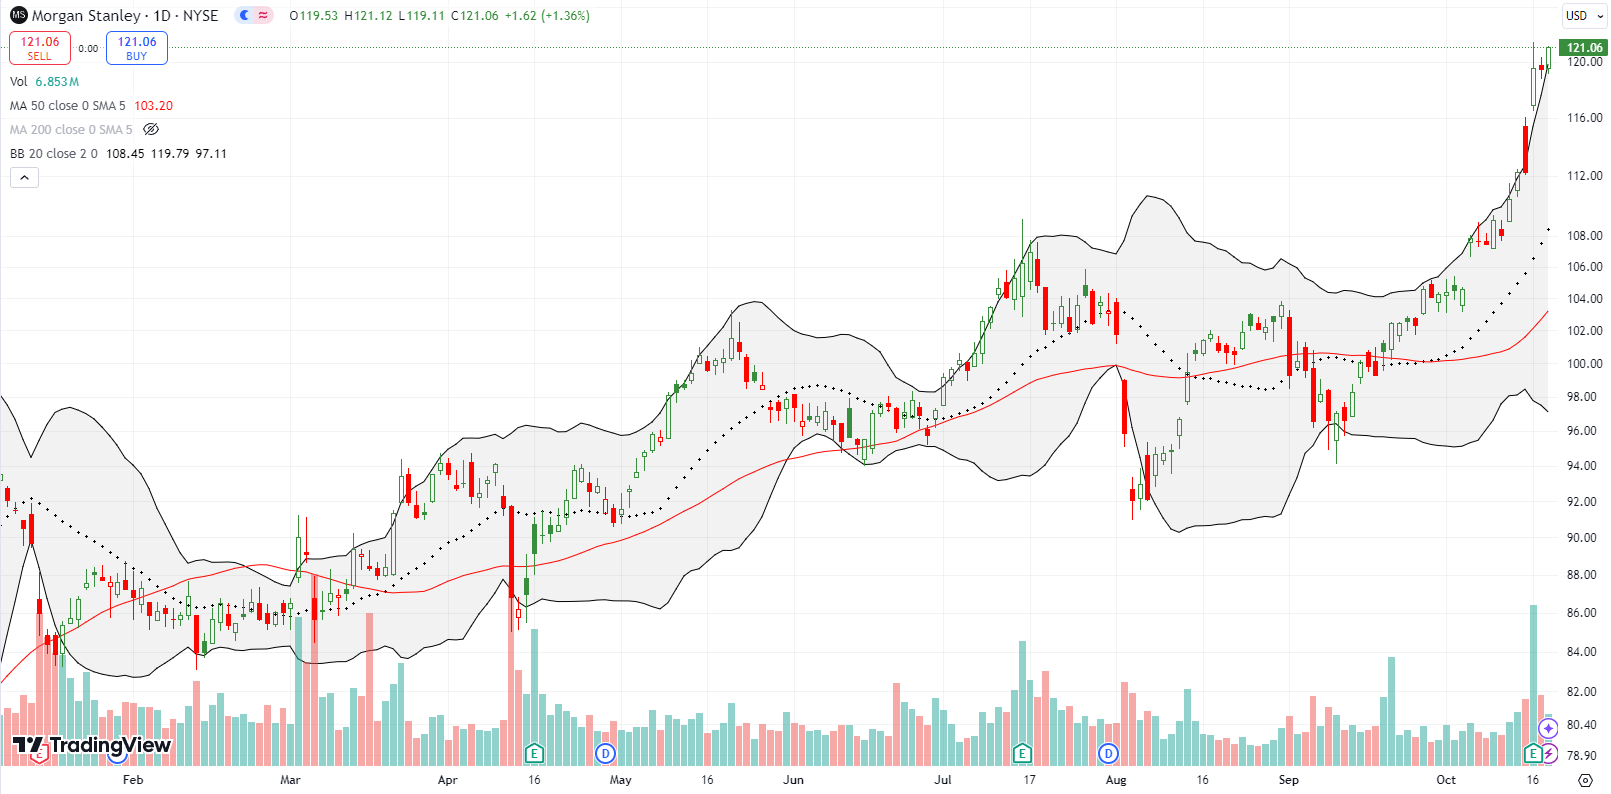
Morgan Stanley (MS) is helping to lead financials on a bullish run. MS almost went parabolic last week with a 6.5% post-earnings gain to an all-time high. I am still waiting for a buy entry. Meanwhile, bullish financials paint the bearish engulfing patterns as bear teasers.
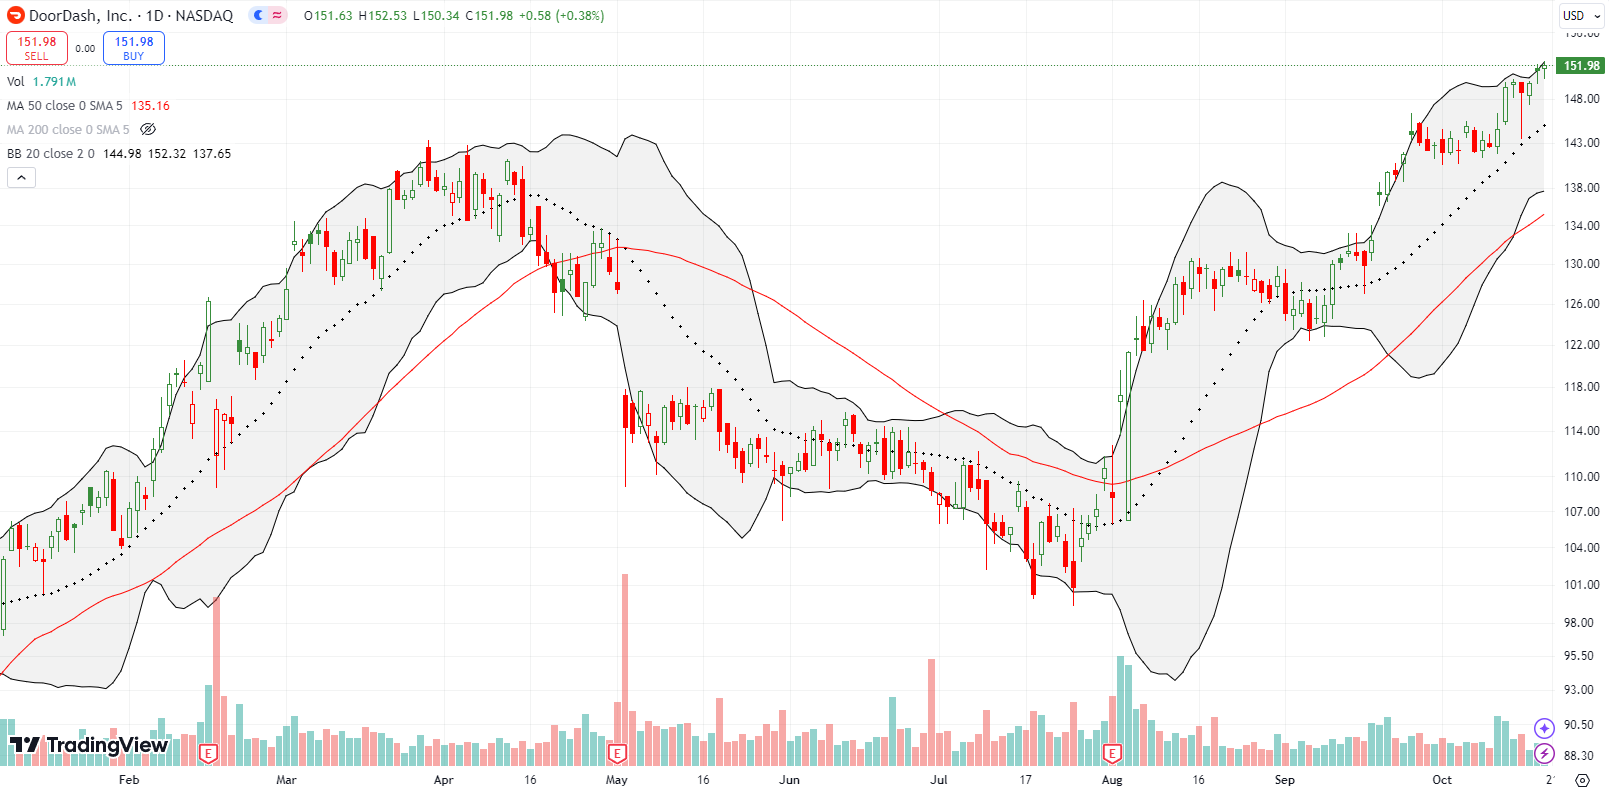
DoorDash, Inc (DASH) provided a brief entry with a test of 20DMA support, but it flashed too quickly for me to jump in with a new trade. Buyers continued from there to send DASH to a new 2-year high. DASH created another teaser for the bearish short-term trading call.
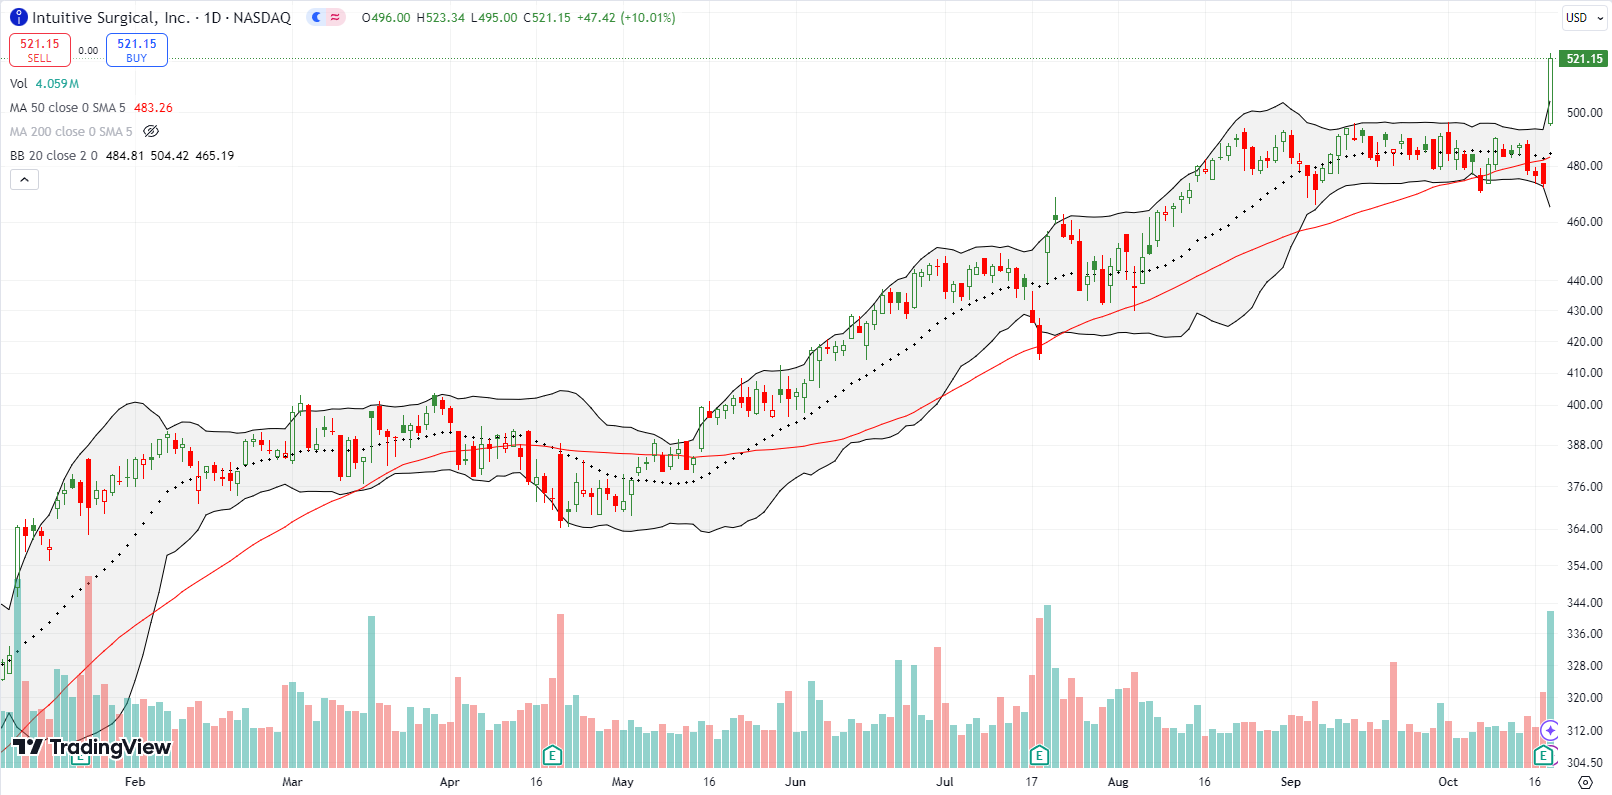
Intuitive Surgical, Inc (ISRG) surged to a new all-time high with a 10.0% post-earnings gain. ISRG bears were teased with two 50DMA breakdowns ahead of earnings. ISRG also had a 50DMA breakdown ahead of its last earnings.
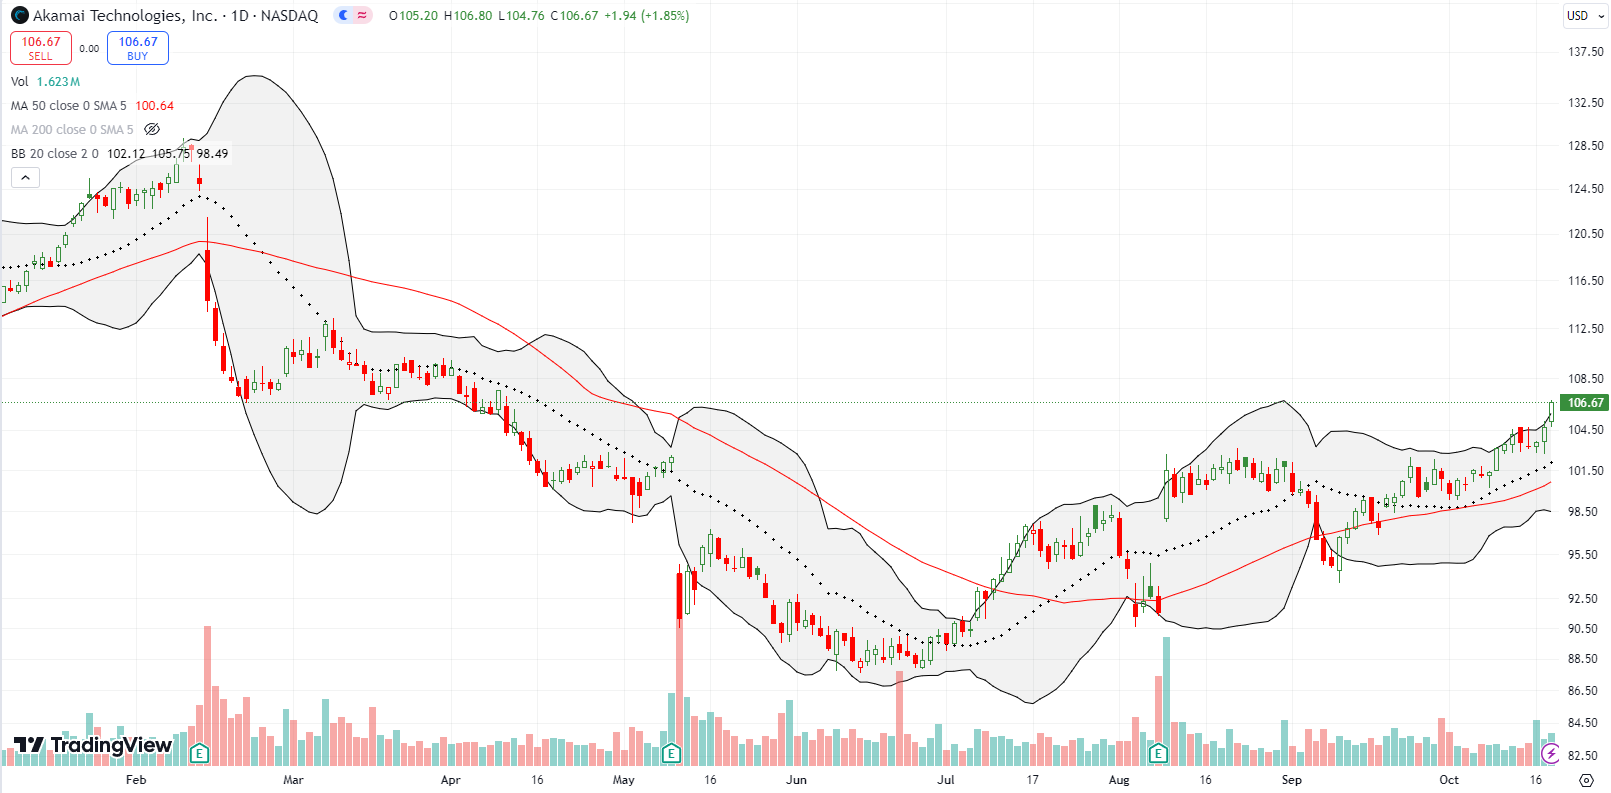
Akami Technologies, Inc (AKAM) did not fully reverse its post-earnings gap up as I feared. Buyers stepped into a confirmed 50DMA breakdown and have churned AKAM higher ever since. AKAM shot up on Friday by 1.9% and closed at a 6 1/2 month high. I am now planning to hold this position through at least the next earnings report.
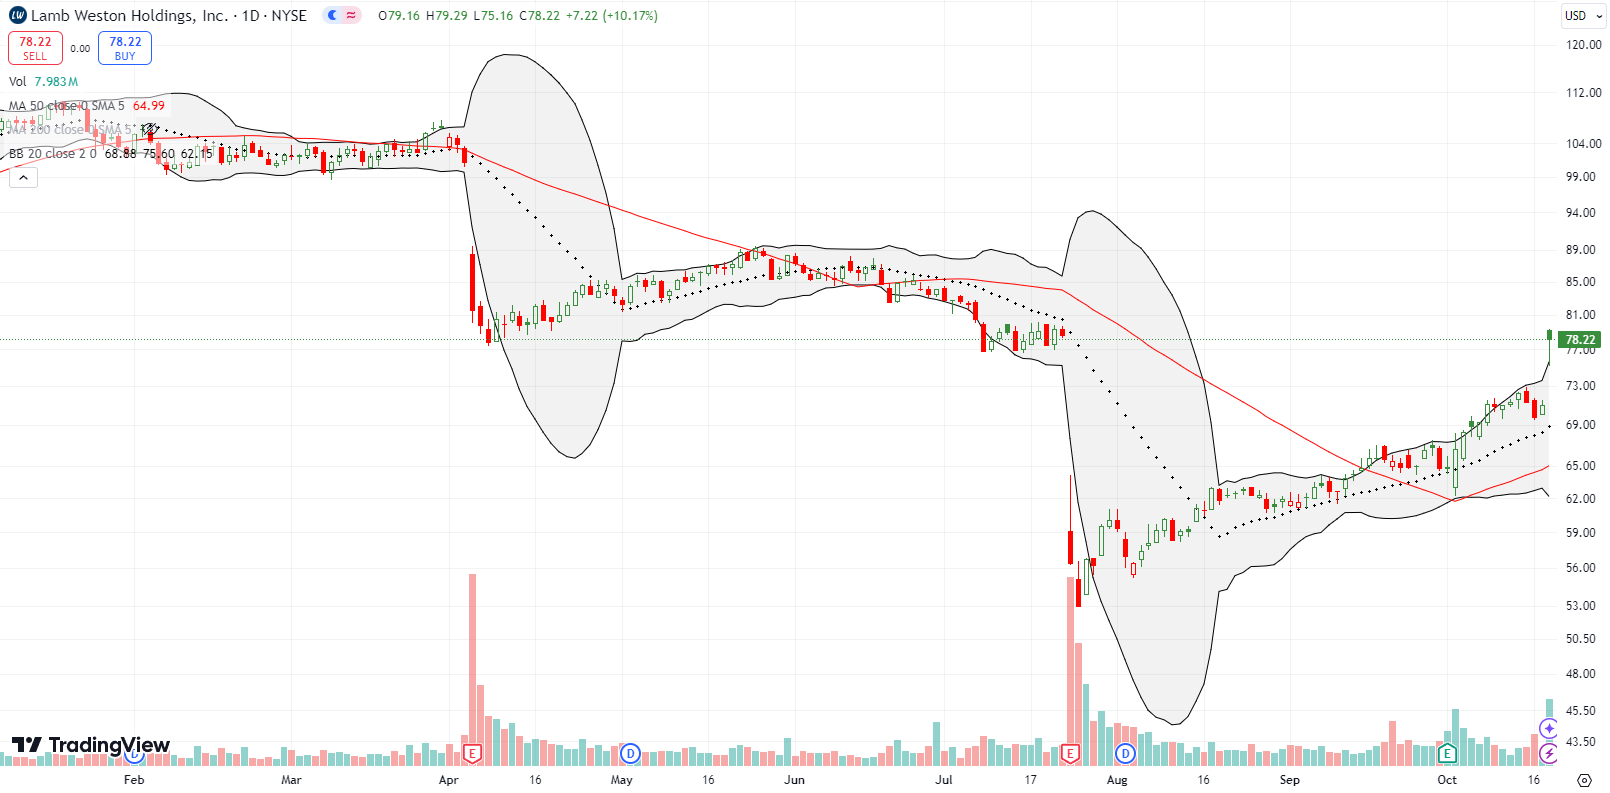
Two months ago I made a case for bottom-fishing in Lamb Weston Holdings, Inc (LW). The stock triggered my buy condition soon after. Since then, LW has steadily drifted higher. The buy signal got the best validation possible on Friday with a 10.2% pop that finished reversing July’s post-earnings gap down. The excitement came on news that Jana Partners purchased 5% of LW and wants to advocate for a sale of the company. This kind of bargain hunting is a timely reminder that this market still cannot support bearish cases for a sustained period. Bears are also well-advised to avoid pressing bets.
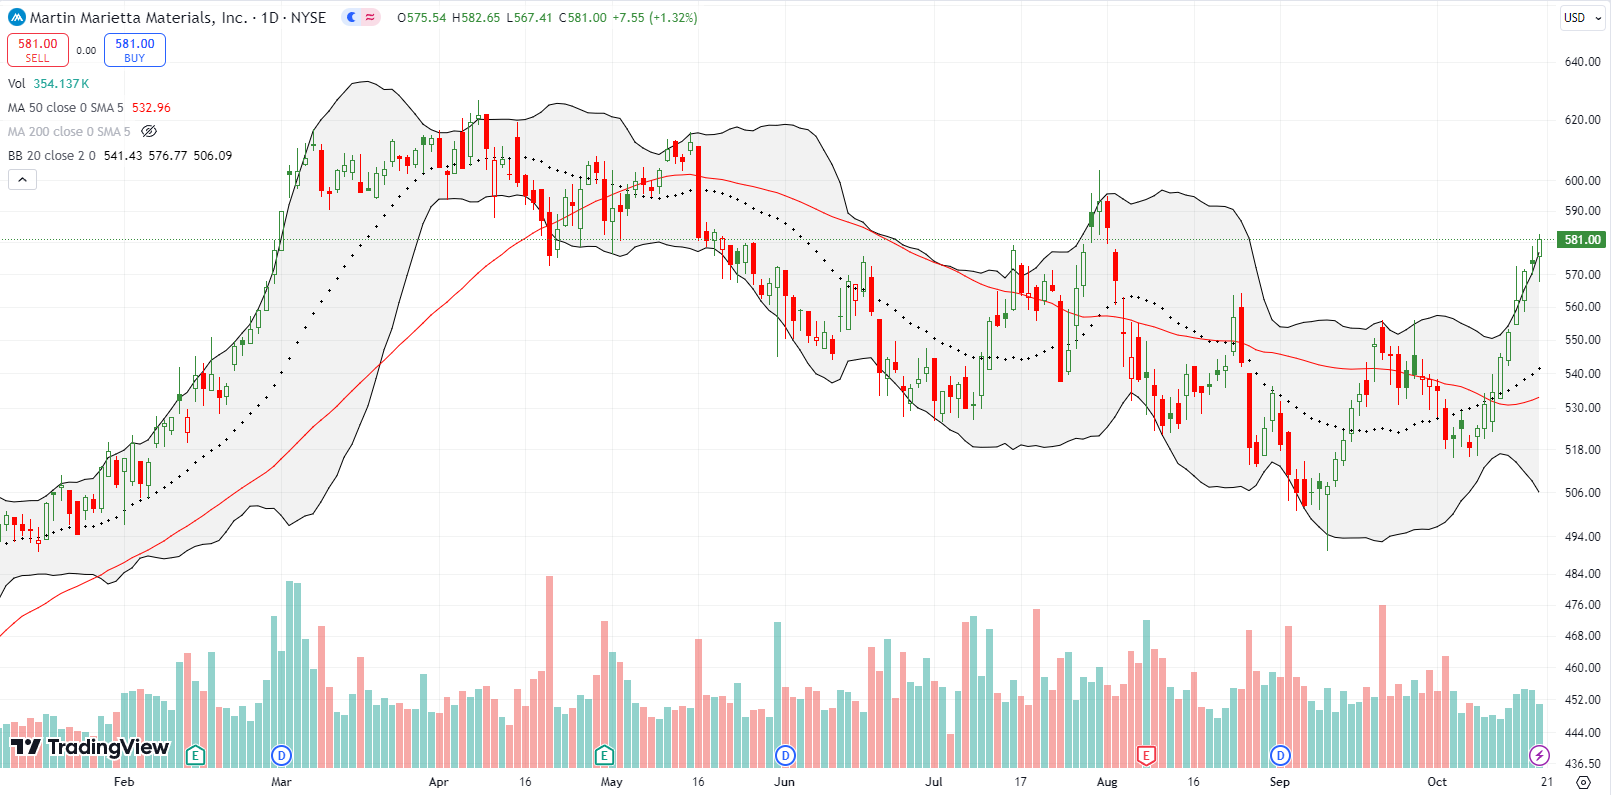
Two months ago I made a case for buying a long-term position in Martin Marietta Materials, Inc (MLM). MLM kept drifting lower until this month. The 9-day run-up has taken MLM right back to its July high. In due time, I expect a fresh breakout for MLM…yet one more reason I have low expectations on my bearish market call.
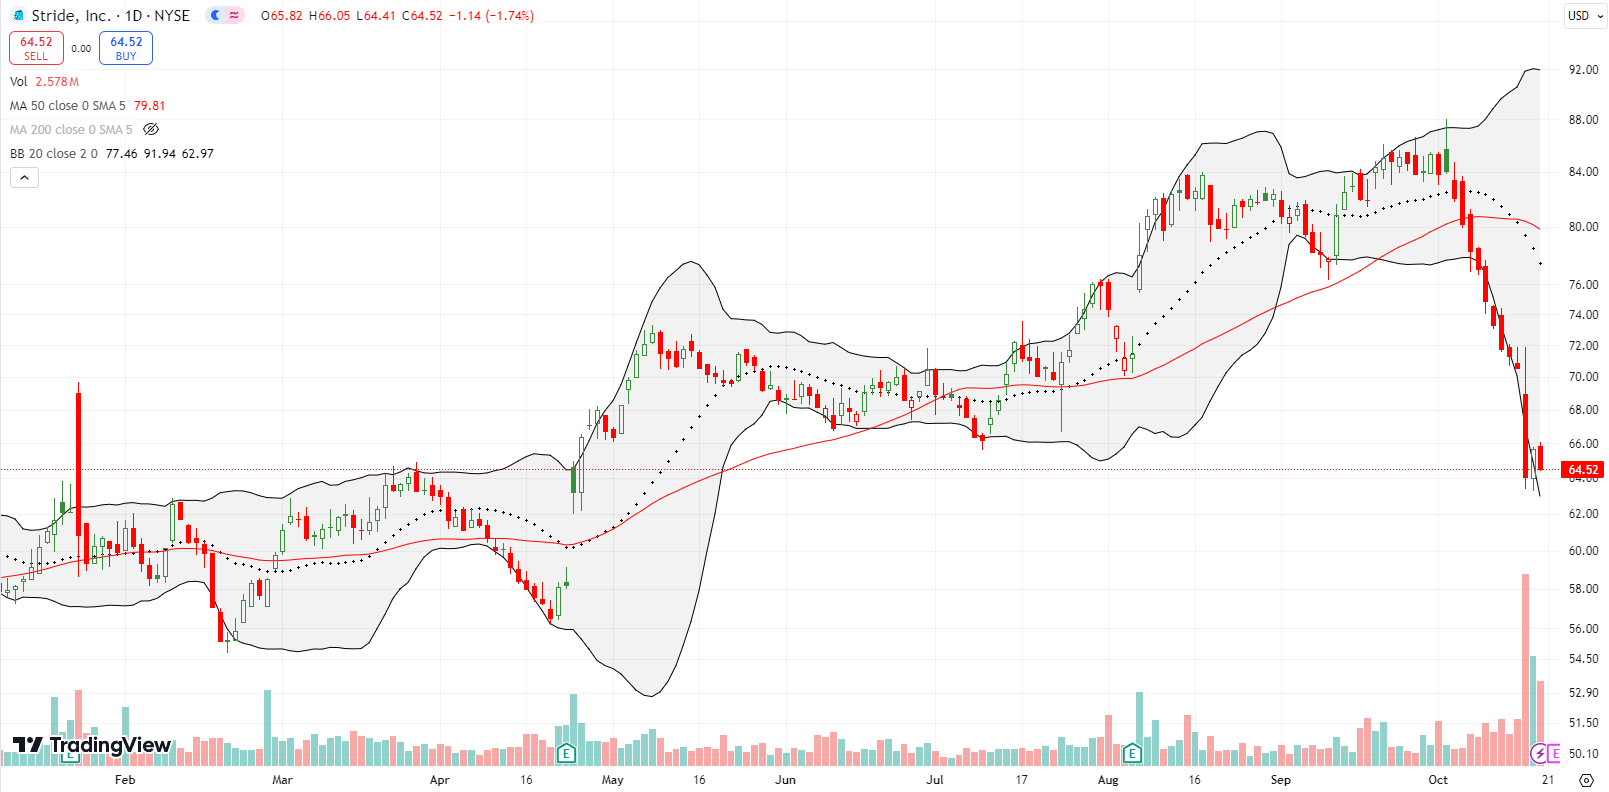
Stride, Inc (LRN) was one of the clearest and cleanest bearish cases I have seen in a while. Earlier this month, LRN sliced through 50DMA support and kept selling off. I jumped in with a put spread. I took profits on Wednesday as LRN’s selling pressure intensified. LRN fell 9.3% on news of a short-seller report. Needless to say, the technicals tell me that “someone” anticipated the release of this report. Price spoke volumes here!
Stride promptly refuted short-seller claims, so I am now keeping an eye on LRN for a sharp relief rally.
Be careful out there!
Footnotes
Subscribe for free to get email notifications of future posts!
“Above the 50” (AT50) uses the percentage of stocks trading above their respective 50-day moving averages (DMAs) to measure breadth in the stock market. Breadth defines the distribution of participation in a rally or sell-off. As a result, AT50 identifies extremes in market sentiment that are likely to reverse. Above the 50 is my alternative name for “MMFI” which is a symbol TradingView.com and other chart vendors use for this breadth indicator. Learn more about AT50 on my Market Breadth Resource Page. AT200, or MMTH, measures the percentage of stocks trading above their respective 200DMAs.
Active AT50 (MMFI) periods: Day #228 over 20%, Day #127 over 30%, Day #51 over 40%, Day #26 over 50%, Day #6 over 60%, Day #66 under 70%
Source for charts unless otherwise noted: TradingView.com
Full disclosure: long SPY put spread, long IWM shares, long QQQ put spread, long MLM, long AKAM, long BABA calls, long KWEB puts, long LW, long VST
FOLLOW Dr. Duru’s commentary on financial markets via StockTwits, Twitter, and even Instagram!
*Charting notes: Stock prices are not adjusted for dividends. Candlestick charts use hollow bodies: open candles indicate a close higher than the open, filled candles indicate an open higher than the close.


