

Stock Market Commentary
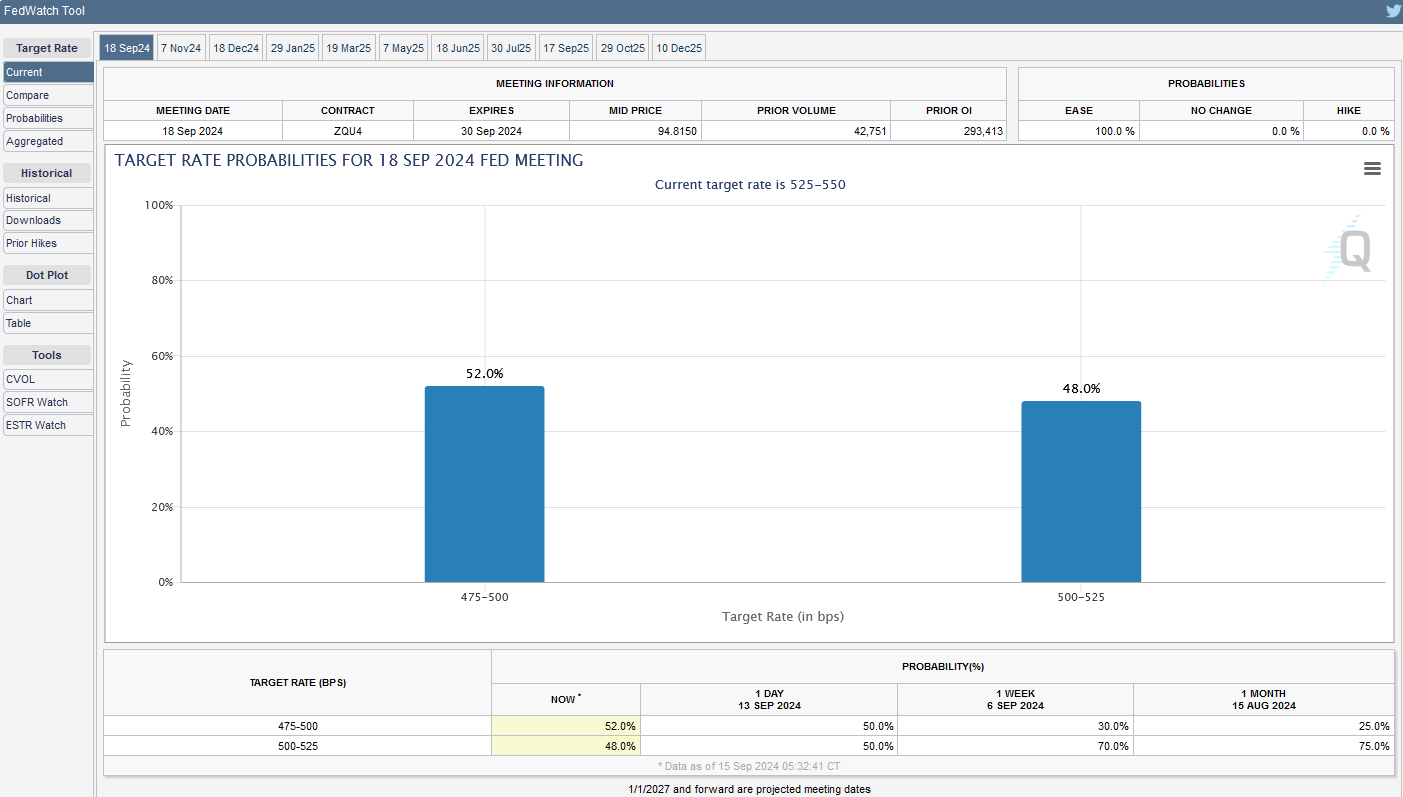
The stock market poetically swung from the depths of despair with a seasonal September drawdown to a sharp rebound in giddy anticipation of rate cuts from the Federal Reserve on Wednesday. The highly anticipated meeting has the potential to set the market’s tone for the remainder of the year. If Chair Jerome Powell sets an explicit roadmap for rate cuts, the market could quickly rally to price in the entire package. If Powell decides to tease the market with more step-by-step, meeting-by-meeting, data point by data point decision-making, then an impatient market could quickly sell-off in disappointment. Importantly, the market is split evenly on whether the Fed will nibble at rates with a 25 basis point cut (the Fed is behind!) or take a meaningful bite with a 50 basis point cut (the Fed is terrified of economic weakness!). Thus, either choice has the potential to disappoint half the market.
No matter what happens with the Fed, the Bank of Japan (BoJ) is waiting in the wings to cause yet more volatility in the market. The BoJ meets Friday morning, Tokyo time. Their decision and/or commentary has the potential to send the yen soaring which in turn would raise fresh fears of a further unwind of the carry trade. Once again, I remind traders to keep an eye on the currency market, the Australian dollar versus the Japanese yen in particular. I am surprised stocks ended on such a strong note despite the reversal in AUD/JPY reversal, so look out for softness in stock trading on Monday.

If the market sustains a bullish response to the Fed’s meeting, I will be even more focused on small caps. My favorite permabull Tom Lee rolled out a revised, yet still bullish, prognostication going into and past the Fed meeting. He also had some fascinating market statistics (emphasis mine):
- When the Fed has cut rates while in a soft landing or no landing, the win ratio for markets 6, 9 months higher is almost 100%.
- Post-election markets almost always rally, so November/December looks good.
- The policies of both candidates are good enough for the market to do well next year.
- If you took the ten worst first weeks of September, the ten times a September was down 2.5% or more, 10 out of 10 times, the market never finished positive for the month.
- When the market begins to believe the Fed is going to move rates back towards neutral, and that’s both cost of money, mortgages, auto loan rates, you know, these are really big tailwinds. That’s why I want to make a very educated bet with high probability that small caps will do very well in the next 12 months, even between now and year-end.
Let’s get giddy with it.
The Stock Market Indices
The S&P 500 (SPY) gained ground every day of last week. The index had its most important gain on Wednesday when buyers staged a major upside reversal from lows that looked set to continue the month’s big drawdown. The S&P 500 ended the week nearly reversing all of the month’s previous losses. The trading action looks like a seesaw with one week down big and the next week up big. This sharp swing in sentiment looks like chaotic pre-Fed positioning. Thus, I strongly suspect a big move up or down will follow the Fed’s decision.
The S&P 500 offers some key technical levels to follow the momentum. A breakout to new all-time highs should be bullish. A fresh 50DMA breakdown should flag an imminent resumption of the selling that started the month. (ShadowTrader stepped through a fascinating short-term trading setup ahead of the Fed; he is convinced that last week’s giddy action is poorly supported).
")
The NASDAQ (COMPQ) got even closer to erasing its original big drawdown for the month. The tech laden index gained 6.0% for the week, far ahead of the S&P 500’s 4.0% giddy run. Both indices confirmed 50DMA breakouts. Both indices are staring down immediate resistance from the previous high.
")
The iShares Russell 2000 ETF (IWM) gained 4.3% for the week. Friday’s 2.5% gain generated a 50DMA breakout. I sold my last tranche of IWM call options on the previous day as I worried about 50DMA resistance holding. In the coming week I will look to refresh a multi-month trade as my last multi-month call spread looks poised to fail with this week’s options expiration…unless the market gets turbo giddy. (September 17 correction: I forgot that in the last IWM run-up I rolled op the long side of the call spread to lock in profits. So with IWM up another 1% at the time of this correction, I was able to close out the remaining position with profits as well. Now, I only own IWM shares).
")
The Short-Term Trading Call While Giddy
- AT50 (MMFI) = 57.2% of stocks are trading above their respective 50-day moving averages
- AT200 (MMTH) = 57.9% of stocks are trading above their respective 200-day moving averages
- Short-term Trading Call: neutral
AT50 (MMFI), the percentage of stocks trading above their respective 50DMAs, struggled the first 3 days of the week along with IWM. Wednesday’s low put market breadth within reach of testing the August lows. The rebound from there seems to put overbought conditions within reach as a part of a giddy run-up into the Fed rate decision. Panning back, market breadth has simply chopped around almost the entire year. This trading range provides the clearest trading opportunities when my favorite technical indicator reaches for the edges of this trading range.
Redfin Corporation (RDFN) is my poster child for the giddy run into the Fed rate decision. The online real estate company capped a 55.2% weekly gain with a 25.7% surge on Friday. I am looking back at this move with incredulity both because of its extreme nature and because I completely missed the trade even as just about every day I talked about the stock with a cousin as a part of my “giddy” theme. I should have at least bought RDFN as a part of Wednesday’s major upside reversal.
")
The rally in financials finally caught my interest right at the all-time high at the end of August. The Financial Select Sector SPDR Fund (XLF) floated downward with the rest of the September pullback and created a buyable dip. XLF bounced perfectly off 50DMA support. Before the bounce I actually bought put options as a hedge; I figured a 50DMA breakdown by XLF would confirm bigger trouble for the stock market. Now I want to flip right around and buy call options as part of the giddy run into the Fed’s rate decision.
However, I will stay my hand because last week also delivered some notably bad news from two important financials. JP Morgan Chase & Co (JPM) sliced through 50DMA support with a 5.2% loss after the bank announced rate cuts would notably reduce interest-based income and expenses next year would come in higher than analyst expectations. JPM looks poised to go yet lower and has likely topped given the tempered 2025 guidance. The same day Goldman Sachs (GS) confirmed 50DMA resistance with a 4.4% loss after announcing some poor business results.
")
As if JPM and GS were not enough bad news for the financials, Ally Financial Inc (ALLY) blindsided the market with bad news about its auto loans. The CFO said “over the course of the quarter, our credit challenges have intensified…Our borrower is struggling with high inflation and cost of living and now, more recently, a weakening employment picture.” ALLY lost 17.6% on the day. This extreme move wiped out ALLY’s gains for the year and then some. I sold a credit put spread in case ALLY followed-up with another extreme move. The drift the rest of the week suggests ALLY could stay afloat thanks to the giddy mood in the market. I go into the week short a put after the long puts expired on Friday. I will close this put on Monday.
")
While big banks drag on XLF, the regional banks are pulling away a bit. The SPDR S&P Regional Banking ETF (KRE) nudged over its 50DMA with a 2.7% gain on Friday. While KRE’s last high was a lower high, the ETF still looks like a buy as part of a giddy run into the Fed rate announcement.
")
Three months ago, I made the case for utility Dominion Energy (D) as a “catch-up” trade on increasing energy needs for AI. The timing looked perfectly bad as Dominion sold off in June. The steady rebound from there was a relief and validated my longer-term view. D closed the week at a 17-month high. I like utilities not just as energy sources for AI with voracious appetites but also as part of a rate sensitive trade and defense against looming fears of an economic slowdown.
")
Micron Technology, Inc (MU) was a roller coaster last week. I started the week bearish on MU as a breakdown below the August low was underway. I even pestered a friend who is a long-time MU bull about the potential for much lower prices. From there, MU joined Wednesday’s major upside reversal with a 4.4% gain. I moved into a Sept 90/95 call spread only to watch in ironic shock as MU tanked the next day on the heels of analyst downgrades. The downgrades included cuts in price targets to $125 and a gut-wrenching $67. With the stock down 7.2% at the intraday low, buyers suddenly regained their giddy. From that low to Friday’s close at the intraday high, MU gained 8.4% and once again looks poised for a run-up.
")
Paint manufacturer The Sherwin-Williams Company (SHW) snuck its way into the giddy pre-Fed trade. The stock gained 6.9% after July earnings and dropped sharply the very next day. After a lot of churn, and despite an intraday fade on Friday, SHW finds itself at an all-time high ahead of the Fed.
")
After Snap Inc (SNAP) suffered another post-earnings disaster, I implied that the odds for another epic rebound were much lower than before. Last week I watched as the stock crawled higher from a successful retest of its August and 11-month low. I concluded that the stock was actually positioning for a rebound rally. When news dropped after market that Yahoo’s CEO Jim Lazone joined the Board of Directors, I bought into a tiny (and surprising) after hours dip.
This board move could amount to nothing. However, given the moves Yahoo made late 2022 in selling its ad business to Taboola (TBLA) and last year announcing plans to return to the public market, I see this board move as the potential early signs of a Yahoo and SNAP combination/partnership. Both companies are internet/social media laggards and might be able to find some kind of revival with each other.
")
Just a week ago I described the recent woes of Birkenstock Holding plc (BIRK). Well the major upside reversal in the general stock market woke up BIRK. The stock’s rebound looks like a successful test of the year’s lows. So I jumped into shares on Thursday and added more on Friday. I am trading for a bounce back to 20 or 50DMA overhead resistance.
")
Similarweb Ltd (SMWB) blindsided investors after announcing a major stock holder would sell 3.5M shares at the discounted price of $7.85/share. This offering is huge for a stock that typically trades less than 400K shares in a day. SMWB did well well to close Friday above the offering price.
Even if 50DMA support survives, this massive sale has all but topped out the stock. SMWB’s abrupt gap down left behind a double top, and the shareholder signaled to the market that the stock was not worth the price at those highs. I wrote bullishly on SMWB last month but never found an entry point to make a buy. I now have little interest in buying the stock unless the market carves out an even steeper discount in shares.
")
Large shareholders threw another stock for a big loop last week. Plus-size retailer Torrid Holdings Inc (CURV) announced an offering of 8M shares priced at a mere $4.00/share. Like SMWB, this volume of shares is a big deal given the stock typically trades less than 400K shares a day. This offering sent CURV right back to its intraday low from last month. The sizeable discount is a major vote of no-confidence in the recent highs which are now double current levels.
While both SMWB and CURV are small stocks, they delivered sharp reminders that a stock and stock market trading at lofty levels encourages profit-taking by large holders.
")
")
")
Be careful out there!
Footnotes
Subscribe for free to get email notifications of future posts!
“Above the 50” (AT50) uses the percentage of stocks trading above their respective 50-day moving averages (DMAs) to measure breadth in the stock market. Breadth defines the distribution of participation in a rally or sell-off. As a result, AT50 identifies extremes in market sentiment that are likely to reverse. Above the 50 is my alternative name for “MMFI” which is a symbol TradingView.com and other chart vendors use for this breadth indicator. Learn more about AT50 on my Market Breadth Resource Page. AT200, or MMTH, measures the percentage of stocks trading above their respective 200DMAs.
Active AT50 (MMFI) periods: Day #203 over 20%, Day #102 over 30%, Day #26 over 40%, Day #1 over 50% (overperiod ending 5 days under 50%), Day #15 over 60%, Day #41 under 70%
Source for charts unless otherwise noted: TradingView.com
Full disclosure: long SPY put spread, long IWM shares, call spread; long BIRK, long SNAP, long MU call spread, long D, short ALLY put option, short AUD/JPY
FOLLOW Dr. Duru’s commentary on financial markets via StockTwits, Twitter, and even Instagram!
*Charting notes: Stock prices are not adjusted for dividends. Candlestick charts use hollow bodies: open candles indicate a close higher than the open, filled candles indicate an open higher than the close.