Stock Market Commentary
I saw a simple test for distinguishing bearish and bullish signals after META’s post-earnings swoon last month. A quick rebound following failed tests at resistance complicated the picture. The price technicals and dynamics returned to simple as a synchronized yet quiet breakout unfolded last week across the S&P 500 and the NASDAQ. I call them quiet because there were no big bang, positive headlines accompanying the breakouts (from my perspective), and the rest of the week “felt” quiet and meandering.
Still, the week started with these breakouts and buyers held firm the rest of the week. Thus, the stock market is back to a bullish position. Yet, a rapid slide back into complacency looms over the bullish tone. A simple 50DMA breakdown would be just as bearish as last week’s breakout is bullish.
The Stock Market Indices
In just one month, the S&P 500 (SPY) went from the most intense selling pressure since October, to a tease of resistance at its 50-day moving average (DMA) (the red line below) to what now looks like a simple yet quiet 50DMA breakout. Just like that, the index is ready to challenge its all-time high. The buying last week was just strong enough to push the S&P 500 against its upper Bollinger Band (BB) for the last two trading days. The upper BB is starting to turn upward, a move which suggests the index is ready to print new all-time highs. I go into this week with a fresh SPY call spread.
The NASDAQ (COMPQ) dove deeper than the S&P 500 and also rebounded more sharply. The tech-laden index also printed a quiet breakout but quickly stalled after one more day of gains. The NASDAQ spent the last three days of the week churning just below its all-time high. Regardless, the NASDAQ looks positioned to resume its ascent in due time. I go into this week with a QQQ call spread.
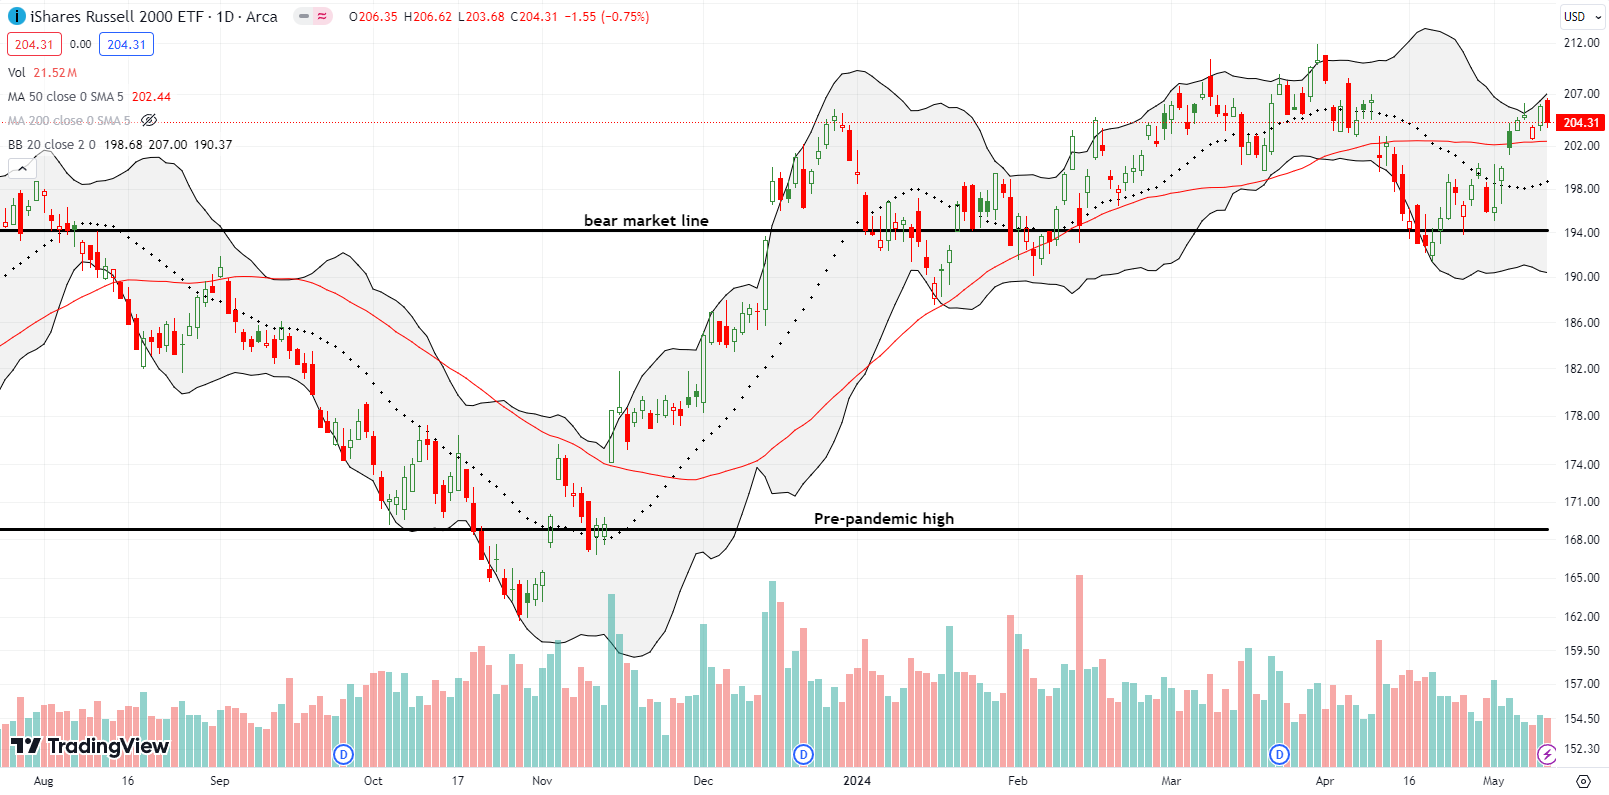
The iShares Russell 2000 ETF (IWM) went from bear market (yet again) to recovery to a marginal 50DMA breakout a day ahead of the S&P 500 and the NASDAQ. While the ETF of small caps was first to cross key 50DMA resistance, it churned almost all week. IWM even lost 0.8% on Friday. I used that small pullback to buy IWM calls.
The Short-Term Trading Call With A Quiet Breakout
- AT50 (MMFI) = 54.3% of stocks are trading above their respective 50-day moving averages
- AT200 (MMTH) = 60.5% of stocks are trading above their respective 200-day moving averages
- Short-term Trading Call: cautiously bullish
AT50 (MMFI), the percentage of stocks trading above their respective 50DMAs, closed the week at 54.3%. My favorite technical indicator chopped all week for a net gain of 7 percentage points. AT50 is now right back to a range it held from February to early April. While there was no quiet breakout for AT50, I upgraded my trading call from neutral to cautiously bullish. AT50 still has some room before it gets to overbought territory (above 70%), and the quiet breakouts for the S&P 500 and the NASDAQ compel me to get bullish (on the indices in particular).
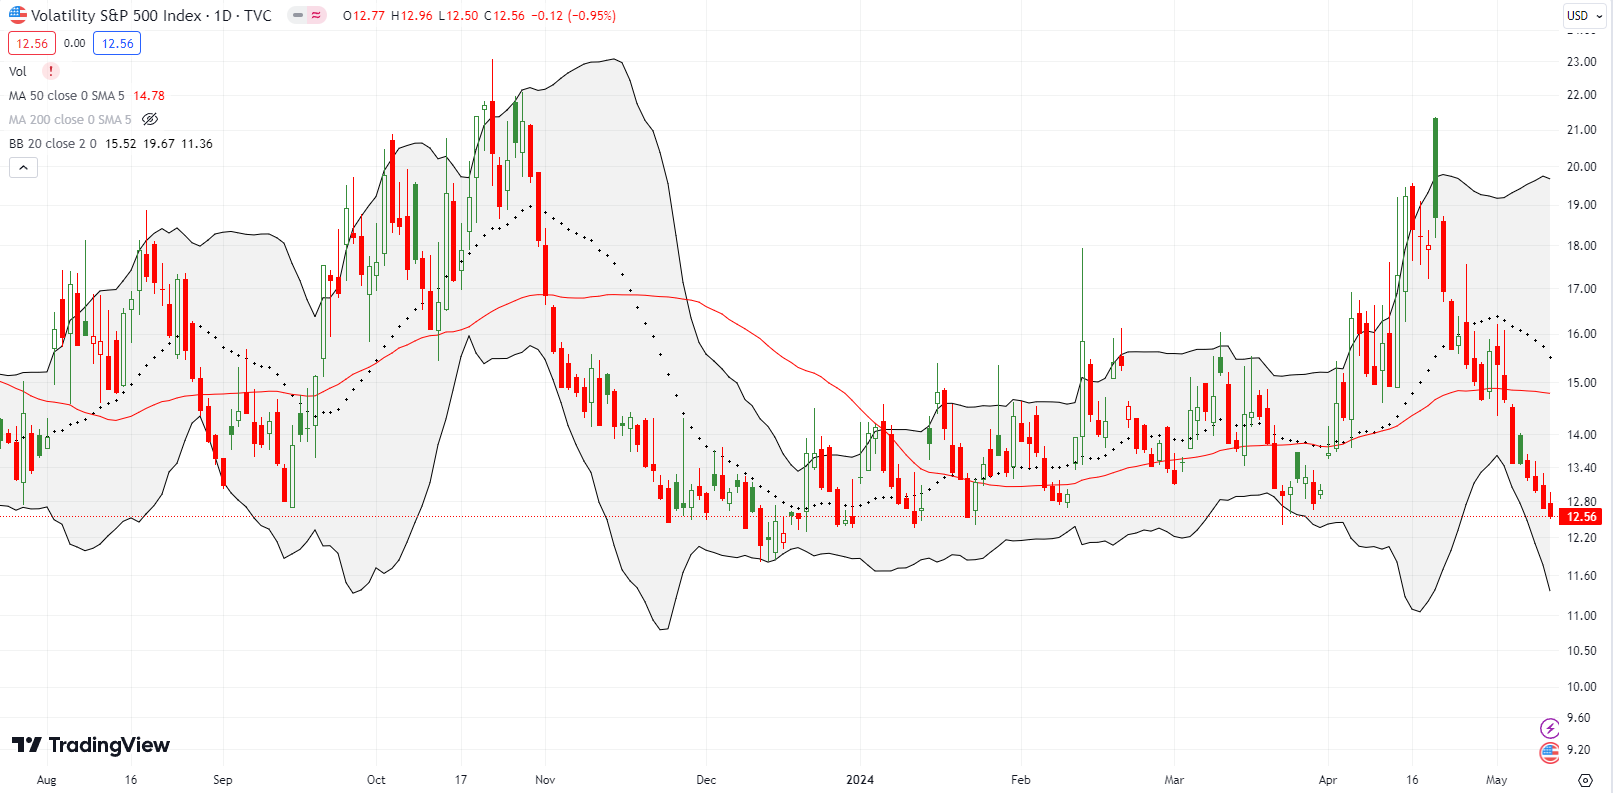
Yet, I need to brace for flipping bearish because the volatility index (VIX) is scraping at its lows for the year. Of course, since these lows have held for the year, the odds favor a sudden jump which would accommodate selling in stocks. The upcoming CPI report for April could very well provide that catalyst. If the VIX pushes further lower, I will have to dust off my bullish trading model for extremely low volatility.
Social media app Snap Inc (SNAP) has an extremely volatile stock. Investors swing from despair to excitement with every earnings report since it fell off overheated pandemic pricing. The typical cycle in the past was post-earnings despair followed by an anticipatory rally into the next earnings. This time around, no rally followed the February post-earnings despair (down 35%); SNAP essentially flatlined and finally looked exhausted. Last month’s earnings sent the stock higher by 28% and buyers continued to celebrate right up to the last high before February earnings (imagine that). Last week’s unenthusiastic trading suggests that it will take another earnings “surprise” to push SNAP over resistance from its 2024 high.
Here is some interesting “price trivia” for SNAP:
- Pre-pandemic high was $19.25
- SNAP collapsed below that line with a 43% plunge on May 24, 2022 with an ugly earnings warning
- The last peak was SNAP’s closest approach since then to its pre-pandemic high
- SNAP’s low over this period was $7.76 in the wake of October, 2022 earnings.
- SNAP came close to testing that low during the October, 2023 lows.
- Ergo, SNAP is trading in a WIDE range!

In February, I featured Fiverr International Ltd (FVRR) in an article describing how price action can expose the truth about a stock. I was not successful in trading FVRR after its 14% post-earnings loss as sellers eventually pushed the faltering stock to new lows. FVRR woke up last week after a 10% post-earnings gain. Buyers followed through with a close further above the upper BB. With FVRR at a new closing high since the February earnings disaster combined with a confirmed 50DMA breakout, the stock looks like a buy after some cooling.
Based on the company’s reiterated guidance nothing seems fundamentally different except for the sentiment of investors and traders: “Our Q2’24 outlook and updated full year 2024 guidance reflects the recent trends on our marketplace and is largely consistent with our prior expectations.” Fiverr also authorized a $100M share buyback.
I also featured Twilio Inc (TWLO) alongside FIVR in the article about the truths from price action. I was partially successful with TWLO after waiting 3 days to buy shares and call options. However, I bought pre-earnings call options that disintegrated after TWLO fell 7.5% post-earnings. In THIS case I got sucked in by believing TWLO’s sell-off was overdone (so much for THAT intuition). I also liked how TWLO avoided new lows going into earnings. TWLO remains on the buy radar given the latest negative post-earnings response only took the stock to the bottom of a trading range. I am just waiting for a fresh close above the 50DMA…
The digital advertising space “lost” one more company. DoubleVerify Holdings, Inc (DV) collapsed last week 38% post-earnings. After two more trading days, DV is still well below its lower BB. DV gave such poor guidance that Bank of America downgraded the stock from buy to underperform with an $18 price target. Thus, DV looks like dead money for now.
I keep reading growing concerns about U.S. consumers and some companies reliant on discretionary spending have suffered damage in their stocks. Even McDonald’s is supposedly working on a new $5 value meal to win back customers. Thus, I was quite surprised to see restaurant software company Toast, Inc (TOST) raise guidance and soar 13% post-earnings. TOST even closed at a 2+ year high; talk about a quiet braeakout.
This breakout makes TOST a buy as long as the post-earnings gains hold. TOST opened for public trading at a lofty $62.32 in September, 2021 right at the tail-end of the pandemic bubble in these kinds of stocks. The IPO priced at $40 after an initial range of $30-$33 that was revised higher to $34-$36. Presumably, these price levels give TOST some good runway for upside for a sustained breakout.
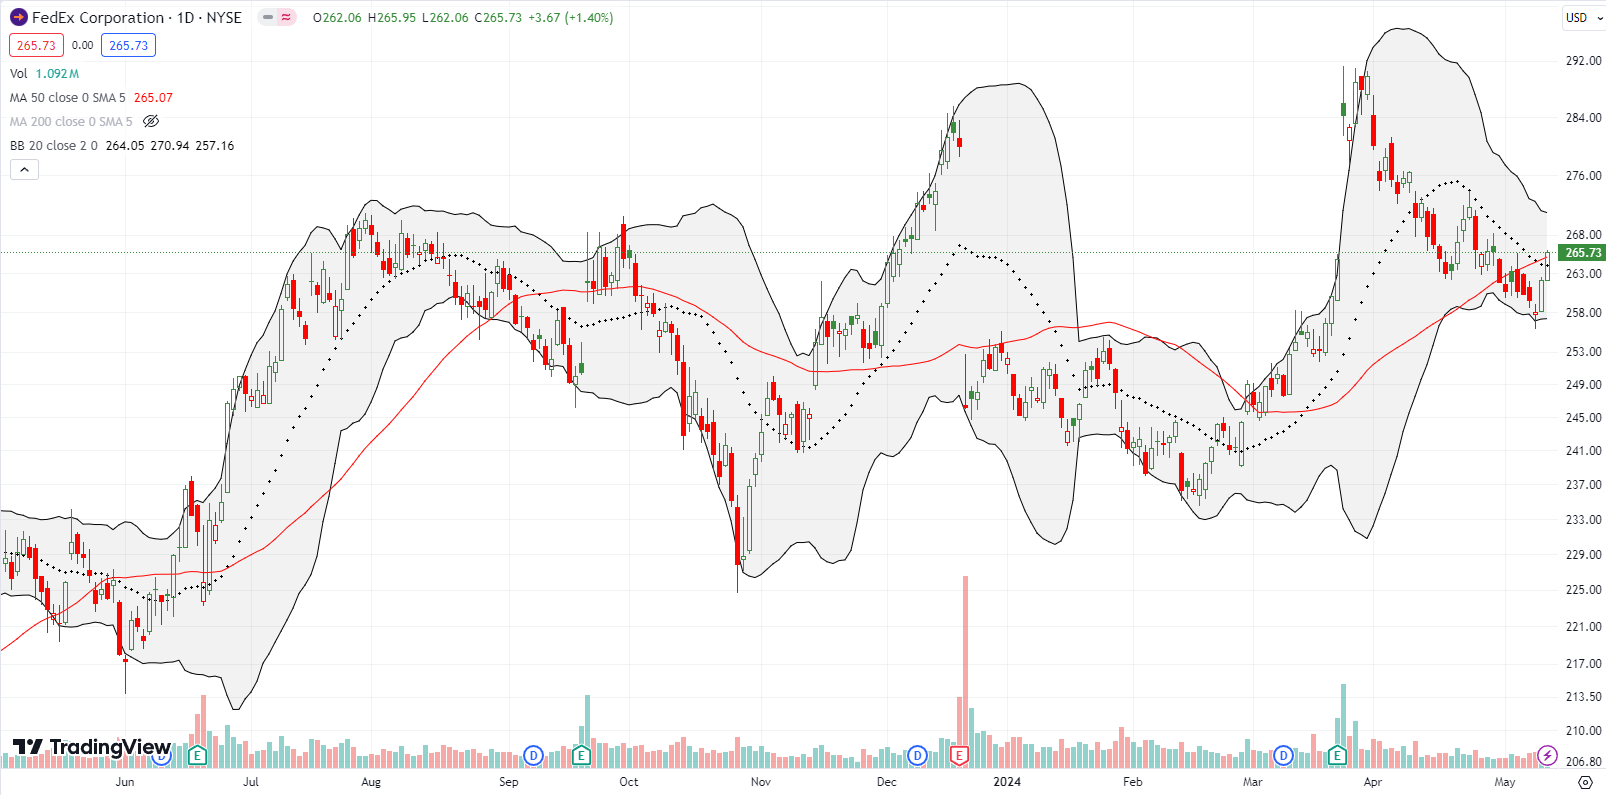
Almost a month ago, I thought the fill in a post-earnings gap offered a buying opportunity in FedEx Corporation (FDX). The bounce lasted just 3 days before sellers took control again. A confirmed 50DMA breakdown created a continuation of April’s sell-off. FDX ended the week on a strong note with two days of buying that finally broke through 20DMA resistance (the dashed line). Another close higher makes FDX a buy candidate again.
A quiet breakout is unfolding with utilities. Since perfectly testing 50DMA support (imagine that), the Utilities Select Sector SPDR Fund (XLU) has gained 15 of the last 18 trading days. Last week in particular, XLU followed closely along its upper BB and almost looks like it is going parabolic.
I stumbled my way into this rally after reading about how natural gas demand will surge in coming years thanks to AI (artificial intelligence). Utility Dominion Energy, Inc (D) looked like the best pick of the lot given the higher dividend and the (presumed) upside potential to get back to all-time highs. Moreover, Dominion recently reported earnings and the stock price held firm. Thus, I should not need to worry about earnings risk for the next 3 months. Welcome to the generative AI trade, Dominion!
I also flipped shares in the United States Natural Gas Fund, LP ETF (UNG) and am waiting for the next dip to buy. (It is impossible to hold UNG for long – UNG traded over $8000/share at its peak in 2008!).

Be careful out there!
Footnotes
Subscribe for free to get email notifications of future posts!
“Above the 50” (AT50) uses the percentage of stocks trading above their respective 50-day moving averages (DMAs) to measure breadth in the stock market. Breadth defines the distribution of participation in a rally or sell-off. As a result, AT50 identifies extremes in market sentiment that are likely to reverse. Above the 50 is my alternative name for “MMFI” which is a symbol TradingView.com and other chart vendors use for this breadth indicator. Learn more about AT50 on my Market Breadth Resource Page. AT200, or MMTH, measures the percentage of stocks trading above their respective 200DMAs.
Active AT50 (MMFI) periods: Day #117 over 20%, Day #16 over 30%, Day #7 over 40%, Day #5 over 50% (overperiod), Day #29 under 60% (underperiod), Day #84 under 70%
Source for charts unless otherwise noted: TradingView.com
Full disclosure: long SPY call spread, long QQQ call spread, long IWM call, long D, long MCD put
FOLLOW Dr. Duru’s commentary on financial markets via StockTwits, Twitter, and even Instagram!
*Charting notes: Stock prices are not adjusted for dividends. Candlestick charts use hollow bodies: open candles indicate a close higher than the open, filled candles indicate an open higher than the close.


1 thought on “A Simple, Quiet Breakout for the Stock Market – The Market Breadth”