Stock Market Commentary
Last week delivered the magic of all-time highs. Another all-time high for the S&P 500 and the NASDAQ’s entry into the all-time high club provided a benign feel to the stock market. Financial markets even look like a safe haven from all the turmoil and trouble in the world. Investors and traders apparently are wearing long-term hats and looking through and beyond today’s worries. The market’s last major worry over a hot inflation report now seems distant and even quaint. The magic of artificial intelligence (AI) and cryptocurrency have (understandably) captured imaginations. This wizardry appears sufficient to keep the animal spirits alive and well in just enough sectors to keep the major indices flying higher.
The Stock Market Indices
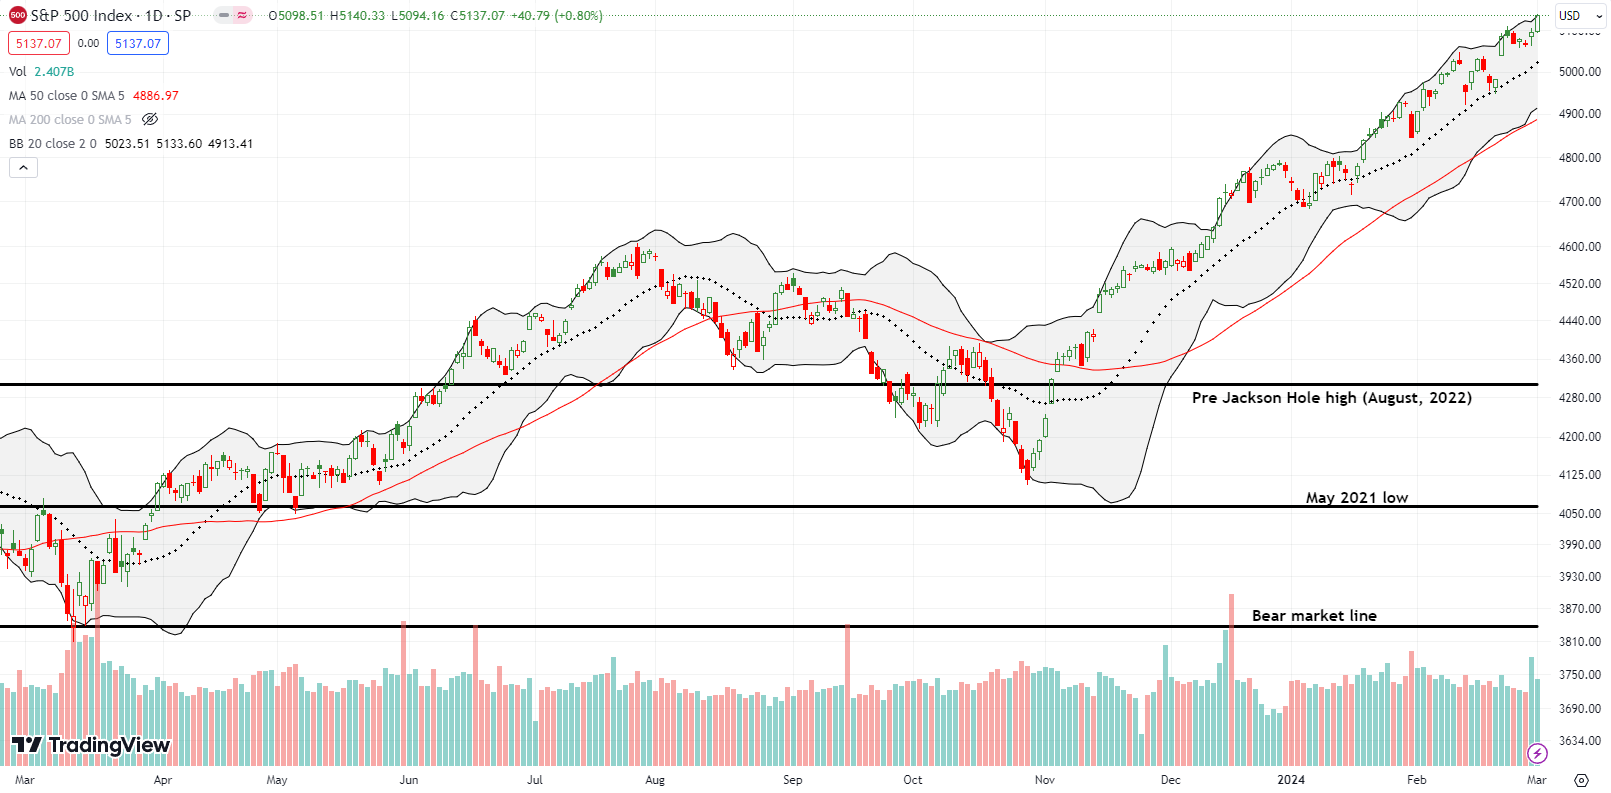
The S&P 500 (SPY) broke out to a new all-time with a 0.8% gain. Buyers remained resilient and refused to allow the index to drift back toward support at the uptrending 20-day moving average (DMA) (the dotted line). The magic of this all-time high gives this drift a serene and benign feeling.
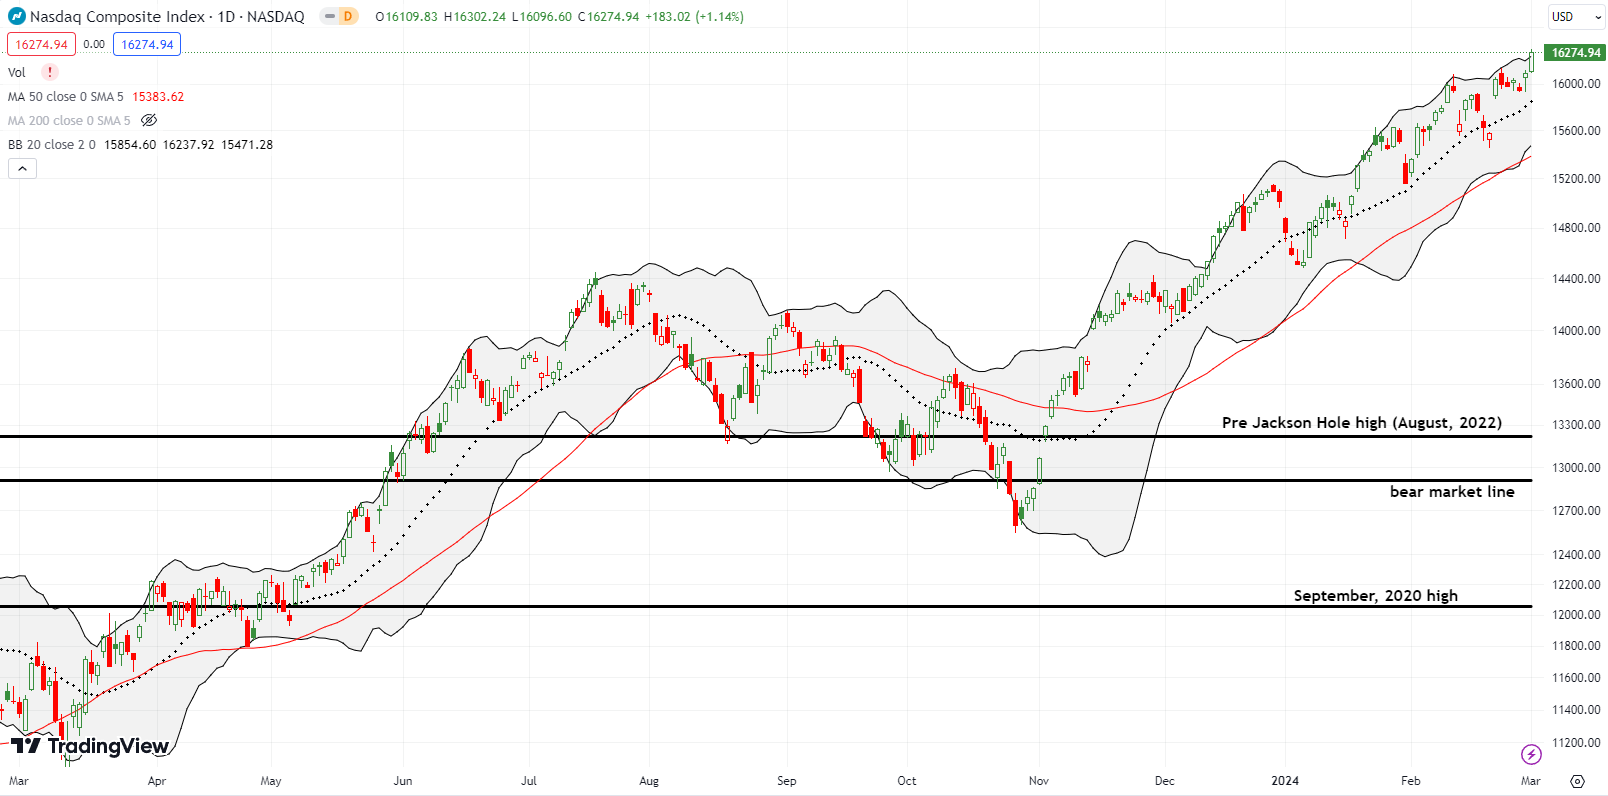
The NASDAQ (COMPQ) finally notched an all-time high after over two weeks of teasing since its last topping pattern. Like the S&P 500, the tech-laden index tapped its upper Bollinger Band (BB). However, I cannot quite call the move over-stretched. Even recent history shows that the index is able to “tap” the upper BB and keep on tapping. Moreover, the NASDAQ is pushing higher even as Apple (AAPL) continues to languish. America’s (former?) favorite stock closed the week at a 4-month low.
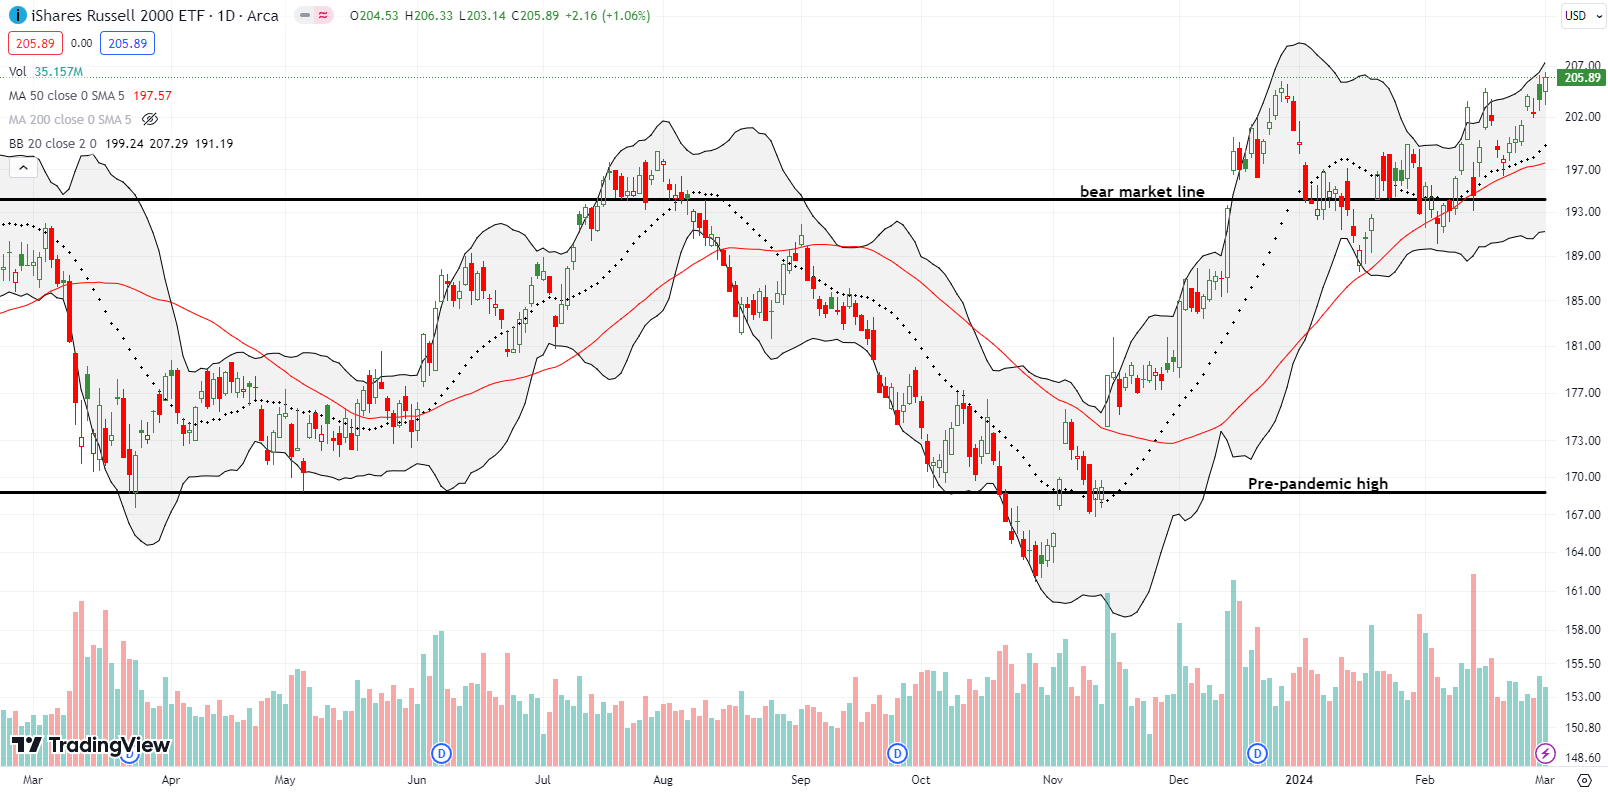
The magic of all-time highs seemed to help push the iShares Russell 2000 ETF (IWM) into a fresh breakout. The ETF of small caps has churned a lot this year but now it finally looks like it has an upward bias. The 20DMA and 50DMA (the red line) are trending upward and the bear market line is finally receding in the rear view mirror. I prematurely took profits on my last IWM call spread after a stall on Wednesday gave the appearance of a potential fail at resistance. Now IWM joins the S&P 500 and the NASDAQ with definitively bullish technicals.
The Short-Term Trading Call With the Magic of All-Time Highs
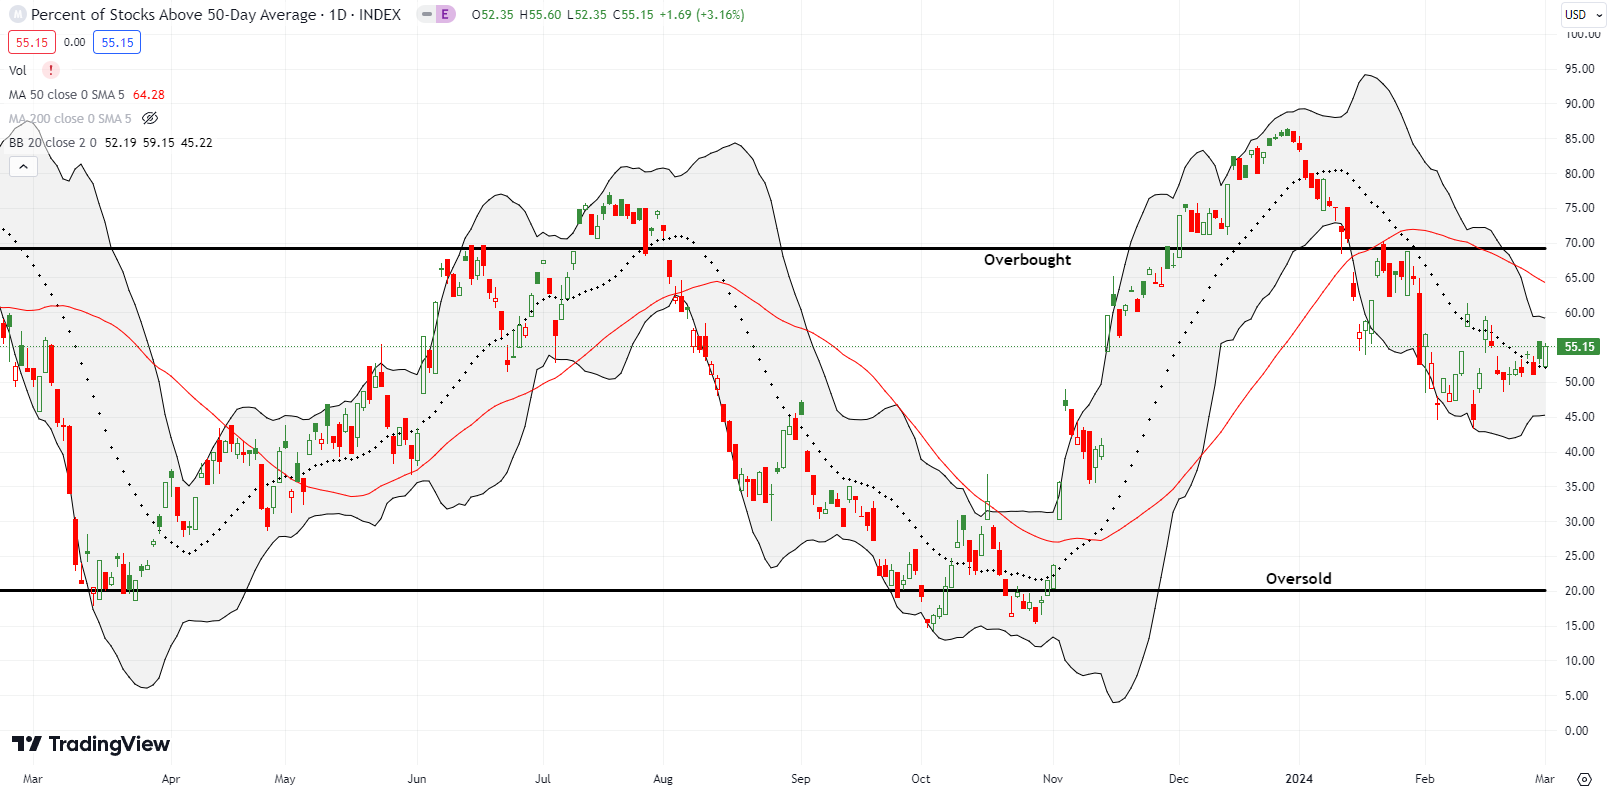
- AT50 (MMFI) = 55.2% of stocks are trading above their respective 50-day moving averages
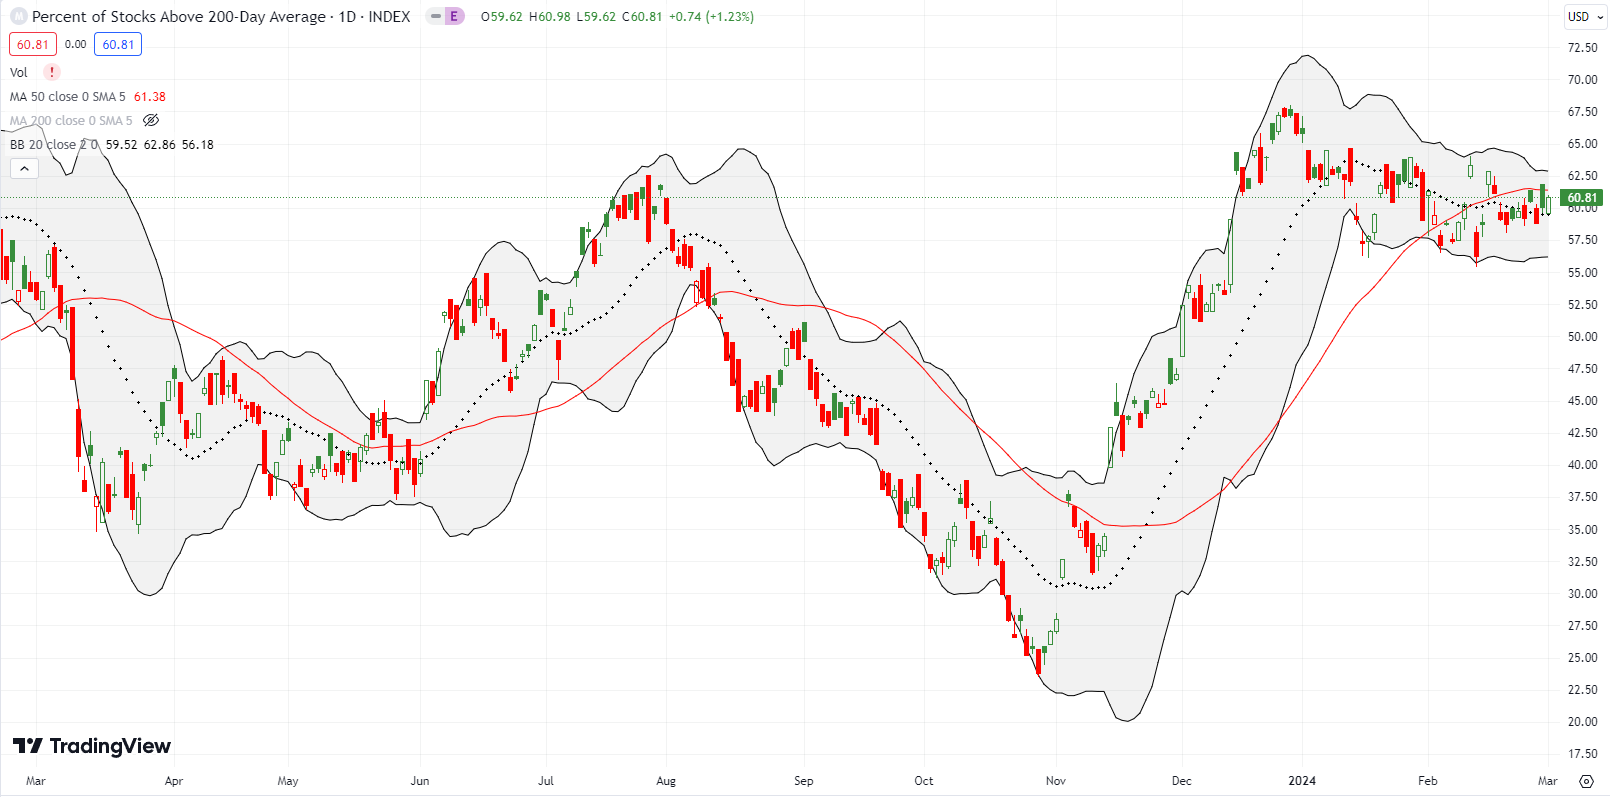
- AT200 (MMTH) = 60.8% of stocks are trading above their respective 200-day moving averages
- Short-term Trading Call: skeptical
AT50 (MMFI), the percentage of stocks trading above their respective 50DMAs, closed at 55.2%. The magic of all-time highs has yet to rub pixie dust on my favorite technical indicator. AT50 closed exactly where it closed two weeks ago. At least AT50 looks like it is finally stabilizing and bringing its downtrend to an end. Accordingly, it looks like my short-term trading call will stay stuck on skeptical for quite some time. As a reminder, I created the “skeptical” trading call as a more functional way to navigate the bullish and bearish truths in the market. I have not yet incorporated this trading call in my official AT50 trading rules. Think of my skepticism as a reluctant deference to bullish overtones combined with a wary eye for the bearish undertones.
The magic of all-time highs has produced some amazing stock charts. Yet, there are still plenty of bearish stories roiling under the surface that are catching unsuspecting investors off-guard.
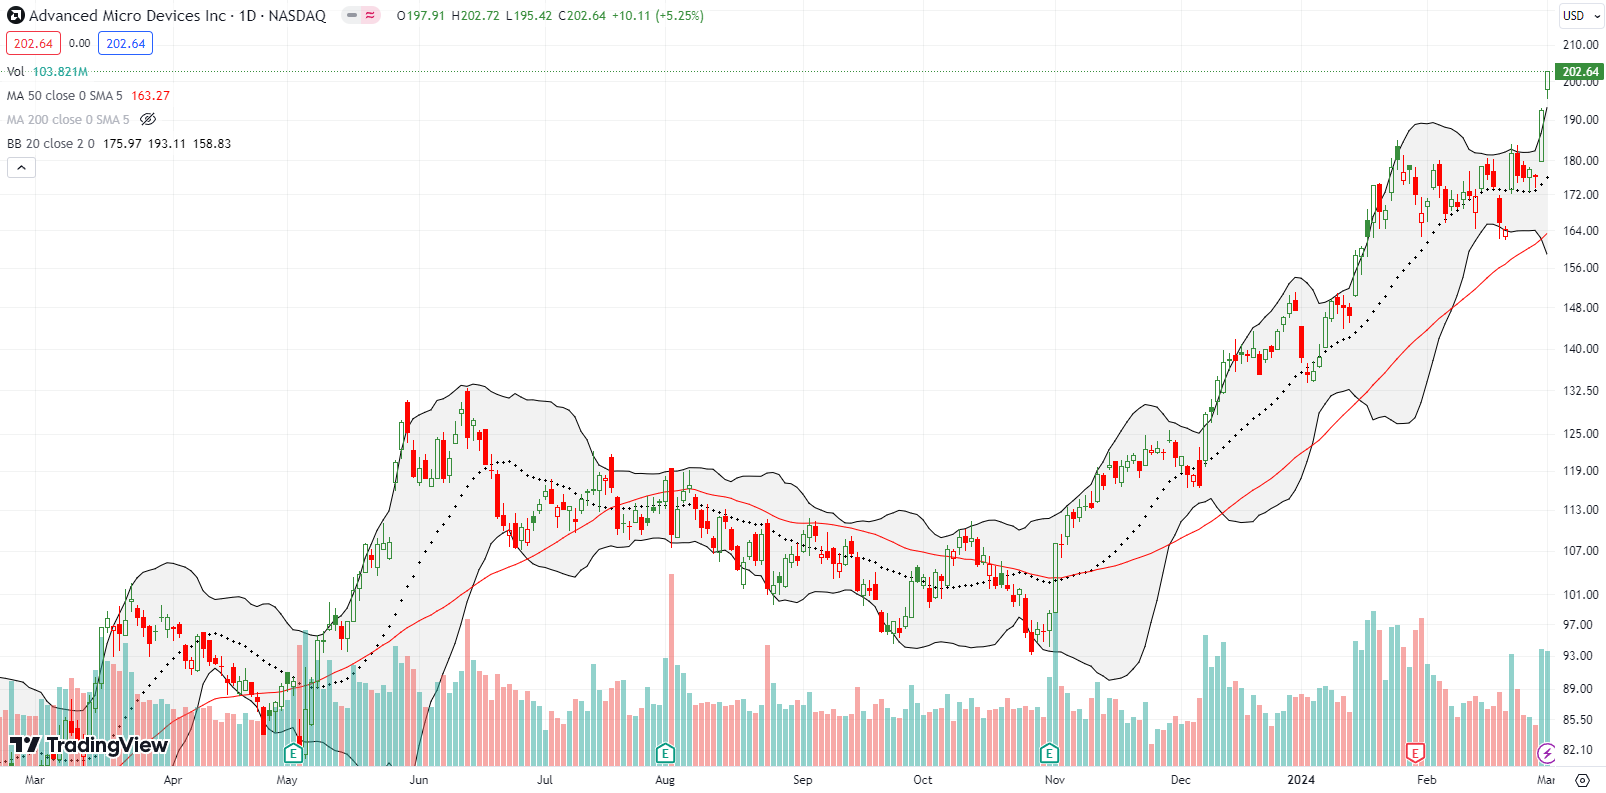
I am unapologetically bullish on the generative AI trades in the stock market. Advanced Micro Devices (AMD) delivered bigtime last week. I was positioned in two call spreads, one a $180 calendar call spread and a $185/$190 call spread. Neither were bullish enough, and I even bailed on the call spread too early. Now AMD stretches well above its upper BB. I eagerly await the next dip…
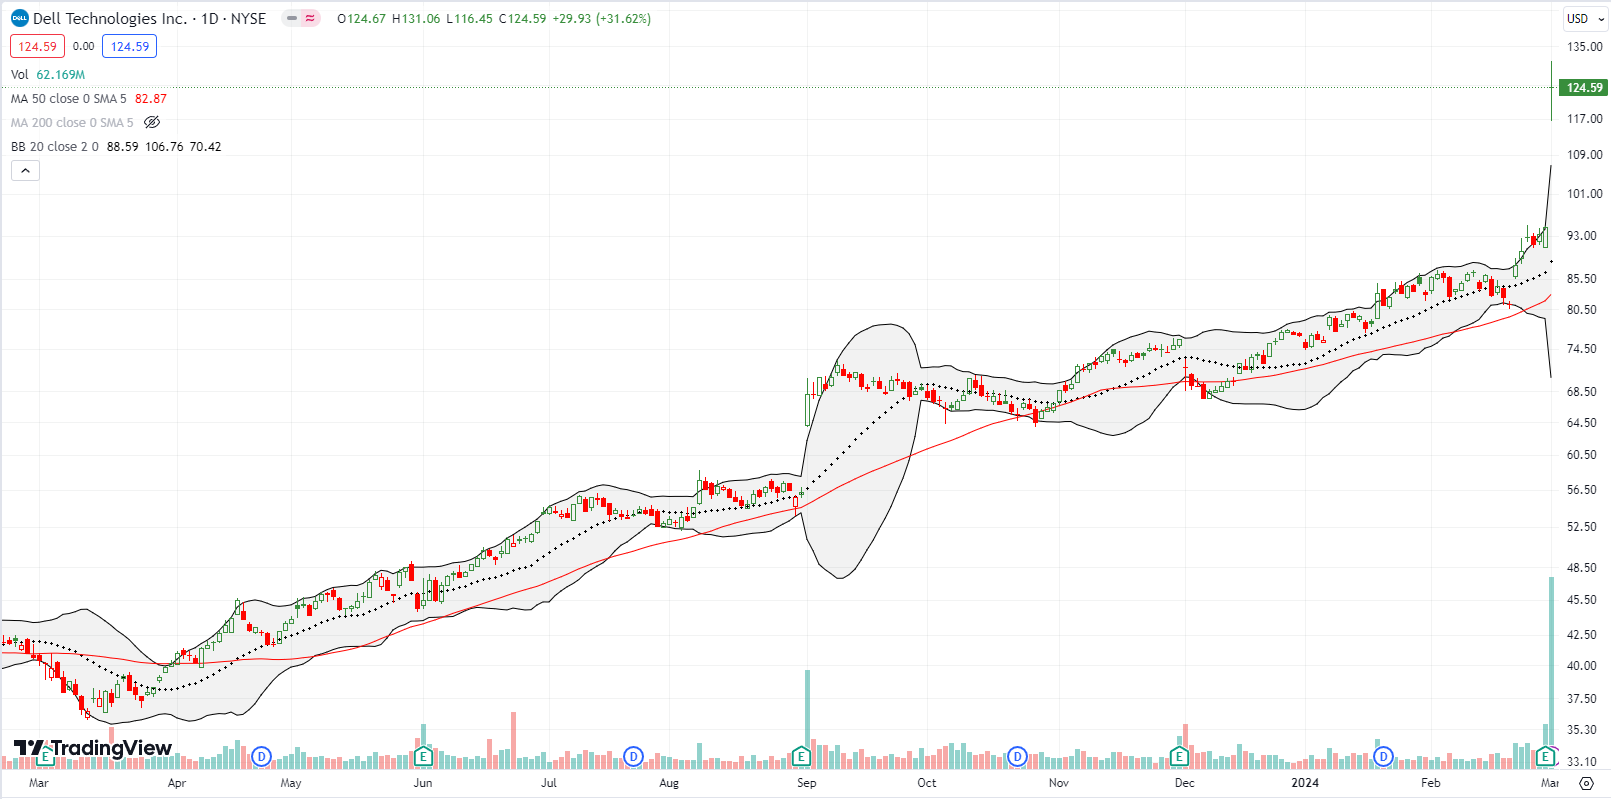
Suddenly I have to include computer hardware manufacturer Dell Technologies Inc (DELL) in my generative AI basket! I have habitually ignored DELL since the dotcom bust of 2000. As a result, I completely missed one of the most obviously bullish uptrends in today’s market! DELL hit a new all-time high after exploding higher by 36% post-earnings. The stock is now up an incredible 5x since returning to the public market 5 years ago. From the Seeking Alpha transcript of the earnings conference call (emphasis mine):
“We have positioned ourselves well in AI. We’ve already started to benefit from the momentum we’re seeing. We saw strong demand continue for our AI-optimized server portfolio, including our flagship PowerEdge XE9680, which remains the fastest-ramping solution in company history. We have just started to touch the AI opportunities ahead of us, including broader adoption of AI by enterprise customers and the projected growth in unstructured data where we are well-positioned with industry-leading storage solutions. We believe the long-term AI action is on-prem where customers can keep their data and intellectual property safe and secure. PCs will become even more essential as most day-to-day work with AI will be done on the PC. We remain excited about the long-term opportunity in our CSG business. Look for us to make a number of new product and solution announcements at Dell Technology World in May that will help customers get started with AI and make it easy.”
Dell’s claim that AI solutions will motivate companies to keep data on-premise instead of the cloud really got my attention! If Dell is correct, then there are some cloud companies who will see growth slowdowns in coming years as AI applications rapidly grow. I will be looking for counter-claims from the cloud companies.
Finally, listening to Ben Reitzes from Melius Research gush about DELL on CNBC’s Fast Money highlighted for me the extent of my oversight regarding the DELL story. Note even with Friday’s surge, DELL is still only valued at 1.0 times sales!
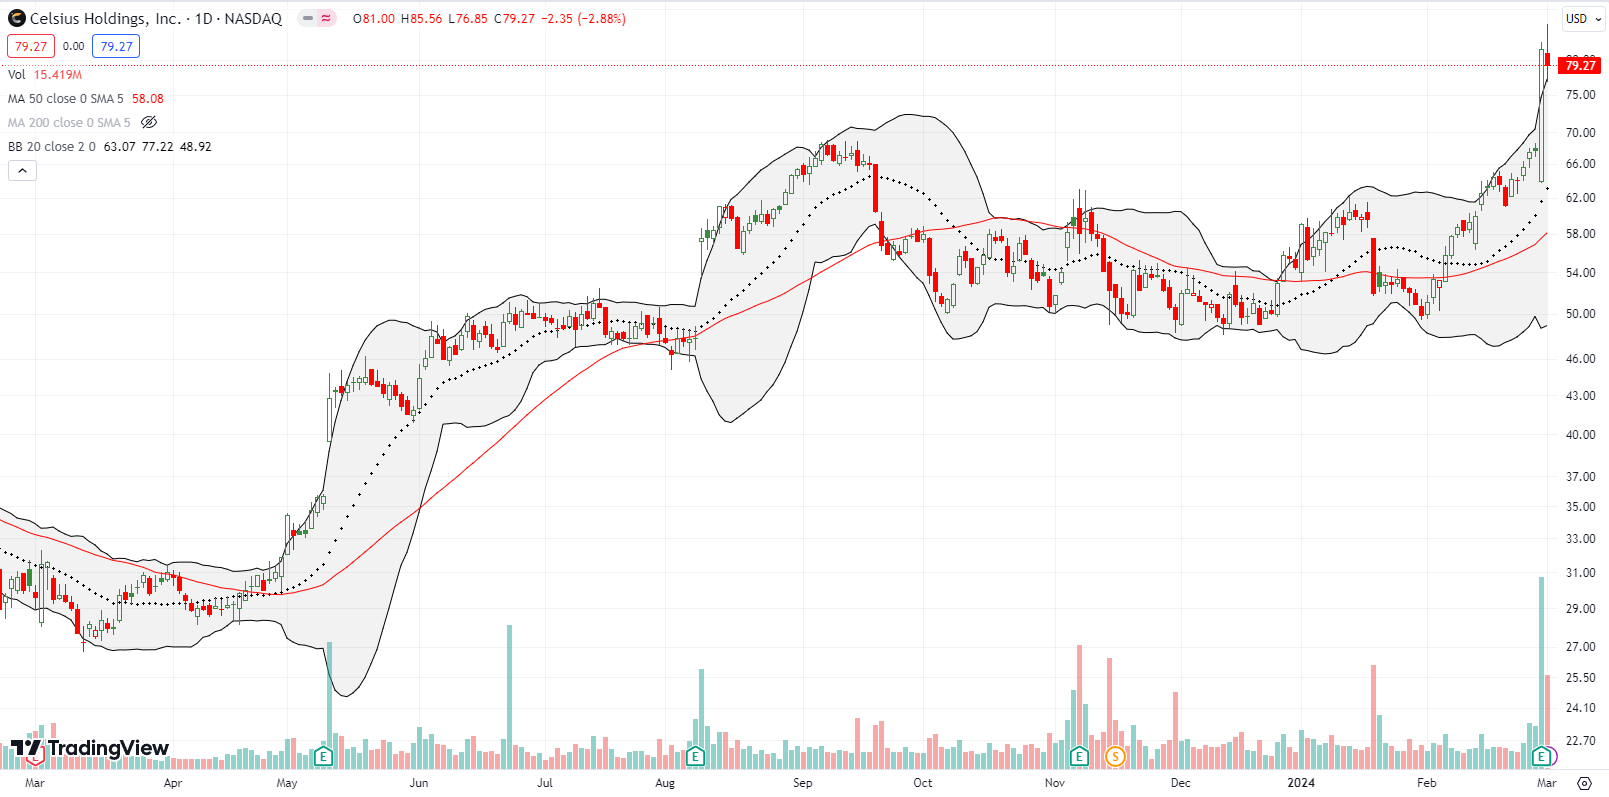
Celsius Holdings, Inc (CELH) broke out to its own all-time high after a post-earnings gap down. The energy drink maker finished the day with a 20% post-earnings gain. I have played cat and mouse with CELH over the years. The stock’s persistence continues to amaze and surprise me. There are plenty of bears similarly caught off-guard given the 16% short interest. Friday’s intraday fade sets up the prospect for a buy the dip opportunity in coming days.
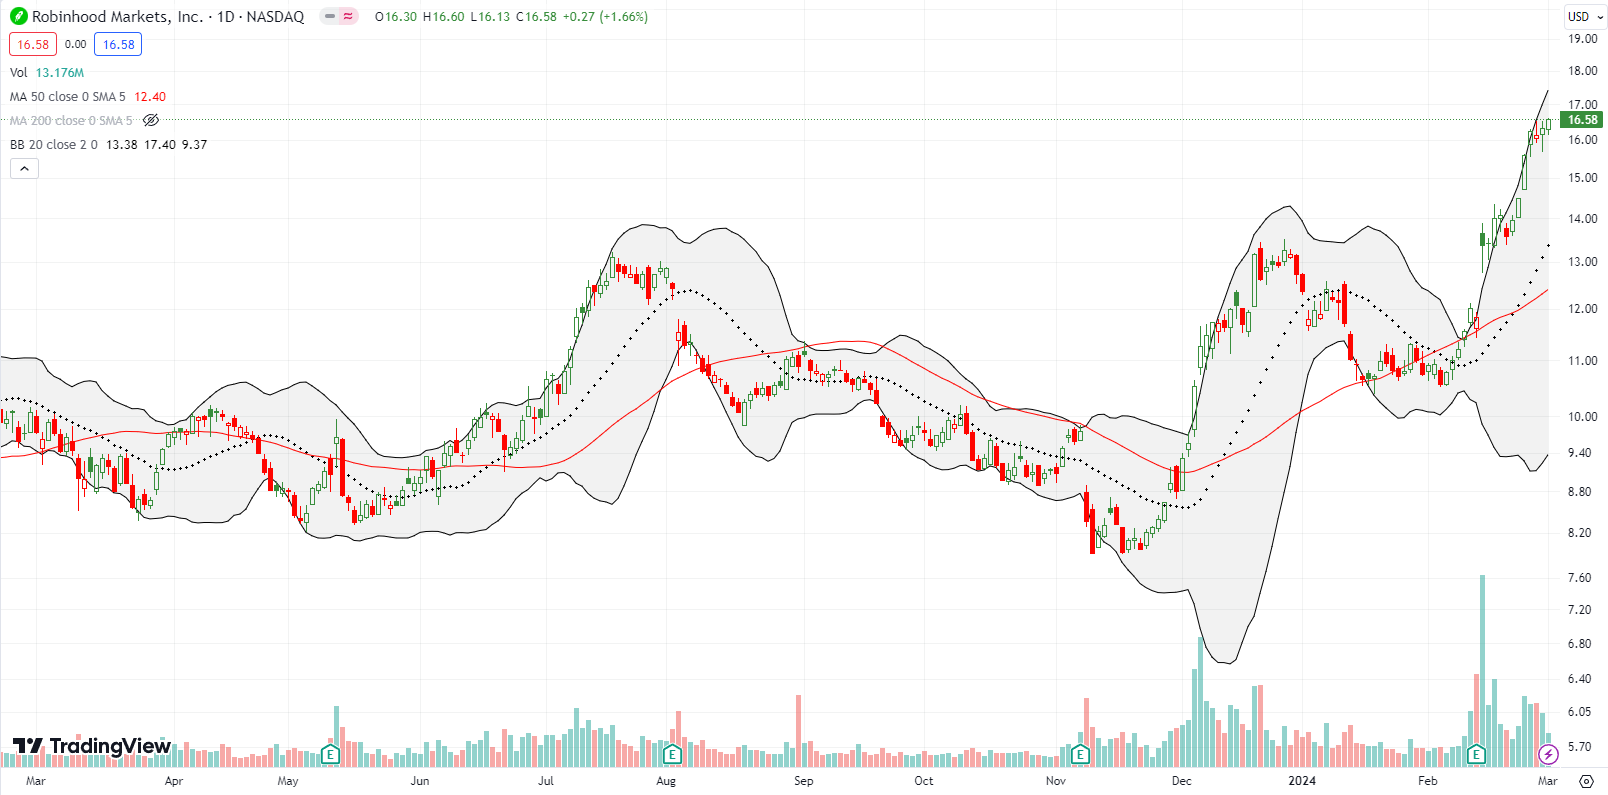
I made the case for trading app Robinhood Markets, Inc (HOOD) in late January while I was in the throes of bearishness. HOOD delivered a sliver of profit before failing at 20DMA resistance and then falling under its 50DMA. I left the stock alone from there and waited for earnings.
HOOD delivered a confirming 13.0% post-earnings gain. Still, I was slow to jump aboard and finally decided to chase a bit last week with a call spread. While breaking out to a 3-year high, HOOD remains about 20% of its former self right after its heralded IPO in 2021. I think of HOOD as a much better priced option than Coinbase (COIN) for trading on the market’s speculative fury, especially with Bitcoin (BTC/USD) and cryptocurrency in general.
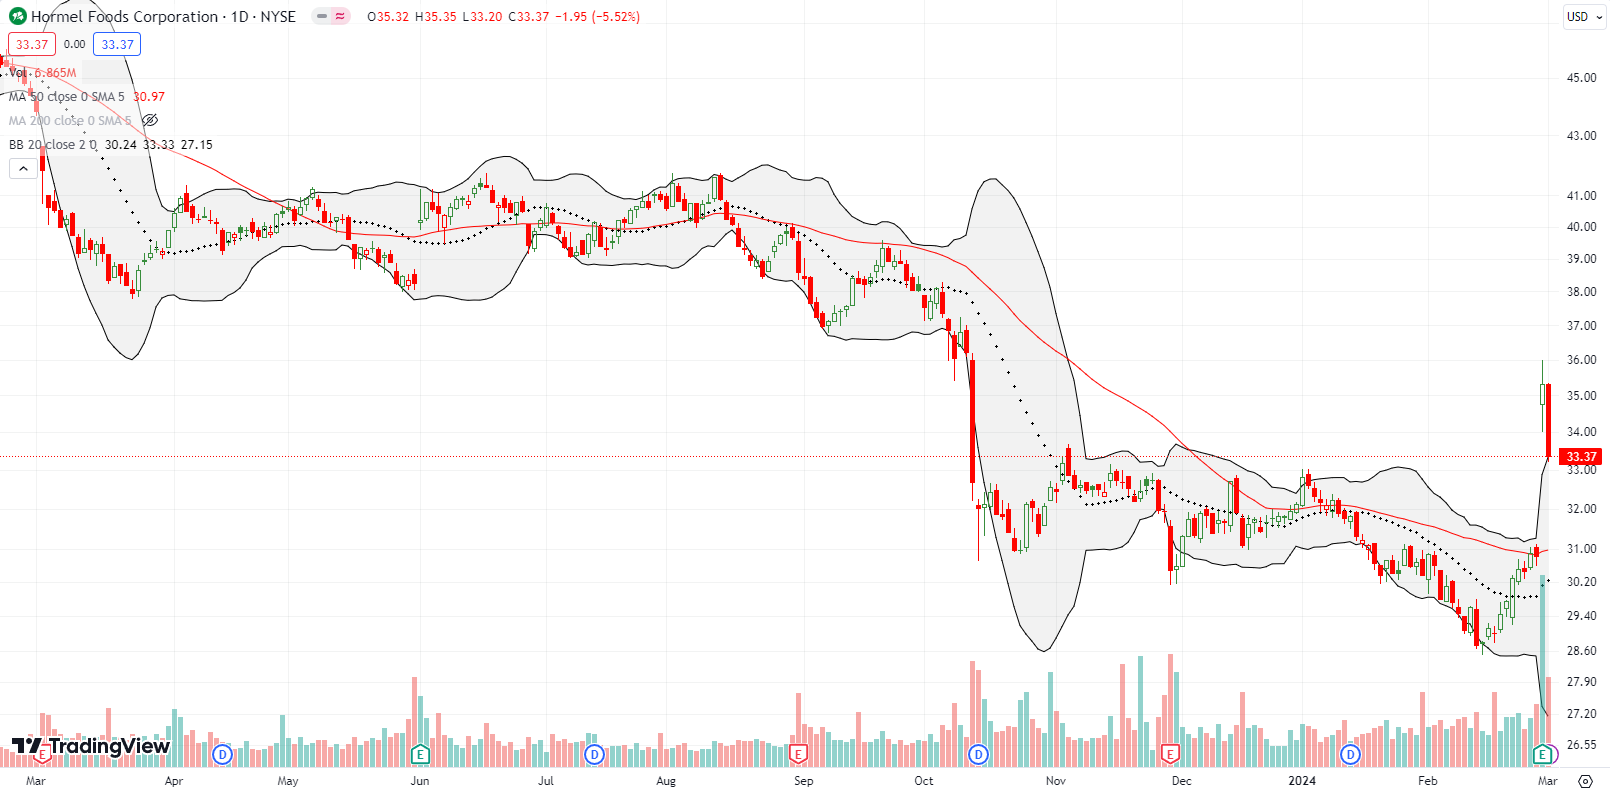
When I made the case for Beyond Meat (BYND), I compared the stock’s valuation with Hormel Foods Corporation (HRL). I bought HRL as a dividend-paying, “value play” at the October lows. However, HRL completely failed to participate in the stock market’s lift-off from there. Such are the trials and tribulations of unloved value plays.
Last week, HRL seemed to take a cue from BYND. HRL surged 14.6% post-earnings on Thursday. Given the stock was well above its upper BB and given such surges are quite unusual for otherwise placid HRL, I took profits. Sellers dutifully took HRL back to its upper BB on Friday, so now I am already preparing to buy HRL right back.
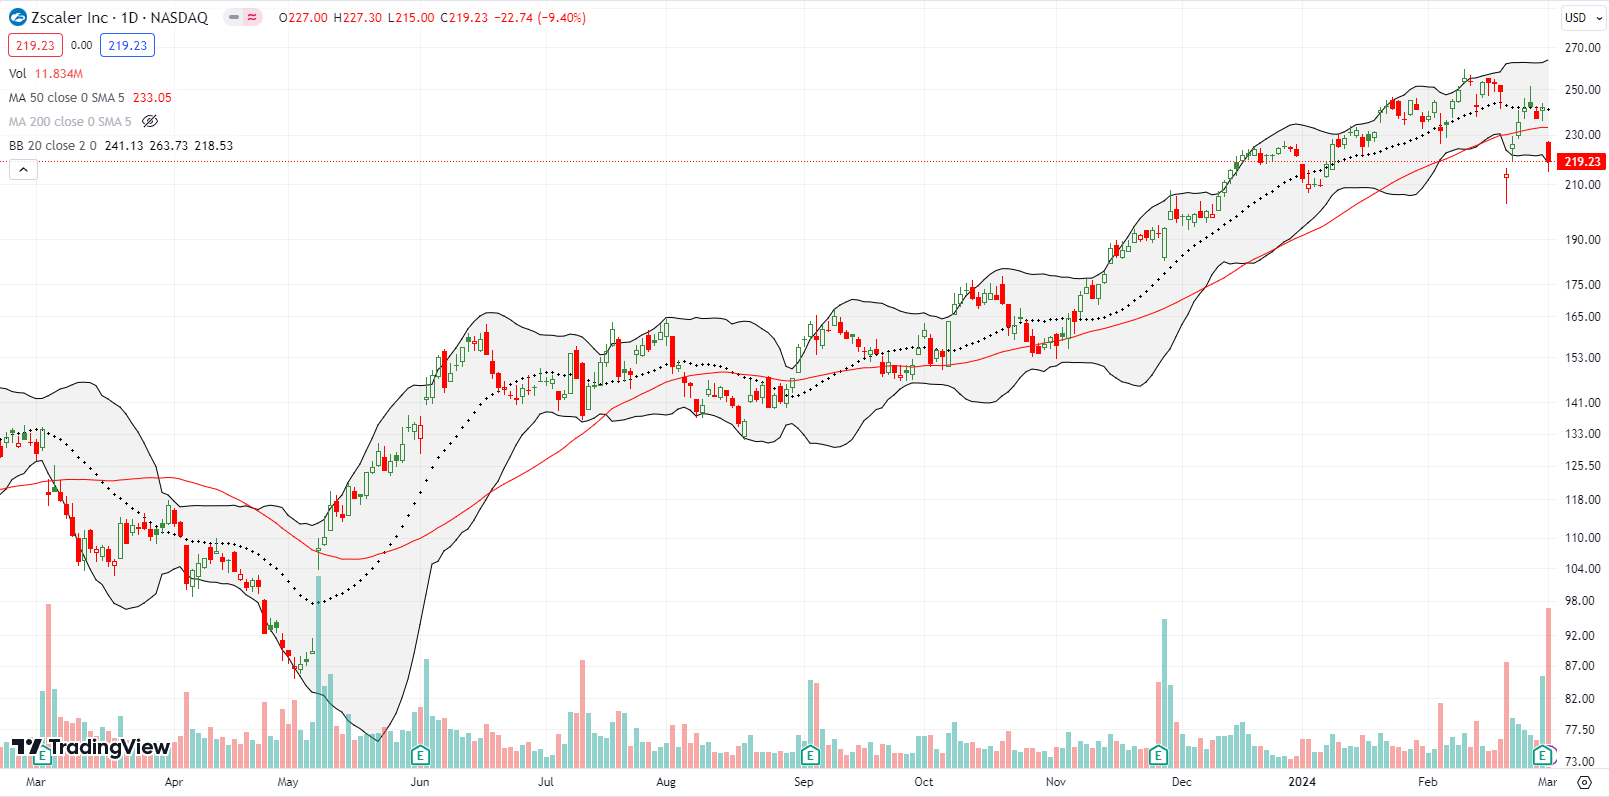
Zscaler Inc (ZS) looked like it was steadily marching toward the magic of an all-time high until earnings from Palo Alto Networks (PANW) knocked the entire cybersecurity complex for a loop. ZS lost 14.1% just for its association, but the stock rebounded intraday to form a bottoming hammer pattern. A gap up the next day confirmed the bottom. Buyers continued until ZS finished reversing the 14.1% loss. An intraday fade from closing the gap was a fresh reversal signal and emboldened me to plant a pre-earnings put spread. ZS lost 9.4% post-earnings and suffered another 50DMA breakdown. I promptly closed the bearish position.
Will buyers step in and defend a bottom again? ZS will look like a buy above its 50DMA. Otherwise, it is in shaky territory.
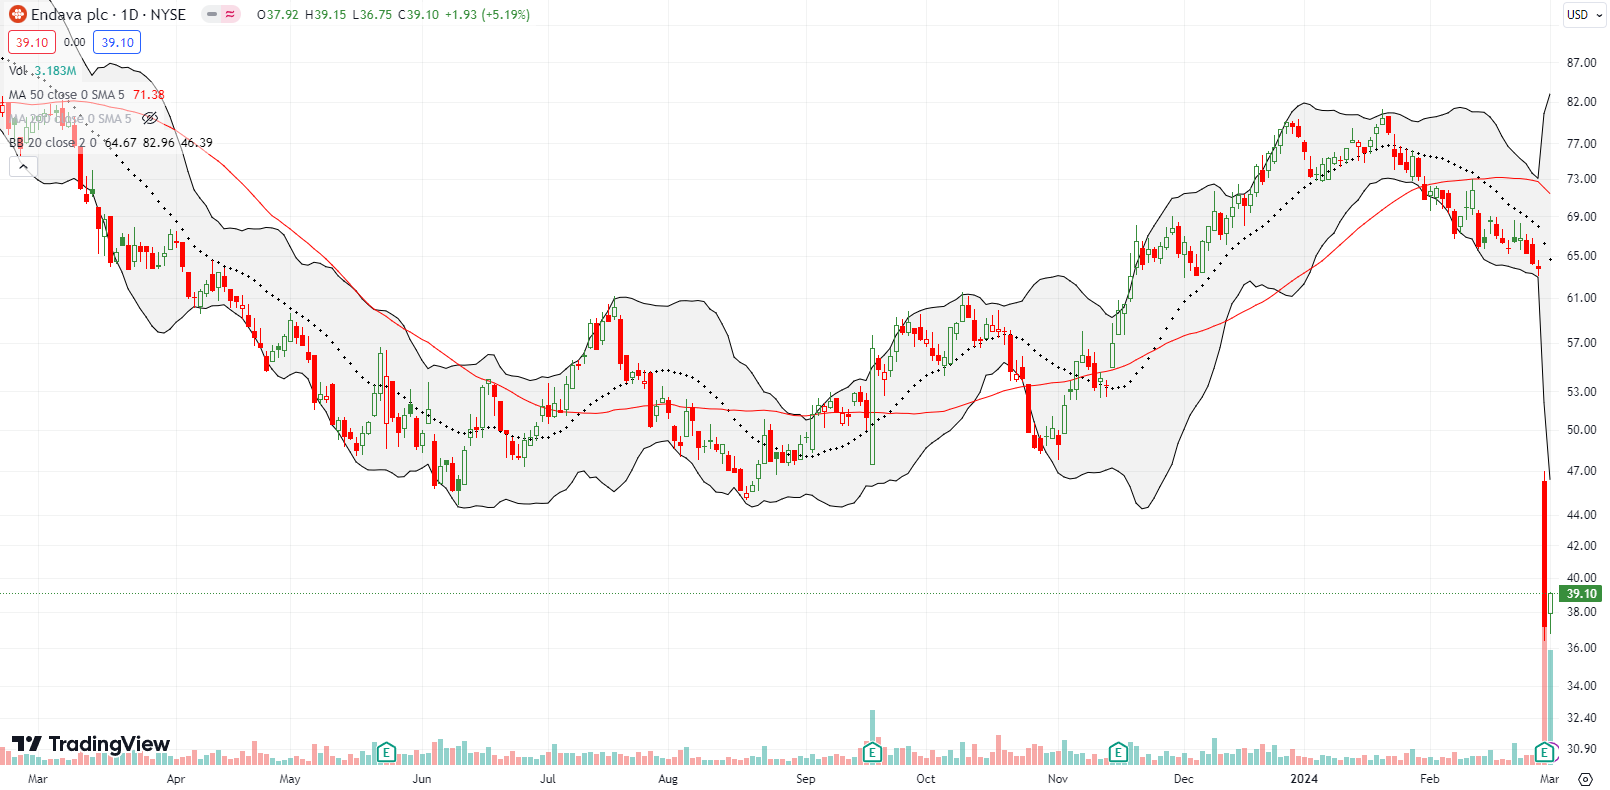
In early January I bought into a bullish setup for Endava plc (DAVA). The trade ended with a small profit after DAVA turned around from a marginal breakout. Subsequently, DAVA got trapped into a downtrend even as the NASDAQ crept higher. A 50DMA breakdown followed by a confirmation of 50DMA resistance delivered the final pre-earnings warnings. DAVA plunged 41% post-earnings and closed near a 4-year low. One of the least bullish analysts on the street downgraded DAVA and capped a potential recovery by slashing its prior $90 price target to $40. Needless to say, I am so relieved I stuck to my discipline on this trade!
This trade experience was yet another lesson for paying attention to the price action.
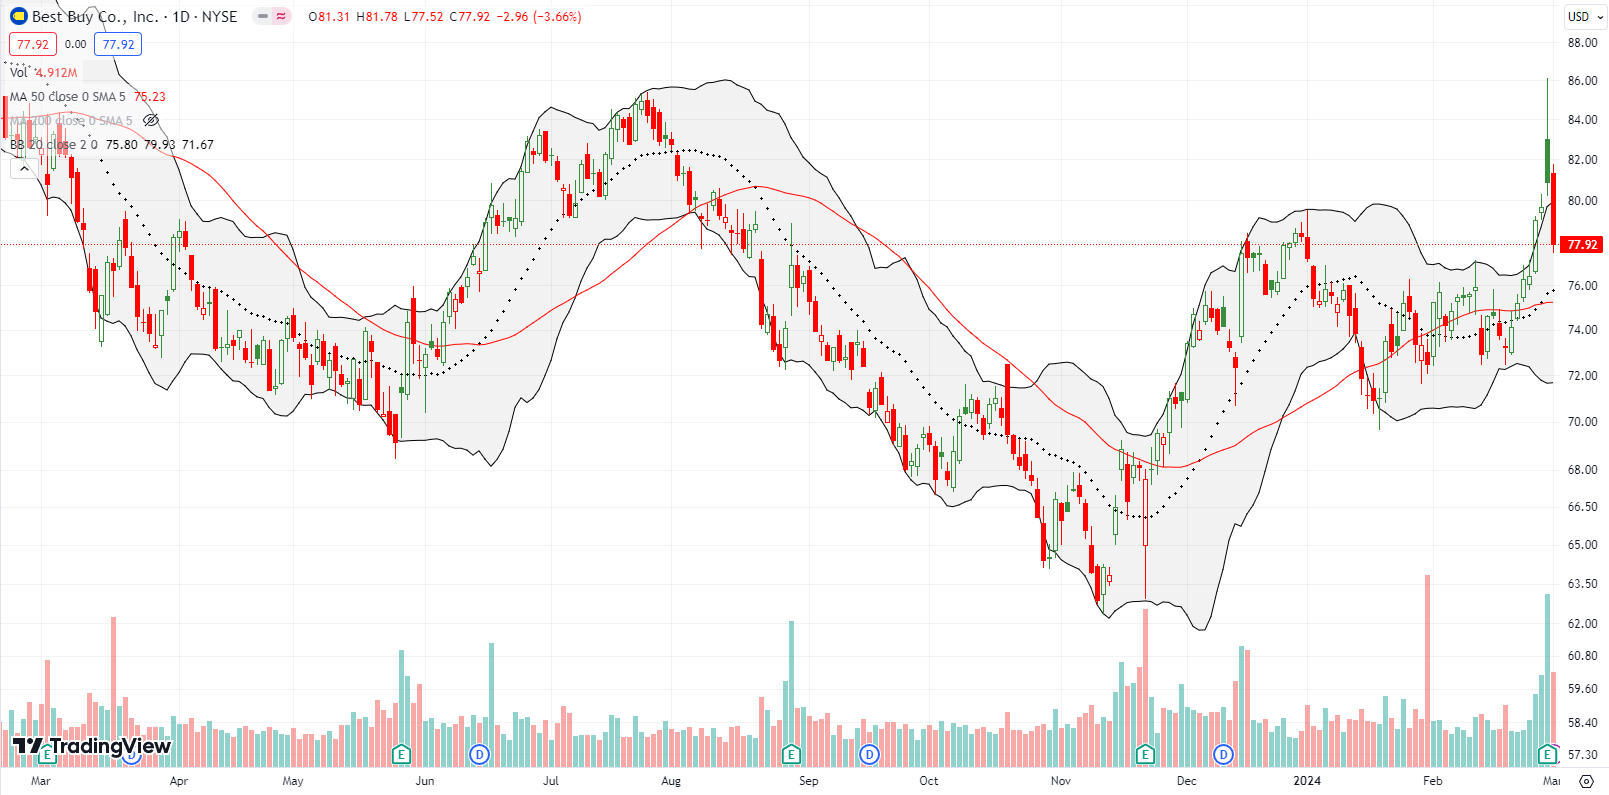
Best Buy Co (BBY) experienced a quick flip from post-earnings magic to post-earnings disappointment. BBY was up as much as 8.1% before sellers took over just as BBY barely surpassed the high from last summer. BBY ended the first post-earnings day with a mere 1.5% gain and sellers took the stock down another 3.7% post-earnings. I have a small long-term position in BBY.
So much for following the breakout in retail stocks! (I took profits on my XRT call spread).
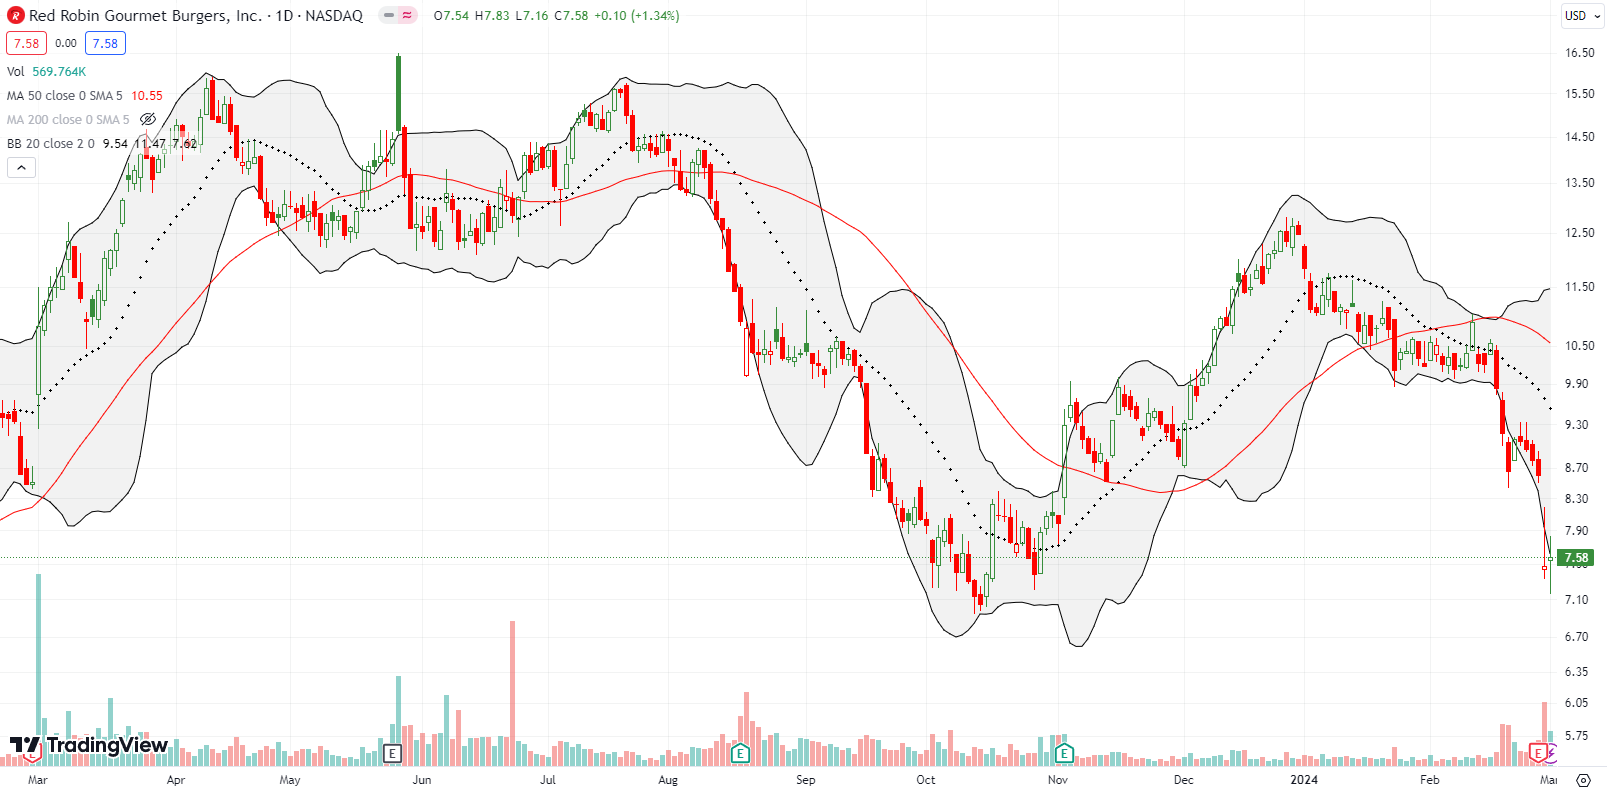
I last wrote about Red Robin Gourmet Burgers, Inc (RRGB) two years ago. Sellers have cut the stock in half since then. In between, I made a bottom-fishing trade on one of my favorite places to get a turkey burger. Last week’s 13.0% post-earnings loss convinced me to give up on this story and sell in the coming days. The warning signs are in the stock as well in the footprint. Slowly but surely, Red Robin Gourmet Burger keeps closing locations near me. Moreover, Red Robin is scrambling for liquidity and executed its third sale-leaseback since 2023.
So much for following the breakout happening in other restaurant stocks! (I am long Brinker International, Inc (EAT) but wary now).
Be careful out there!
Footnotes
Subscribe for free to get email notifications of future posts!
“Above the 50” (AT50) uses the percentage of stocks trading above their respective 50-day moving averages (DMAs) to measure breadth in the stock market. Breadth defines the distribution of participation in a rally or sell-off. As a result, AT50 identifies extremes in market sentiment that are likely to reverse. Above the 50 is my alternative name for “MMFI” which is a symbol TradingView.com and other chart vendors use for this breadth indicator. Learn more about AT50 on my Market Breadth Resource Page. AT200, or MMTH, measures the percentage of stocks trading above their respective 200DMAs.
Active AT50 (MMFI) periods: Day #68 over 20%, Day #66 over 30%, Day #64 over 40%, Day #12 over 50% (overperiod), Day #24 under 60%, Day #35 under 70%
Source for charts unless otherwise noted: TradingView.com
Full disclosure: long HOOD call spread, long BBY, long RRGB, long IWM calls
FOLLOW Dr. Duru’s commentary on financial markets via StockTwits, Twitter, and even Instagram!
*Charting notes: Stock prices are not adjusted for dividends. Candlestick charts use hollow bodies: open candles indicate a close higher than the open, filled candles indicate an open higher than the close.


Thanks for including that quote from Dell. I see the security issues that should make companies build AI models in-house rather than on cloud – even though the costs are massive. As you mentioned, it will be interesting to see how the cloud vendors counter that. One obvious beneficiary is DLR, which builds data centers and connectivity for big companies. Perhaps their stock’s recent rise reflects that.