Stock Market Commentary
Instead of climbing a wall of worry, the market is climbing a wall of frustration (I stole that from a friend of mine). No matter what economic indicators bears stare at to declare impending doom, the jobs market just keeps coming in hot month-after-month. While a widening swath of stocks are breaking down, the big boys that really matter to the S&P 500 and the NASDAQ are delivering sufficient trappings of bullishness. In between, the ARK funds, which are card-carrying members of the speculation squad, are actually falling further and further behind in 2024. Market breadth continues to flag bearish conditions, a concentrated set of bullish charts mock the traditionally bearish technical warnings. This complicated swirl of dynamics creates a sharp contrast between the two truths of the stock market!
In between consequential earnings reports, the Federal Reserve delivered big fireworks for the week. Federal Reserve Chair Jerome Powell stood adamant and resolute in rejecting the financial market’s expectations for rate cuts as soon as March. The resulting disappointment caused a sharp and broad one-day sell-off in the middle of the week. The week closed with the damage intact for market breadth, but the sharp contrast from a few key stocks gave the appearance of a rapid washout of sellers.
The Stock Market Indices
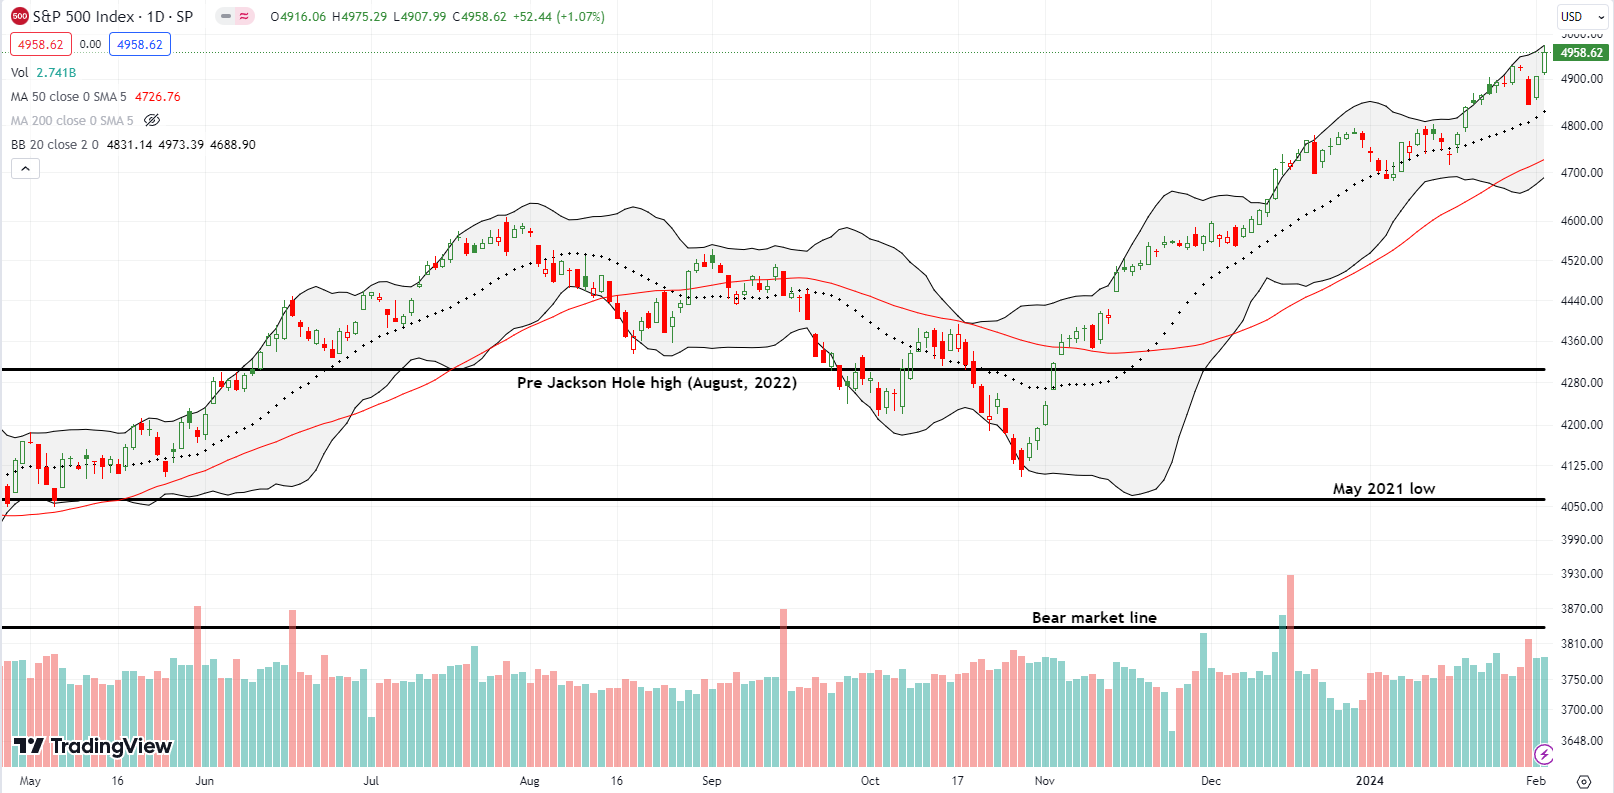
The S&P 500 (SPY) fell 1.6% in the wake of the Fed meeting. Buyers wasted no time in reversing most of the losses the next day. On Friday, the index surged again, this time to a fresh all-time high. Without the uptrending 20-day moving average (DMA) (the dotted line) getting tested as support, I think this rebound is tenuous. However, that is as much of a stretch I can take to get a bearish lesson out of the S&P 500’s trading action! The select big cap tech stocks driving the S&P 500 higher do not currently care much for bearish yellow flags.
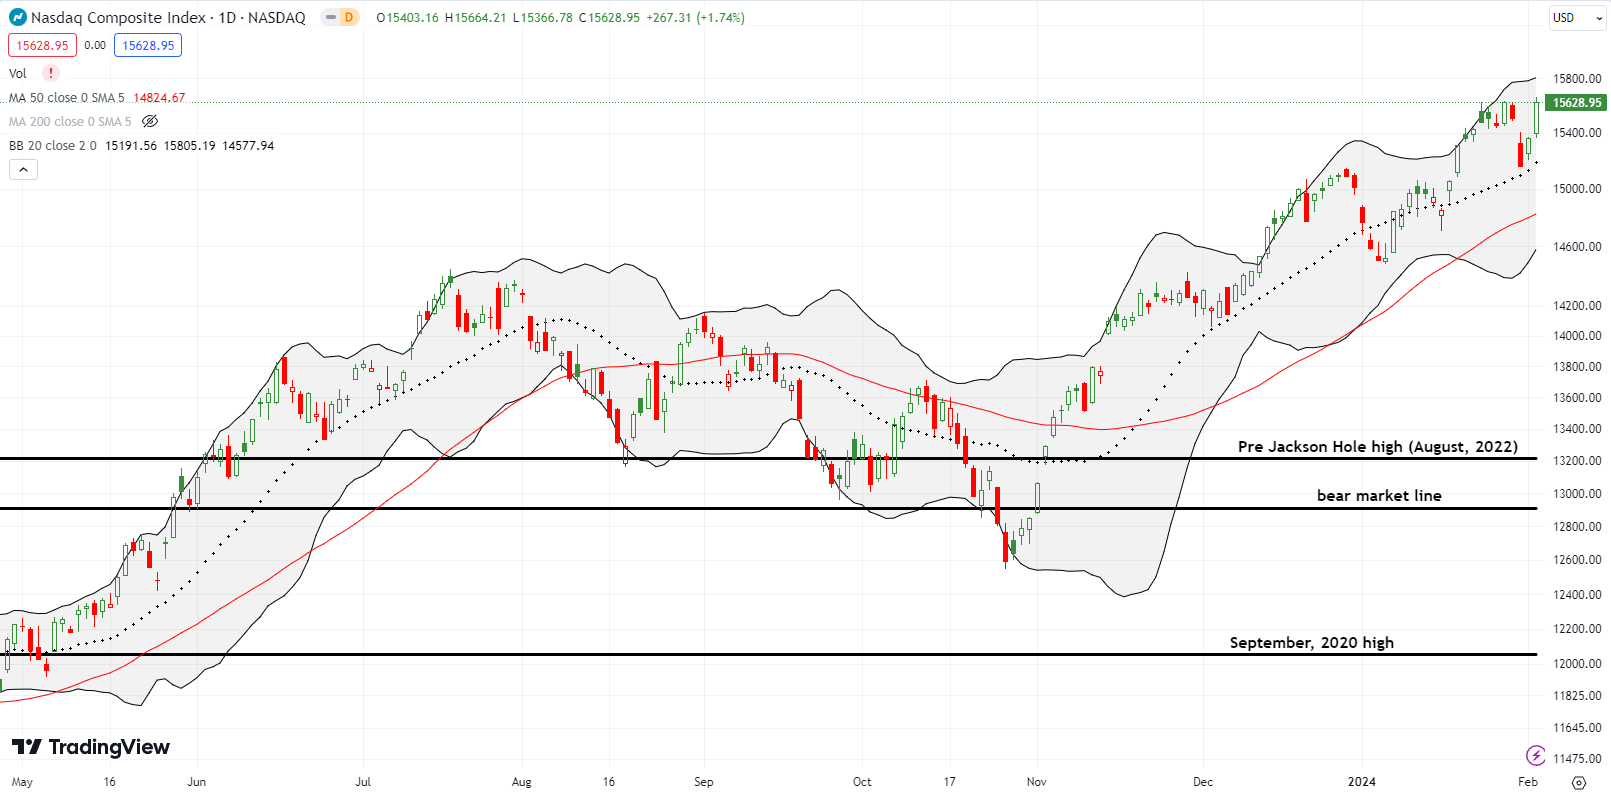
The NASDAQ (COMPQ) almost tested its 20DMA support with a 2.2% loss in the wake of the Fed. The buying rebound took the tech-laden index to a fresh (marginal) 2-year high. Extremely positive earnings responses saved the week for the NASDAQ.
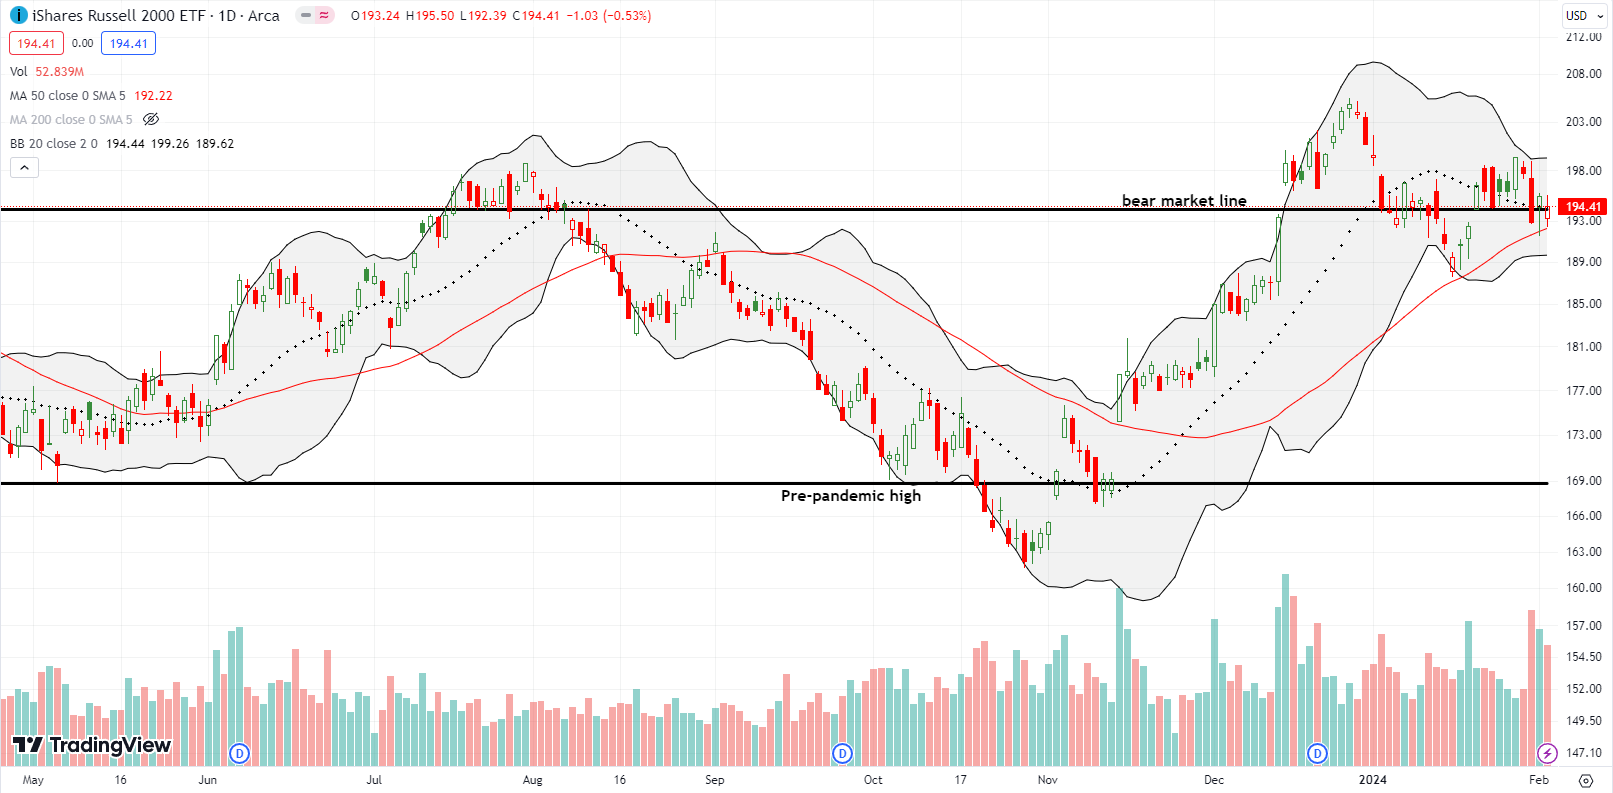
The iShares Russell 2000 ETF (IWM) maintained its role as a deadweight on bullish sentiments. The ETF of small caps closed below its bear market line in the wake of the Fed and ended the week right on top of that line. The uptrending 50DMA (the red line below) provided support against the sellers. My last tranche of put options were slightly off in timing. I refreshed the position on Friday. IWM will return to a bullish position if it manages to break out above the current trading range pivoting around the bear market line.
The Short-Term Trading Call With A Sharp Contrast
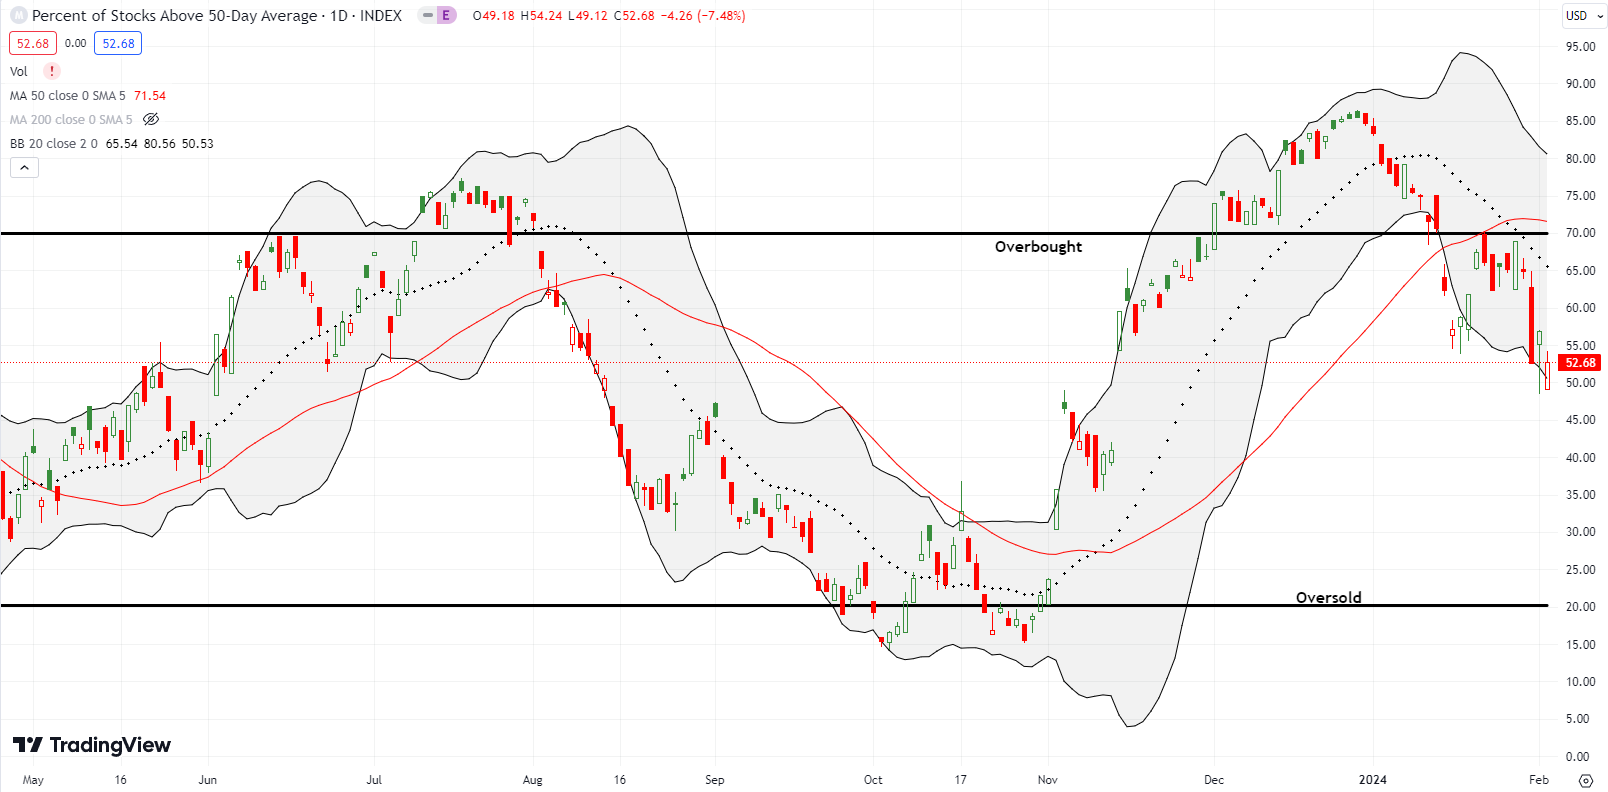
- AT50 (MMFI) = 52.7% of stocks are trading above their respective 50-day moving averages (29th overbought day)
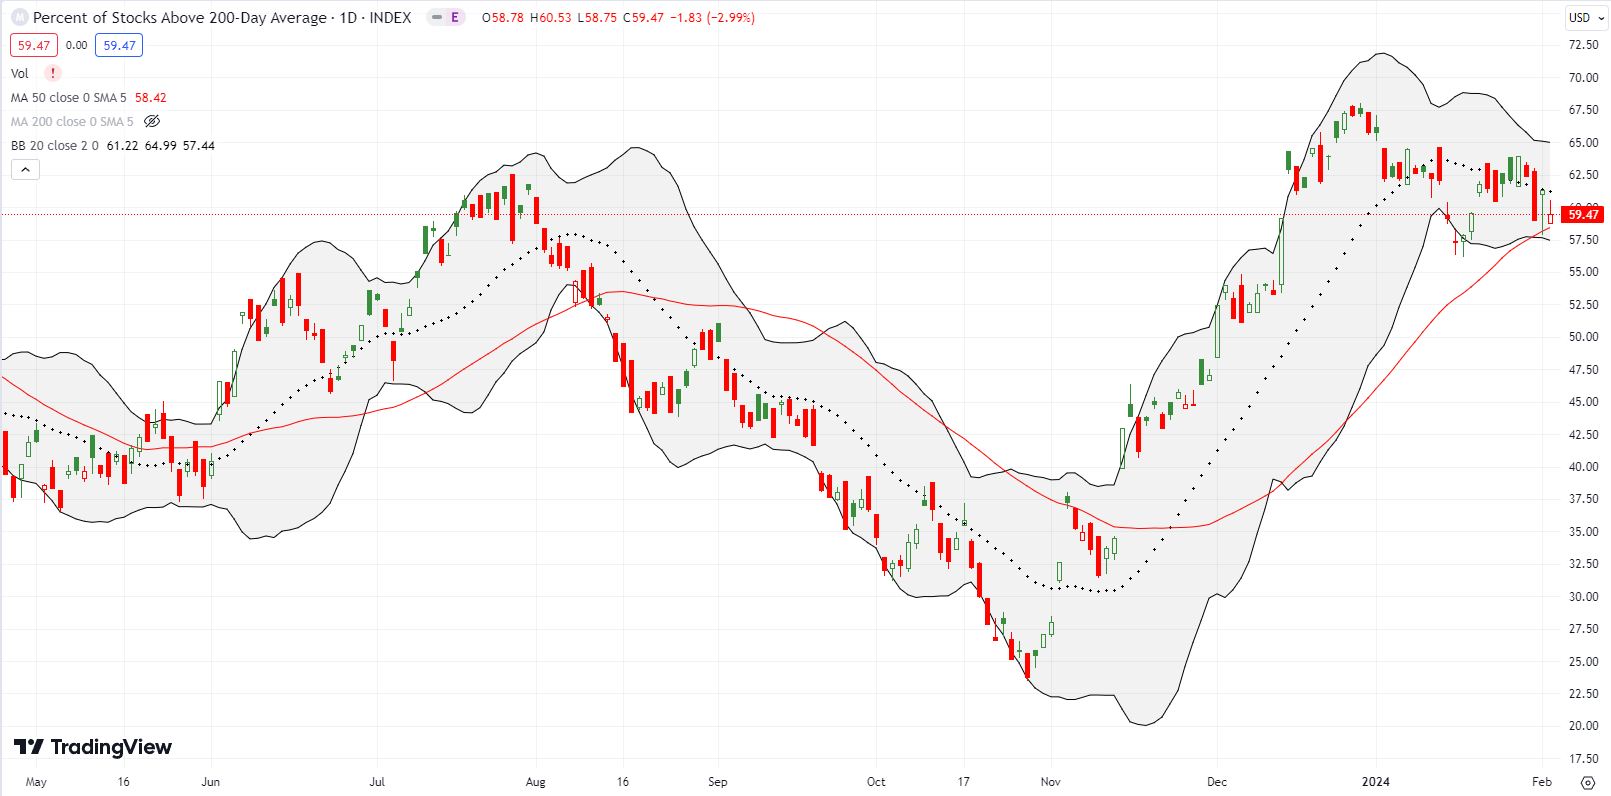
- AT200 (MMTH) = 59.5% of stocks are trading above their respective 200-day moving averages
- Short-term Trading Call: bearish
AT50 (MMFI), the percentage of stocks trading above their respective 50DMAs, closed at 52.7%. This close exactly matched its low from the week in the wake of the Fed on Wednesday. Accordingly, I am as bearish as I was a week ago. Yet, being and staying bearish in a market with such a sharp contrast in price action is quite tricky. I am most mentally comfortable when I see a market singing the same song. This market of two truths is singing bullish lullabies just as strongly as bearish roars. I am forced to respect the bullish action as I hunt down the growing collection of stragglers in the herd. Thus, my choices look more neutral, but in essence I remain solidly in the camp of “be ready so I don’t need to get ready”. The stock market is in the middle of quite a unique form of bearish divergence (where market breadth fails to confirm bullish indices).
The charts below provide colorful examples of the sharp contrast in the stock market and my choices for (precariously) navigating the two truths that constitute today’s bearish divergence.
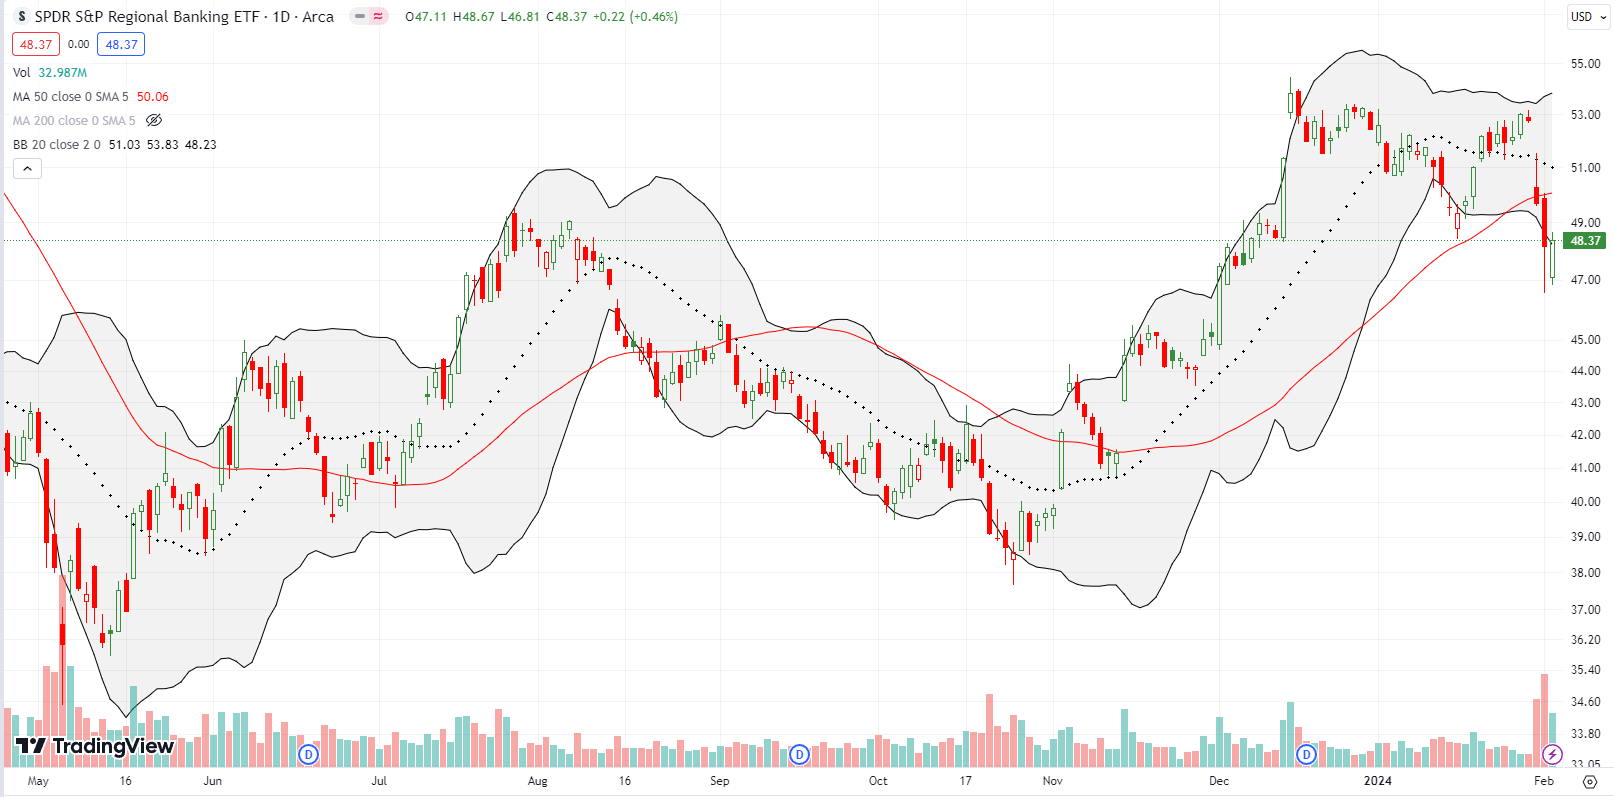
I start the review with the bearish news (of course). The SPDR S&P Regional Banking ETF fell from the sky suddenly and abruptly (be ready!) as New York Bancorp (NYBC) crashed 37.7% on poor earnings news. NYCB bought assets from Signature Bridge Bank in the wake of the regional banking crisis. The stock promptly gained 31.7% out of the ashes. NYCB rallied after the next two earnings reports and topped out soon thereafter. NYCB closed last week at an all-time low. I look at this episode as a reminder of just how much the market can ignore risks (sometimes called climbing the wall of worry) and/or get completely fooled by the “fundamentals” as reported by management.
KRE lost 5.9% on Wednesday and the carnage continued the next day in the form of a confirmed 50DMA breakdown. I bought a diagonal April/May $50/$45 put spread on the rebound. I plan to increase my bearish bets if the market grants cheaper prices. Note how KRE previously looked bullish with a picture-perfect bounce off 50DMA support and a full recovery of 2024’s loss right before this latest calamity.
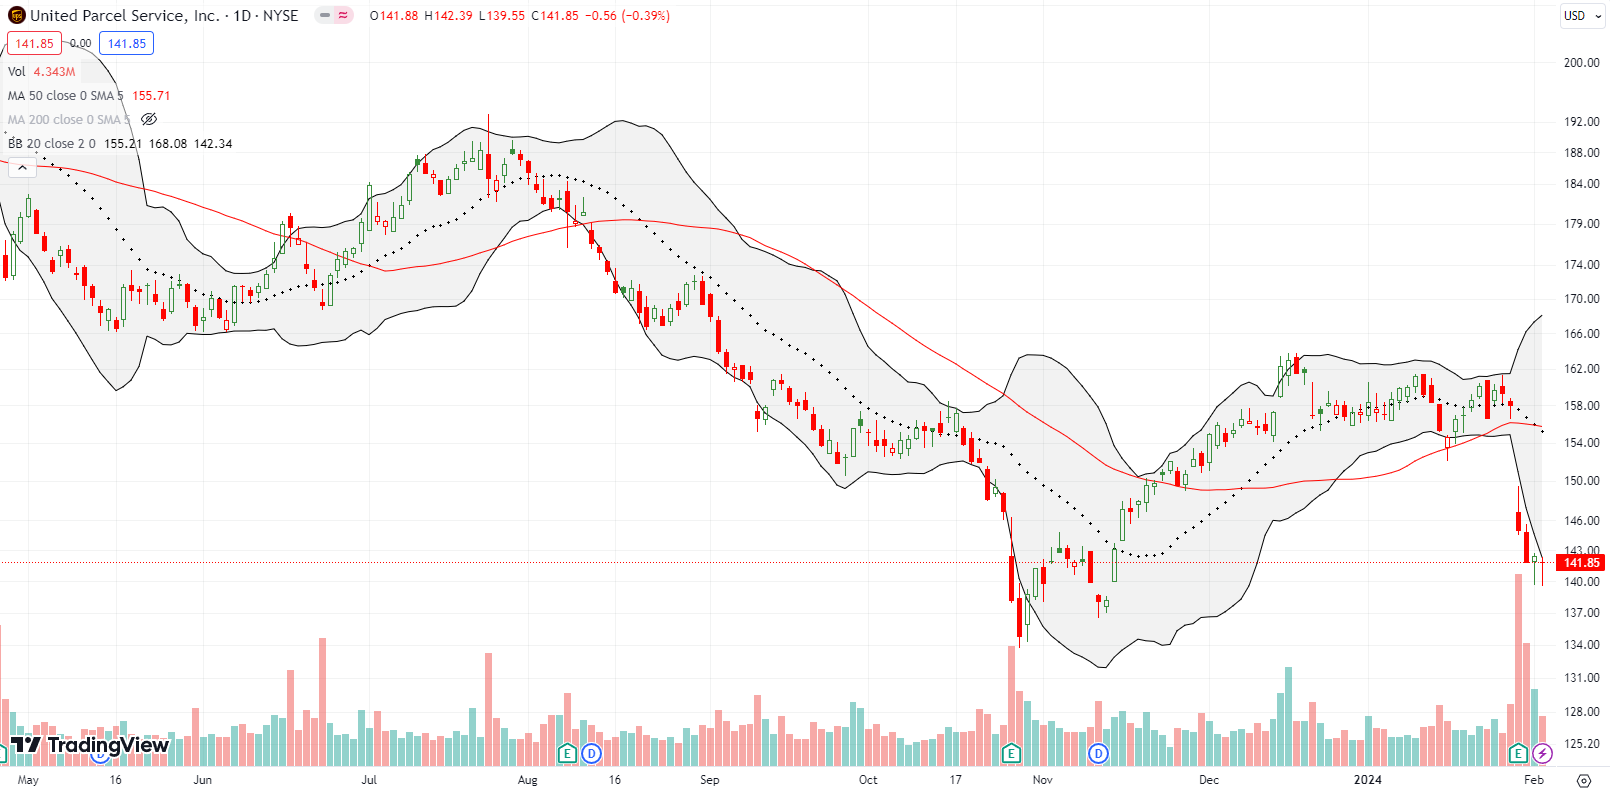
I stared and stared at United Parcel Service (UPS) to make a bearish pre-earnings trade. I decided to stand down given the stock was holding 50DMA support. More bad earnings news sliced UPS right through support for an 8.2% post-earnings loss. Across the last two trading days of the week, buyers stabilized the stock. Needless to say, UPS speaks loudly for the bearish truth in the stock market. (As a reminder, the earnings date is shown by the “E” on the horizontal axis).
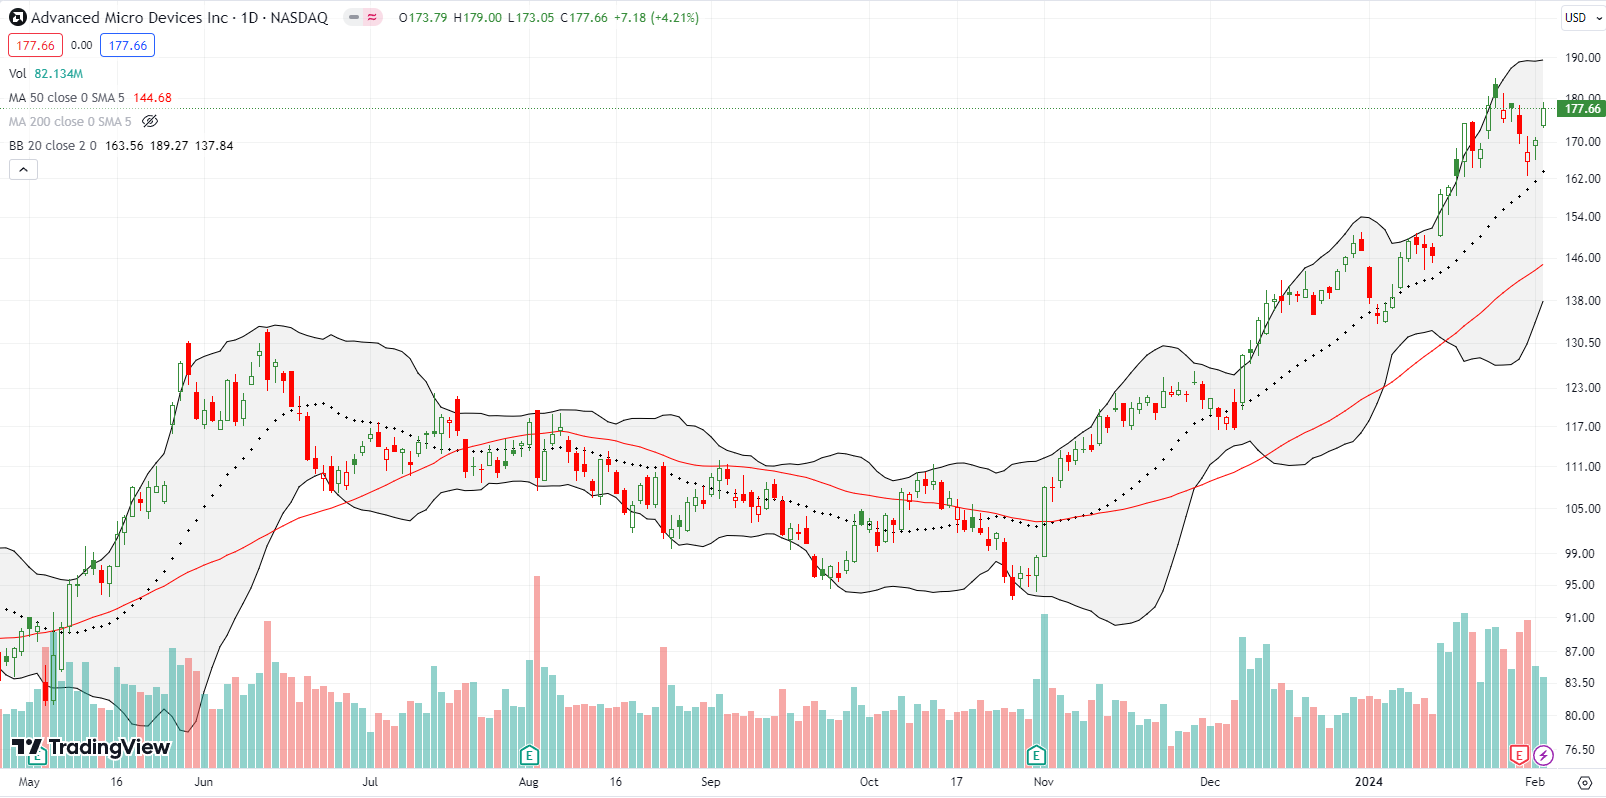
Advanced Micro Devices Inc (AMD) succumbed to selling pressure in the wake of earnings. However, clearly, there are investors and traders who love AMD even more than I do. They jumped right into the dip close to 20DMA support. AMD ended the week with a net post-earnings GAIN. Thanks to a discussion I had with a cousin of mine, I sold a February $150 put ahead of earnings. I took profits on Friday.
Independent of my general short-term market calls, I am an aggressive buyer on stocks in my generative AI basket. These stocks are solidly planted in the bullish truths of the market.
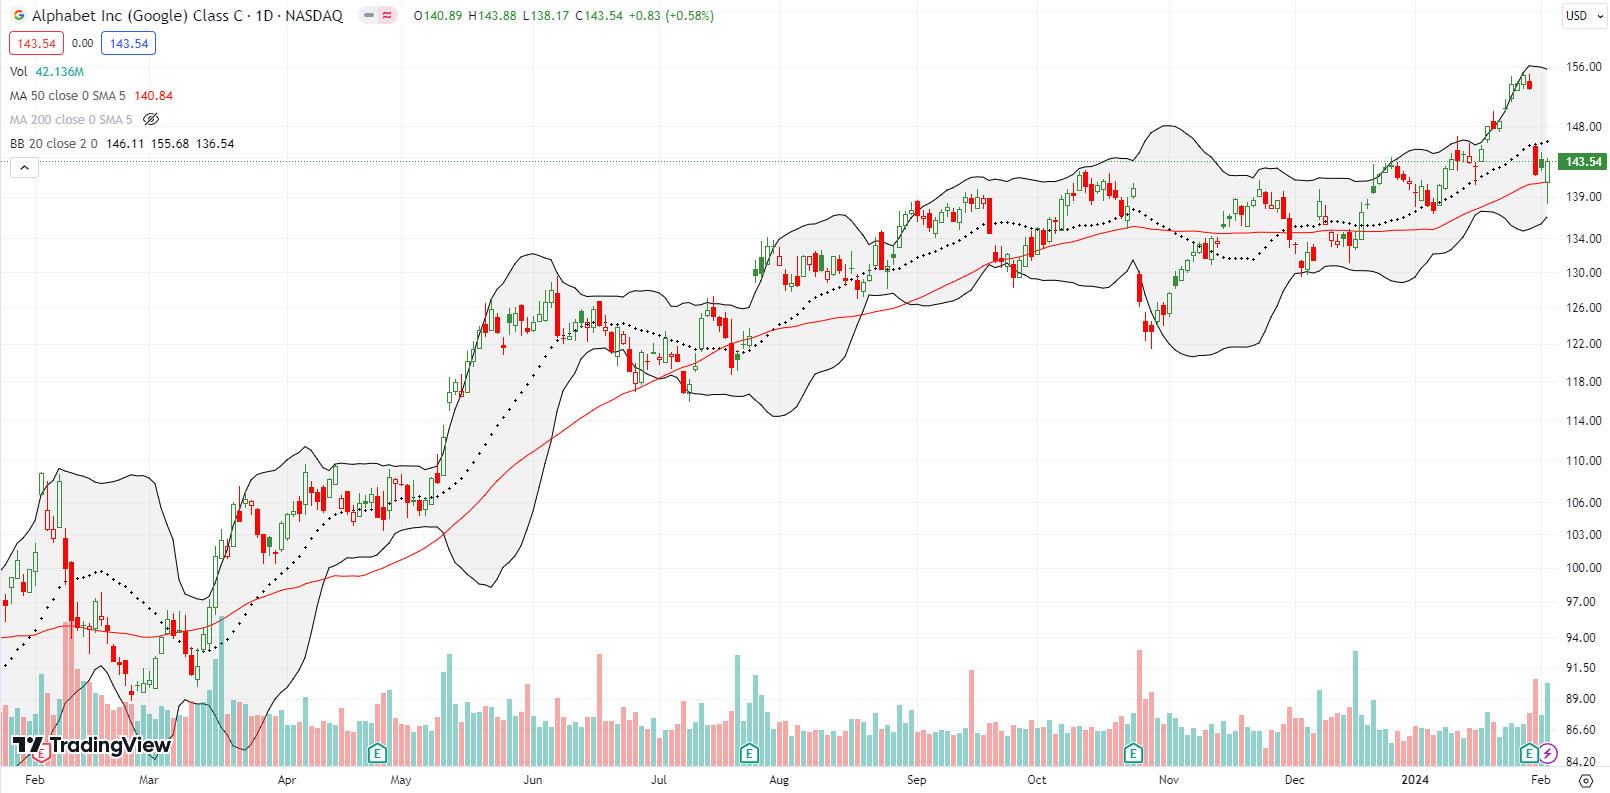
Alphabet Inc (GOOG) is also in my generative AI basket. Thus I was tempted to buy into GOOG’s 7.4% post-earnings plunge. With the close just above 50DMA support, I decided to wait. When GOOG traded below its 50DMA on Friday, I felt relieved. Because GOOG closed the day ABOVE 50DMA support, I now have the stock right at the top of my buy list next week! Note GOOG closed right at its 2024 breakout point (follow the green horizontal dotted line from the day’s close).
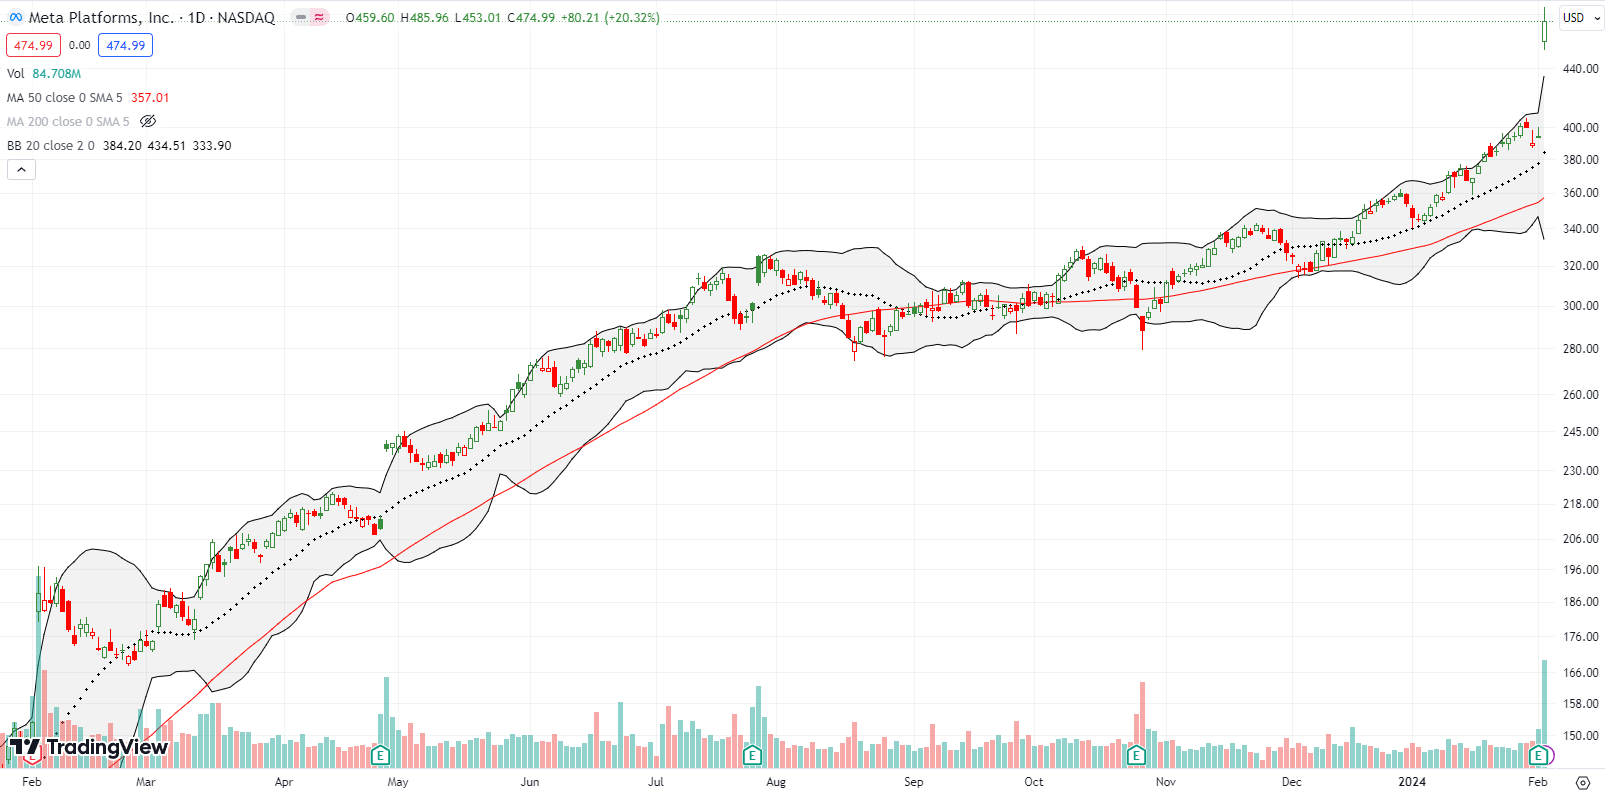
Meta Platforms, Inc (META) was THE news of the week. META is now the clear champion for the bullish truths in the stock market. The stock surged 20.3% post-earnings. The $200B+ increase in market cap in just one day is simply astounding…and contributes to the sharp contrast in the stock market. Meta Platforms further ingratiated itself to the market by announcing a $0.50/quarter dividend and a massive share buyback. After 2023’s “year of efficiency” that included slashing spending on the Metaverse and implementing large layoffs, Meta suddenly has little better to do with all that cash than to pay off shareholders. Insert =shrug= here.
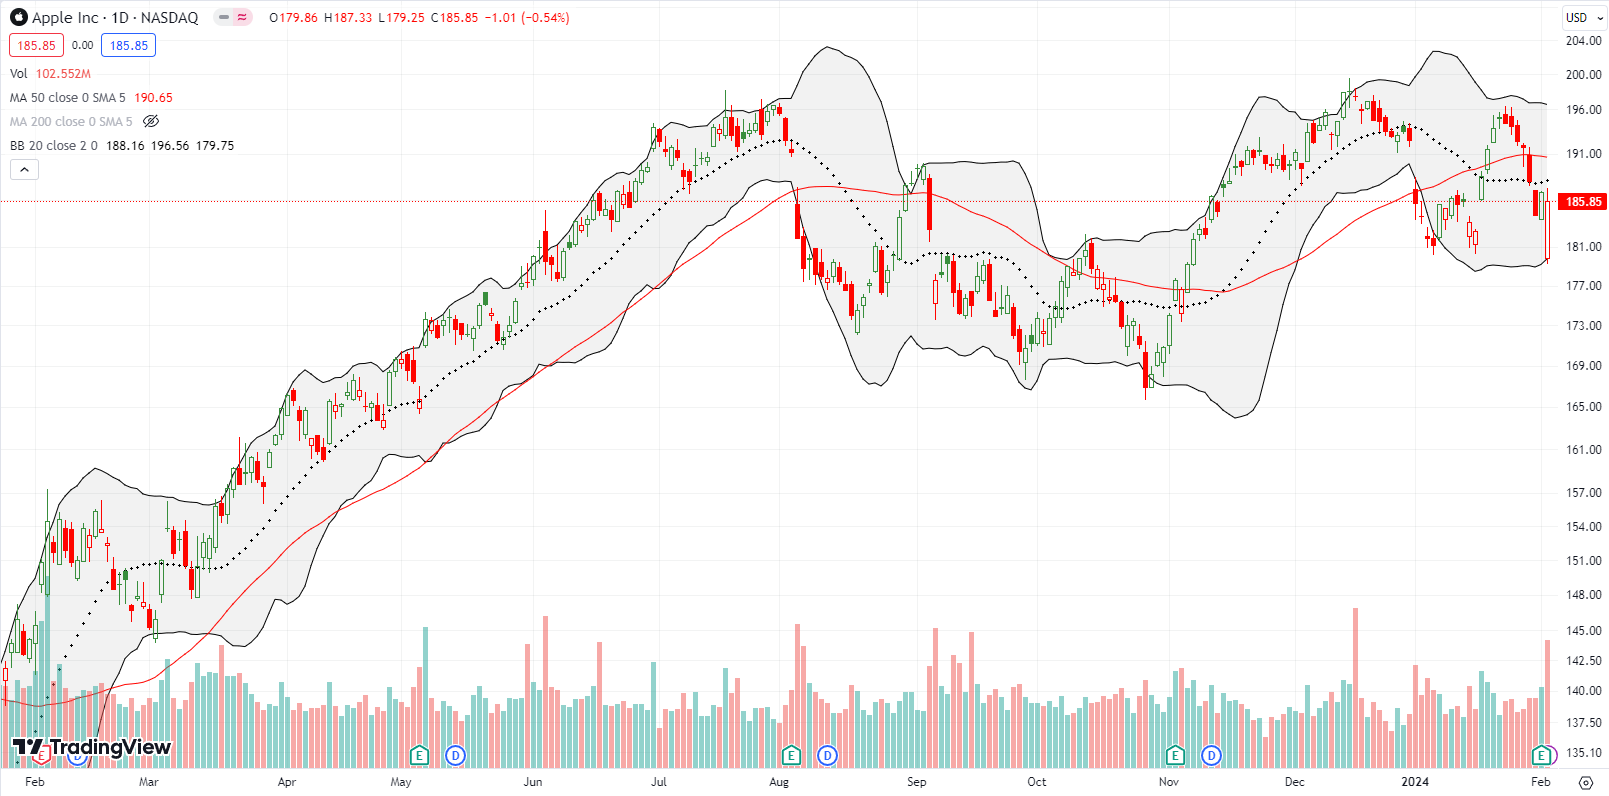
In the last Market Breadth post, I put Apple Inc (APPL) in the bearish truths of the market. AAPL continued to sell off until the day of earnings. Post-earnings, AAPL gapped down sharply and seemed to further confirm its bearishness. Buyers stepped in with force at that point. At one point, AAPL was flat on the day. Despite the heroics, AAPL stays in the bearish truths of the market until its next 50DMA breakout (triple top anyone?). Note how buyers defended the lows of 2024.
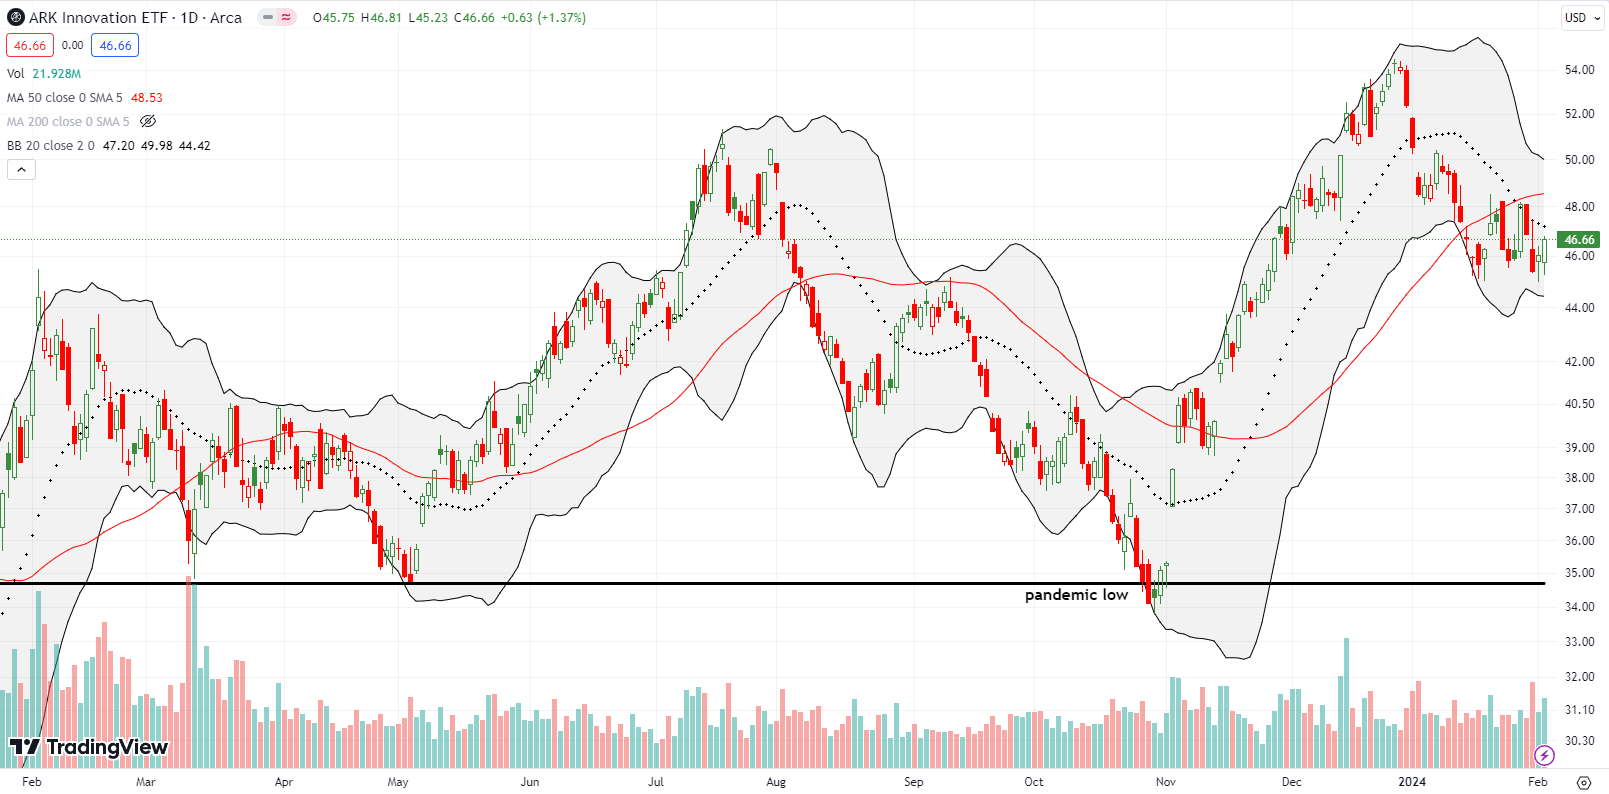
At the beginning of the year, I assumed that a market rebound would include the kind of speculative fury required to send the ARK Innovation ETF (ARKK) into a rally. While big cap tech soars, ARKK churns. The widening gulf creates a sharp contrast. ARKK is down 10.9% for the year and is drastically underperforming the market. The ETF even trades below last summer’s highs. The only good thing I can say about this bearish churn below 50DMA resistance is that the price action is conducive to my strategy of selling calls against existing shares.
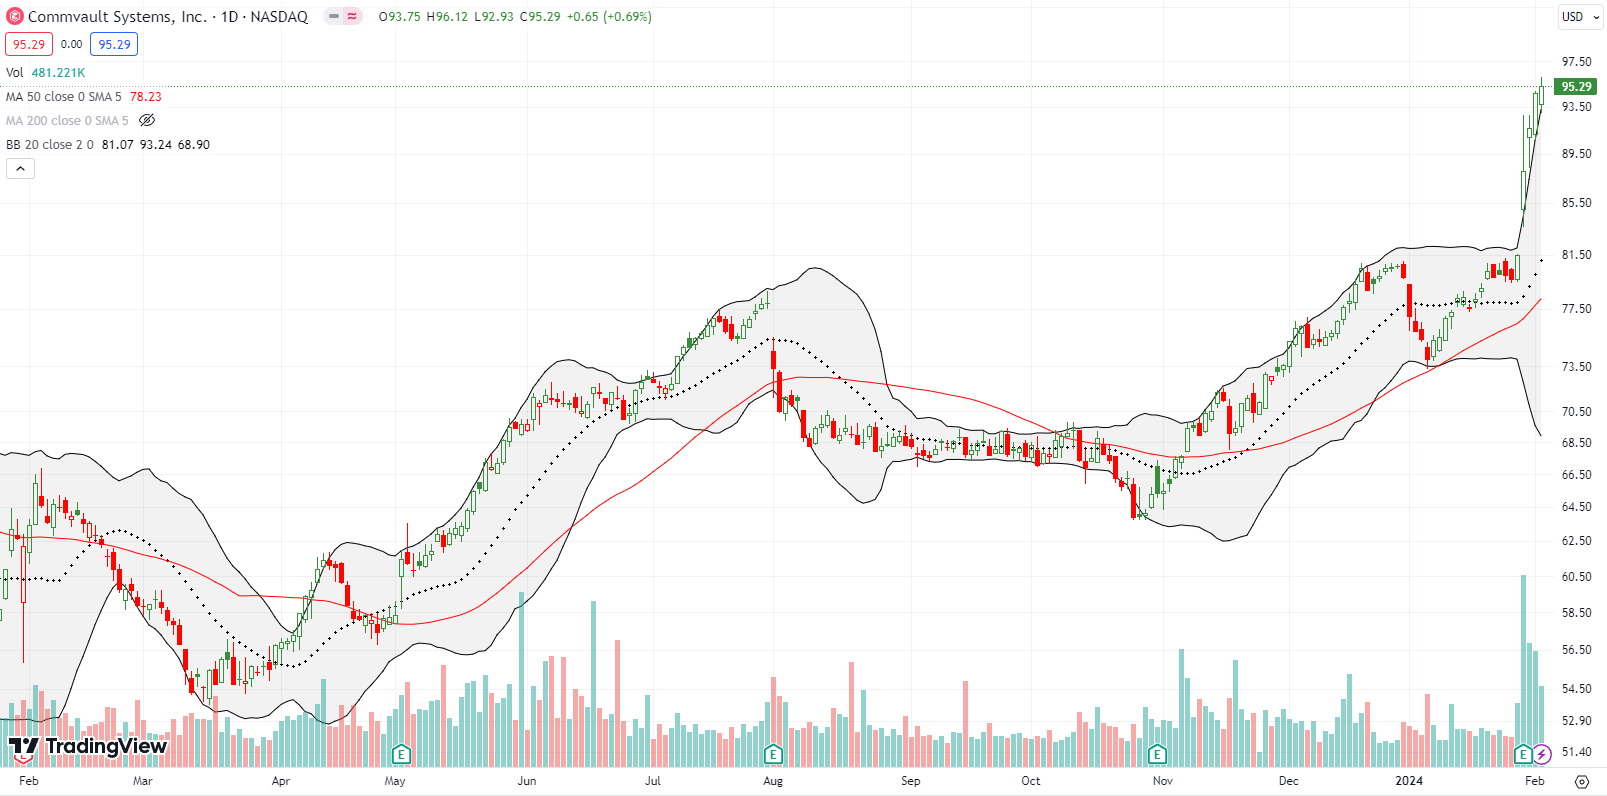
I stumbled on data protection company CommVault Systems, Inc (CVLT) while reviewing the big movers after Fed day. CVLT gained 8.1% post-earnings and has continued to gain on high buying volume. CVLT closed the week at an all-time high. This bullish truth is a buy on the dips.
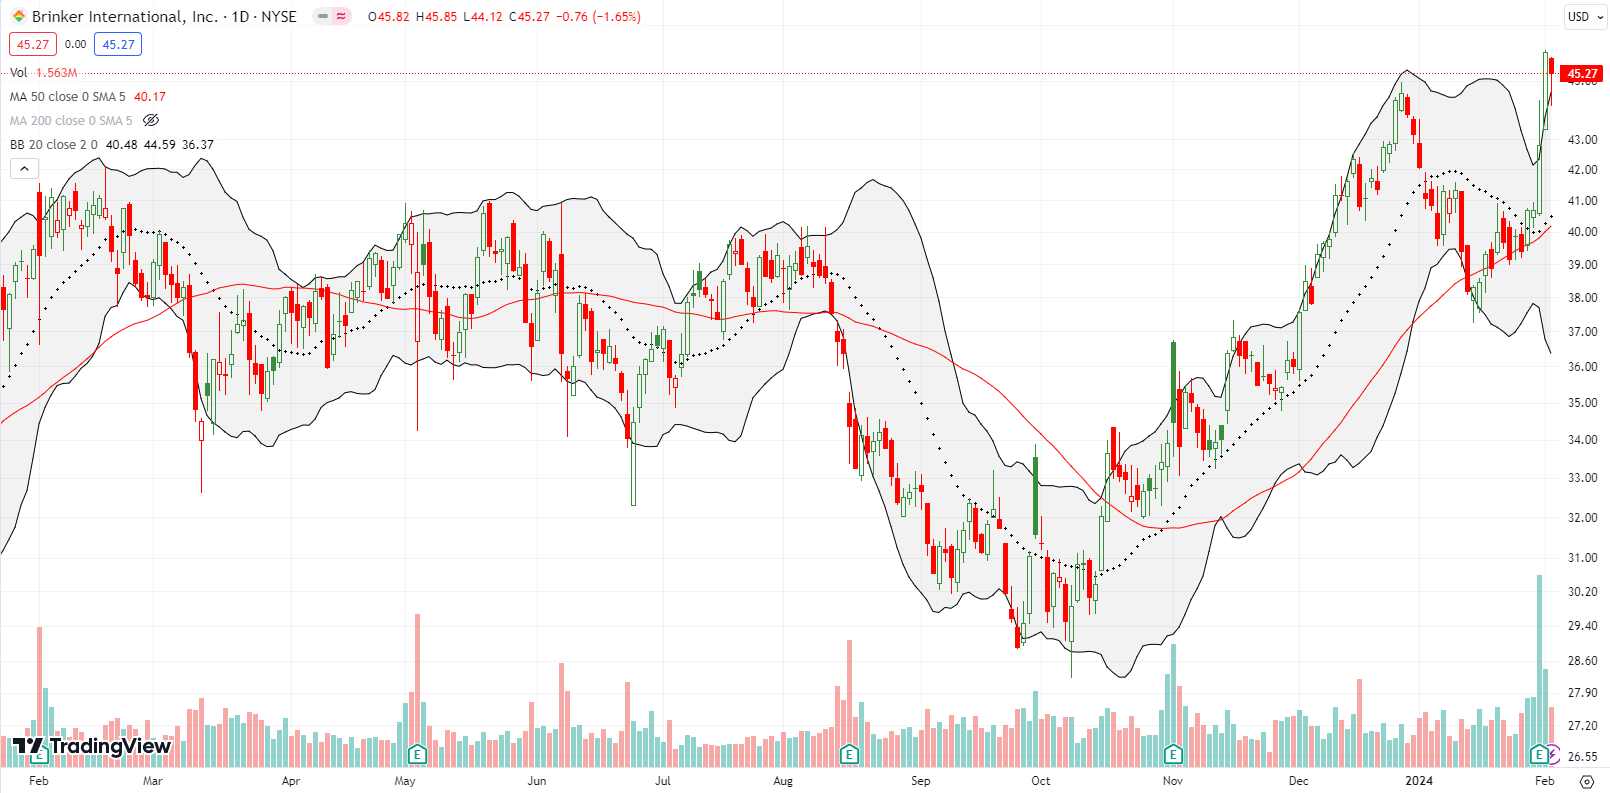
Given on-going strength in the jobs market, the breakout for restaurant group Brinker International, Inc (EAT) makes sense. However, before the 5.2% post-earnings gain and follow-through, the stock was down for the year. Its 50DMA held up to the challenge and provided support for this breakout. Although EAT trades just marginally over the previous peak, it looks like a buy on the dip from here.
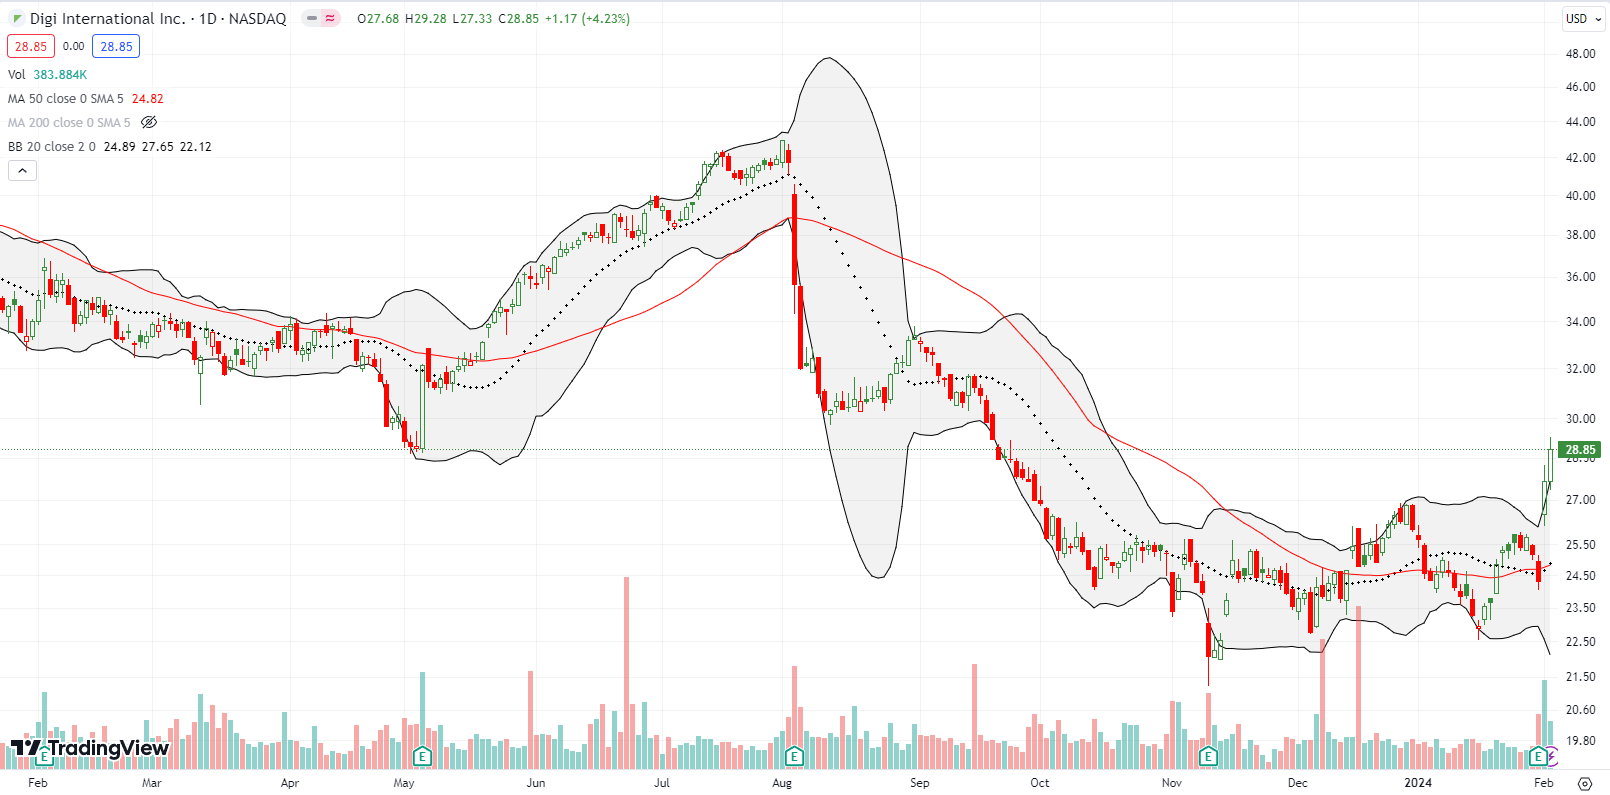
Given the two truths in the market, I keep sneaking a peak at bullish setups in the market. Communications equipment provider Digi International Inc (DGII) enjoyed a 13.9% post-earnings gain and breakout that leaves behind what looks like a bottoming pattern. DGII created a base by consolidating around its 20DMA for 3 months. I jumped into the stock at the start of trading on Friday, and I hope to hold this one through at least a recovery from last summer’s post-earnings tumble.
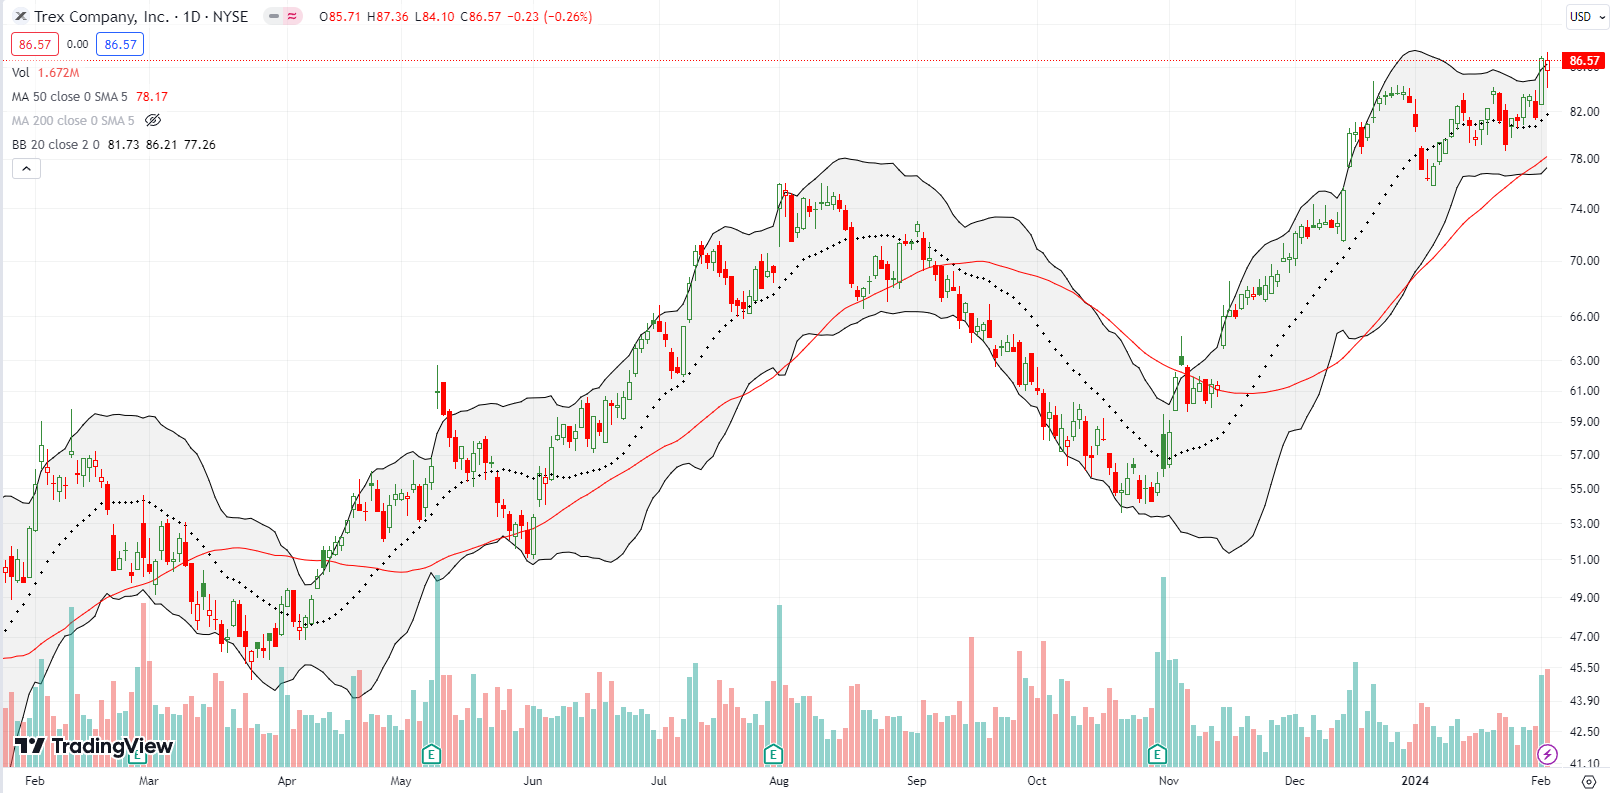
Building products and equipment provider Trex Company, Inc (TREX) broke out to a near 2-year high after being well-supported by 20DMA support. While I saw no news behind this move, this breakout is the kind of move I like to buy. I jumped into the mini-dip on Friday. The stock has plenty of room between here and the 2021 all-time high around $140, so I hope to ride TREX for a while. I have a tight stop below the 50DMA.
Be careful out there!
Footnotes
Subscribe for free to get email notifications of future posts!
“Above the 50” (AT50) uses the percentage of stocks trading above their respective 50-day moving averages (DMAs) to measure breadth in the stock market. Breadth defines the distribution of participation in a rally or sell-off. As a result, AT50 identifies extremes in market sentiment that are likely to reverse. Above the 50 is my alternative name for “MMFI” which is a symbol TradingView.com and other chart vendors use for this breadth indicator. Learn more about AT50 on my Market Breadth Resource Page. AT200, or MMTH, measures the percentage of stocks trading above their respective 200DMAs.
Active AT50 (MMFI) periods: Day #47 over 20%, Day #45 over 30%, Day #43 over 40%, Day #42 over 50%, Day #39 over 60%, Day #1 under 70% (1st day under 70%, ending 29-day overbought period)
Source for charts unless otherwise noted: TradingView.com
Full disclosure: long ARKK, long IWM calendar put spread, long DGII, long TREX, long KRE put spread,
FOLLOW Dr. Duru’s commentary on financial markets via StockTwits, Twitter, and even Instagram!
*Charting notes: Stock prices are not adjusted for dividends. Candlestick charts use hollow bodies: open candles indicate a close higher than the open, filled candles indicate an open higher than the close.


