

Housing Market Intro and Summary
I thought the advantage of new home sales over existing homes was coming to an end soon. The data suggest otherwise. New home sales surged to an 18-month high while existing home sales fell to a 12-year low. The resilience continues for new homes and most builders.
The stock market actually yawned after the new home sales breakout. The iShares US Home Construction ETF (ITB) fell to a fresh 6-month low that day. ITB has yet to trade lower. Oversold trading conditions built the launchpad. An excited response to the Federal Reserve’s decision to keep interest rates steady helped to hurl home builder stocks skyward for a big start to the seasonal strength for the stocks of home builders. With the promise of a top and eventual decline in mortgage rates, suddenly, the bullish drumbeat from the earnings of home builders mattered to traders and investors. ITB is up 7.1% for the first two days of November. This performance far outpaces the S&P 500’s (SPY) 3.0% gain month-to-date.
Housing Stocks
In my last Housing Market Review, I noted that the weakness in ITB converged with the imminent start of the seasonal strength for home builder stocks. I noted that oversold conditions in the stock market represented the beginning of buying opportunities in home builders. However, weakening housing data motivated me to push the start of the season to November. The time is here with a big start!
On Wednesday, November 1, I started tentatively by adding shares to my holding in Tri Point Homes (TPH). Thursday’s even stronger buying forced me into a scramble. I bought shares in ITB and chased some individual homebuilders with calendar call spreads. I fully expect (and actually hope for) a pullback that cools off some of this excitement. I will buy into such a dip down to the 200-day moving average (DMA) for ITB (the blue line below).
")
Since I was chasing, I chose two of the strongest home builders based on my analysis of revenue and margin growth.
PulteGroup (PHM) avoided a test of 200DMA support following earnings last month. The buying interest since then has turned the 20DMA (the dashed line) upward in what has become an overall bullish positioning for a likely (near-term) bottoming. Note how PHM is over-stretched above its upper Bollinger Band (BB) (the black lines that describe “typical” price volatility around the 20DMA).
")
Meritage Homes Corporation (MTH) surged 7.0% post-earnings. Buyers followed up with a 4.2% gain and a 200DMA breakout. Like PHM, MTH is over-stretched above its upper BB.
")
Housing Data
Home Builder Confidence: The Housing Market Index – October, 2023
In June, the National Association of Home Builders (NAHB)/Wells Fargo Housing Market Index (HMI) entered positive sentiment territory (over 50) for the first time in almost a year. HMI further increased in July to a 13-month high. Sentiment returned to negative territory in September, and in October dropped for the third month in a row. At 44, HMI is at its lowest level since the beginning of the year.
The NAHB once again suggested that stubbornly high mortgage rates above 7% are driving the descent in sentiment. The industry group reiterated supply-side concerns as a weight on sentiment and added the cost and availability of home insurance to the list. Thus, a return to price discounting further confirms the fresh decline in sentiment. The share of builders cutting prices returned to levels last seen in December, 2022 although the average price discount stayed flat at 6%. The share of builders providing incentives hit the cycle high set last December.
/Wells Fargo Housing Market Index (HMI) and the University of Michigan Index of Consumer Sentiment")
Source for data: NAHB and the University of Michigan
The HMI bottomed 5 months after consumer sentiment. Earlier, I thought consumer sentiment had topped out and would cap HMI as well. Instead, HMI helped pull consumer sentiment upward…but for just one month. My expectations for a topping out in housing activity and home builder stocks is now fully supported by the parallel declines in the HMI and consumer sentiment.
The decline in HMI was broad-based across the components. Each one declined significantly from August’s levels.
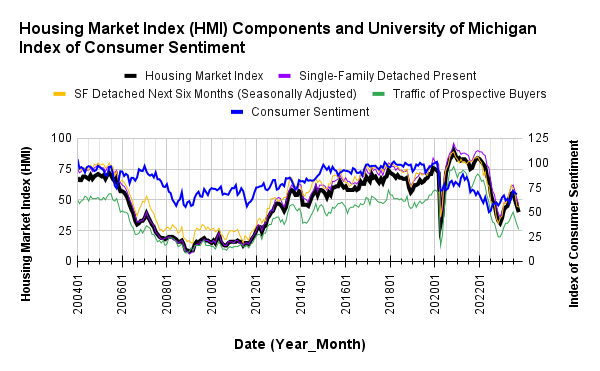
Each HMI component declined significantly with the Single-Family Detached Present joining the other two components in negative territory.
The regional HMIs each took a hit. The South and the West declined the most. Both regions are now at their second lowest levels of the year. As I noted in the previous Housing Market Review, the sharp drops in sentiment in the South augur poorly for overall HMI in the coming months….unless of course mortgage rates top out and start coming down.
New Residential Construction (Single-Family Housing Starts) – September, 2023
Housing starts continue to look like they have stalled out right under the 1M level. Housing starts increased 3.2% month-over-month to 963,000. Starts continued year-over-year strength with an 8.6% gain in September. The decline of HMI further below 50 suggests the 1M ceiling on housing starts is also firmer than before.
![US. Bureau of the Census, Privately Owned Housing Starts: 1-Unit Structures [HOUST1F], first retrieved from FRED, Federal Reserve Bank of St. Louis, November 1, 2023](https://drduru.com/onetwentytwo/wp-content/uploads/2023/11/20231101_housing-starts.png "Housing starts")
Poor builder sentiment is still not hindering intentions to build. Building permits in September generated an eighth consecutive monthly increase with a 1.6% gain. The surprising message from building permits suggests starts will break out in the coming months. I am now more amenable to this message given the new rate environment.
The South and the West were the two regions with year-over-year gains in starts. The Northeast was the only region without a month-over-month gain. The regional robustness in starts is surprising given the on-going declines in sentiment. One of these trends has to turn around. Housing starts in the Northeast, Midwest, South, and West each changed -21.7%, -1.6%, +16.0%, +4.7% respectively year-over-year.
New Residential Sales (Single-Family) – September, 2023
New home sales suddenly do not look burdened by mortgage rates. The uptrend from the trough resumed to send new home sales to levels last seen in February, 2022. The 676,000 sold in August were a 5-month low (revised slightly upward). The 759,000 new homes sold in September delivered a 12.3% month-over-month gain and a 33.9% year-over-year surge. September’s breakout contradicts my claim from the August Housing Market Review: “With rates above the 7% level, I still expect new home sales to flatten out in the near-term. The plunge in builder confidence suggests a flattening is in store.”
![US. Bureau of the Census, New One Family Houses Sold: United States [HSN1F], first retrieved from FRED, Federal Reserve Bank of St. Louis, November 2, 2023.](https://drduru.com/onetwentytwo/wp-content/uploads/2023/11/20231102-New-Home-Sales.png "new home sales")
The median price dropped 3.3% from August to $418,800, also a 12.3% year-over-year decrease. The year-over-year changes violated the bottom I thought was in place. The last yearly price change this low was at the very bottom of the Great Financial Crisis in February, 2009! The price bubble has popped both from smaller homes and incentives from home builders.
A transition in price mix could be underway with the advantage going to the lower tiers. In August, the year-over-year changes featured the middle price ranges giving up share to the edges with the lower ranges outweighing the higher ranges. In September, there was a full horizontal shift of pricing to the tiers below $400,000.
The inventory for new homes plunged to 6.9 months of sales from 7.8 in August. While the market remains above the 6.0 level characteristic of a balanced market, absolute inventories decreased slightly from 436,000 to 435,000. Demand for new homes remains strong.
In July, all four regions surged in sales year-over-year with the South gaining the least. For August, the South was the only region with a year-over-year decrease in sales. In September, the Midwest was the only region without a year-over-year surge in sales. The Northeast, Midwest, South, and the West changed +63.3%, +4.7%, 29.9%, and +53.3% respectively. The West enjoyed a third monthly surge.
Existing Home Sales – September, 2023
While new home sales enjoyed a breakout, existing home sales fell to new lows. The widening divergence is indicative of the prevailing dynamic of shrinking existing home inventory (or options) sending buyers knocking on the doors of home builders. The National Association of Realtors (NAR) lamented wistfully that “the Federal Reserve simply cannot keep raising interest rates in light of softening inflation and weakening job gains.”
Existing home sales continued a year-long decline with a 2.0% month-over-month drop in September. The seasonally adjusted annualized sales in September of 3.96M declined 15.4% year-over-year. My expectations for stabilization are now completely out the window. I am now not even sure what can stop the downtrend in the near-term. The second chart below shows that existing single family homes, excluding condos and coops, are, incredibly, below the pandemic low. Sales have hit a new 12-year low. The stabilization I expected for existing home sales is still holding true for condos and coops. Better affordability and availability likely works in favor of these housing units.

(For historical data from 1999 to 2014, click here. For historical data from 2014 to 2018, click here) Source for chart: National Association of Realtors, Existing Home Sales© [EXHOSLUSM495S], retrieved from FRED, Federal Reserve Bank of St. Louis, November 2, 2023

The median sales price of an existing home last peaked in June. The 2.4% month-over-month price drop in September finished reversing the summer’s gains. Still, prices increased 2.8% year-over-year. While prices decline sequentially, they have increased year-over-year for the third month in a row.
September’s absolute inventory of 1.13M homes increased 2.7% month-over-month but plunged 8.1% year-over-year. According to the NAR, “unsold inventory sits at a 3.4-month supply at the current sales pace, up from 3.3 months in August and 3.2 months in September 2022.”
The average time on market for an existing home increased by a day from August’s 20 days. The 69% of homes that sold within a month is down from the 72% in August. Demand pressures are ever so slightly declining.
The share of sales to first-time home buyers settled back to 27% in September from August’s 29%. The share was also 29% a year ago. The newly found resiliency of first-timers may finally be softening. The NAR’s 2017 Profile of Home Buyers and Sellers reported an average of 34% for 2017, 33% for 2018, 33% for 2019, 31% for 2020, 34% for 2021, and 26% for 2022. The first-time buyer share for 2022 is the lowest on record for the NAR.
As has been the pattern for most of the year, all regions declined significantly in sales year-over-year. The West and the South were the two regions which also declined month-over-month. The regional year-over-year changes were: Northeast -16.7%, Midwest -18.4%, South -11.7%, West -19.3%. These big declines sharply contrast with the regional surges for new home sales.
No region experienced a year-over-year price decline. The West was the first region to flip negative in January, but the region was flat for July and up for August and now September. The regional year-over-year price changes were as follows: Northeast +5.2%, Midwest +4.7%, South +3.1%, West +1.8%. The NAR provided a rare explanation of regional trends: “The Northeast posted the strongest price gain resulting from higher demand coupled with inventory falling by 20%…The West experienced softer price growth reflecting a pause after years of unsustainable and rapid price increases, especially in the Rocky Mountain region.”
Single-family existing home sales decreased 1.9% from August and declined on a yearly basis by 15.8%. The median price of $399,200 was up 2.5% year-over-year but down 2.7% month-over-month.
California Existing Home Sales – September, 2023
Like the NAR, the California Association of Realtors (C.A.R.) lamented the impact of the Federal Reserve’s tight monetary policy. Yet, while sales continue to languish in California, prices just keep marching higher on a year-over-year basis.
Sales of existing single-family homes in California declined 5.4% from August to September and declined 21.5% year-over-year to 240,940. September’s median home price decreased 1.9% from August’s 15-month high yet held above $800,000 for the sixth month in a row. The median price is now up 3.2% year-over-year, the largest yearly price gain in 15 months. August’s increase was the largest in 14 months. The month-over-month price change on a square footage basis stayed flat at $417 (a 4.0% year-over-year gain).
The Unsold Inventory Index (UII) increased from 2.4 in August to 2.8 in September. The UII stayed flat year-over-year. Active listings are on a 6-month losing streak based on year-over-year losses, but they have also increased sequentially for the last 6 months. Slowly but surely, active listings are trickling back into the market.
Despite the sales decline, the market of existing buyers and sellers remains competitive in California. The average time to sell a home stayed flat with August at 18. The duration was 27 days a year ago. The statewide sales-price-to-list-price ratio stayed flat for the fifth month in a row at 100.0%.
Home closing thoughts
Unaffordable
Home buyers have faced a double whamming of increasing home prices and increasing mortgage rates. The combination has driven affordability to new lows according to the NAR.
Anti-Competitive
The Missouri judiciary threw the hammer down on the real estate brokerage industry. In a ruling that could have nationwide implications, a jury in a Kansas City court issued a guilty verdict in a case accusing the NAR, HomeServices of America, and Keller Williams of anti-competitive market behavior in the setting of rates for broker commissions. They were accused of violating anti-trust rules. Each of the defendants plan to appeal, so the final say in this matter is likely many more months or even years away.
Spotlight on Mortgage Rates
The Mortgage Bankers Association (MBA) reported a weekly decrease in mortgage applications 3 out of 4 weeks in October. This slowdown follows a September with the same ratio. Yet September also logged yet another year-over-year surge in mortgage applications in for new homes. The 14.9% increase continues to reinforce the on-going shift in housing activity away from existing homes and toward new homes. The inexorable increase to 8% has yet to slow overall sales of new homes. A peak here could drive a new surge of new home buyers.
![Source: Freddie Mac, 30-Year Fixed Rate Mortgage Average in the United States [MORTGAGE30US], retrieved from FRED, Federal Reserve Bank of St. Louis, November 2, 2023](https://drduru.com/onetwentytwo/wp-content/uploads/2023/11/20231102-30-Year-Fixed-Rate-Mortgage-Average-in-the-United-States.png)
Be careful out there!
Full disclosure: long ITB, long TPH, long MTH calendar call spread, long PHM calendar call spread
Federal Reserve and US Treasury activities may keep mortgage rates elevated for many years, long after the Fed’s measures of inflation are back to around 2%. The keys are:
1) will the Treasury minimize the pressure on the mortgage market by mostly issuing 2-5 year notes, as Yellen has mentioned?
2) will the Fed keep shrinking its balance sheet by selling US bonds it acquired during 10 years of QE?
I think the QT will be the most powerful force going forward. I *think* the massive funding needs of the US government has done the majority of its damage. However, if deficits keep expanding , bets are off the table!