Stock Market Commentary
The stock market continued its inflation celebration last week with a surge on Monday. The buying momentum abated from there as the holiday-shortened week rolled into Thanksgiving and then Black Friday. Even though NVIDIA (NVDA) stole the earnings spotlight for the week, the U.S.’s most storied day of shopping set the stage for retail-related earnings reports. I eyed stocks that indicated “retail turns a corner”, even though the results were a bit mixed. These stocks could be interesting catch-up trades as the stock market stretches and extends toward overbought conditions.
The Stock Market Indices
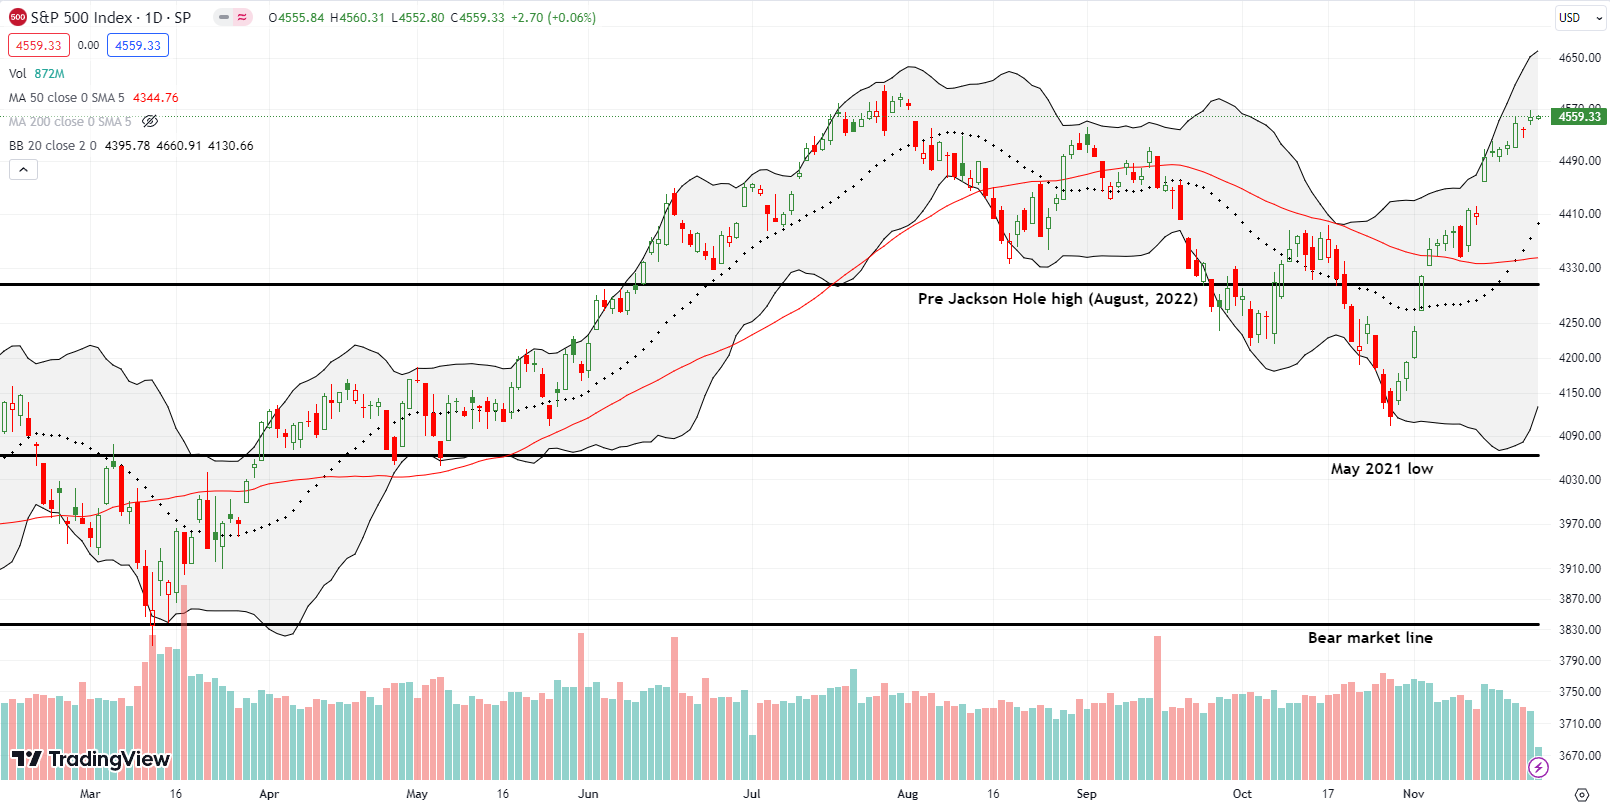
The S&P 500 (SPY) started the week with a 0.7% gain and an important breakout above the September 1st intraday high. The index drifted higher from there and is closing in on its 2023 high….just as market breadth approaches overbought levels. I took profits on my SPY call spread on Monday’s surge higher. I consider the index a buy on dips, but the current momentum has made aggressive trend following profitable.
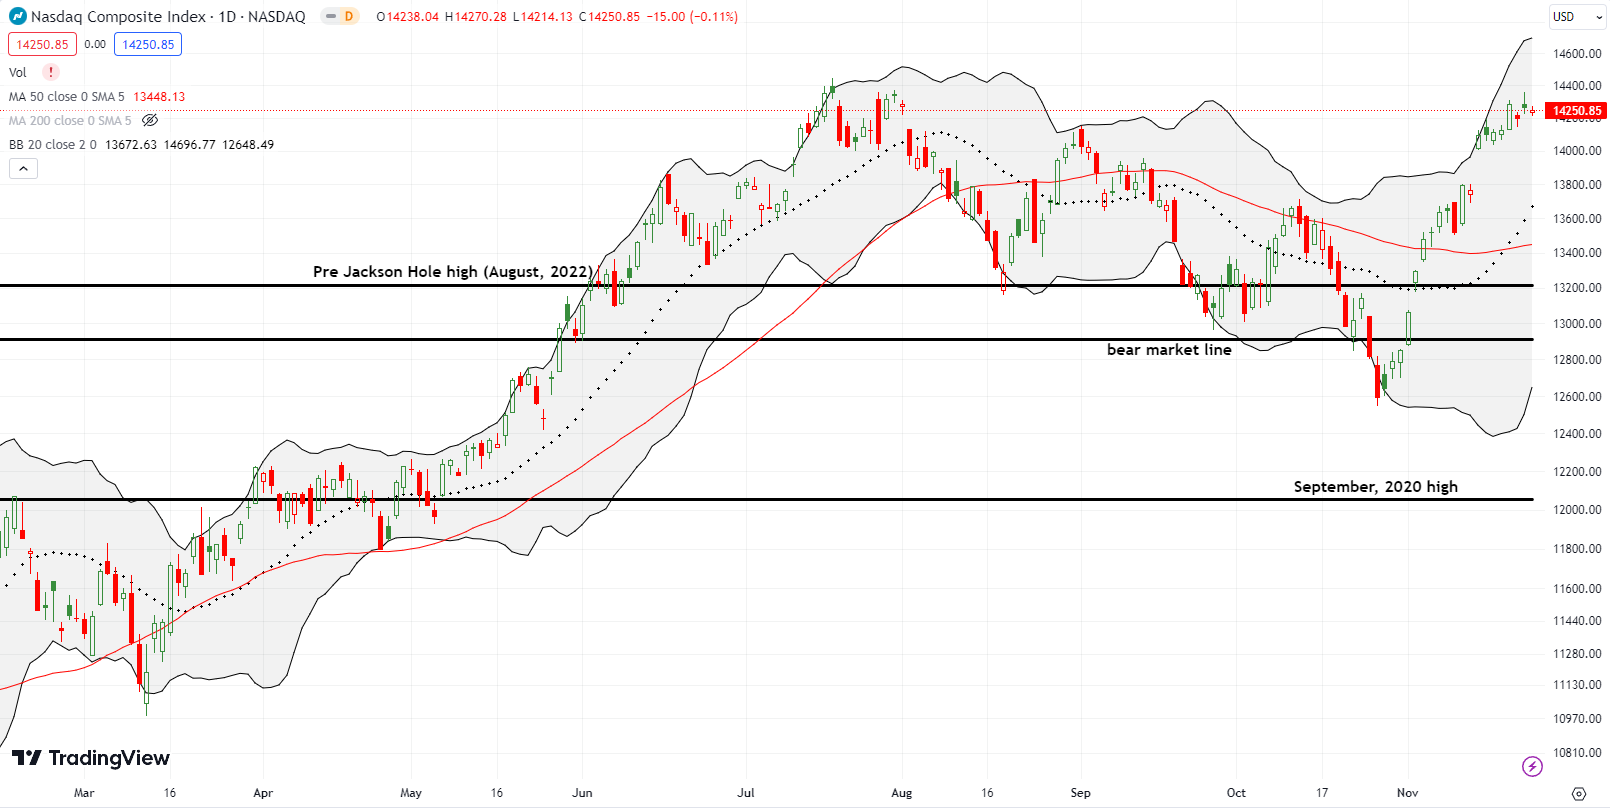
The NASDAQ (COMPQ) started the week with a marginal breakout already in hand. So Monday’s 1.1% gain confirmed the tech-laden index’s bullish move. However, the NASDAQ churned from there and actually lost a little momentum on Friday. Still, the NASDAQ remains well-positioned to print a new high for the year in coming days or weeks alongside overbought conditions.
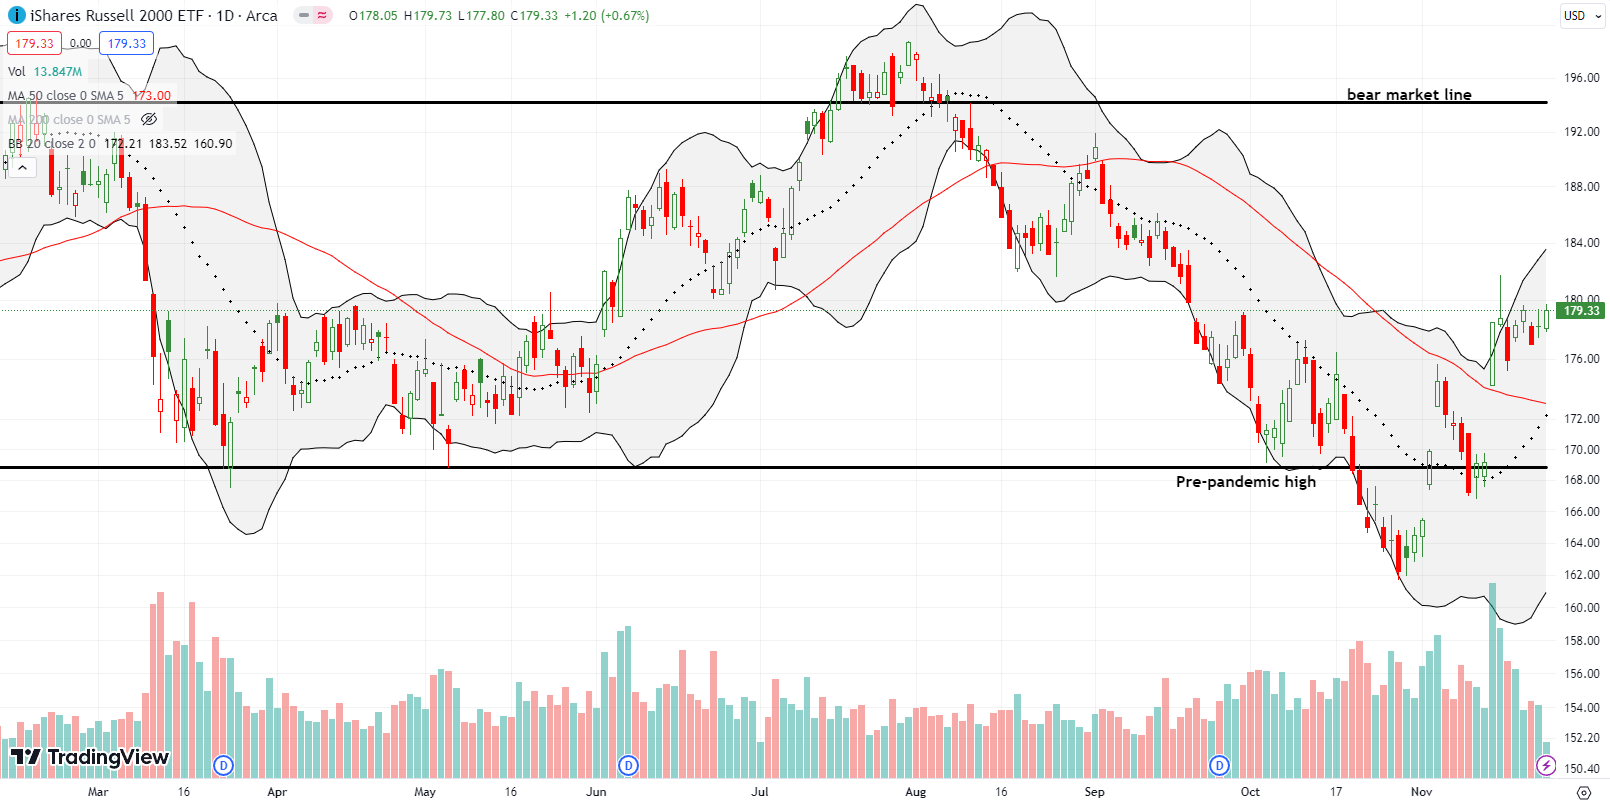
The iShares Russell 2000 ETF (IWM) gained 0.6% to start the week and just churned the rest of the way. The good news is that this ETF of small caps looks like it is coiling for a slingshot move higher. I want to get positioned in fresh IWM calls on Monday in anticipation of a breakout. IWM’s fortunes are key to the prospects of overbought conditions.
The Short-Term Trading Call While Retail Turns A Corner
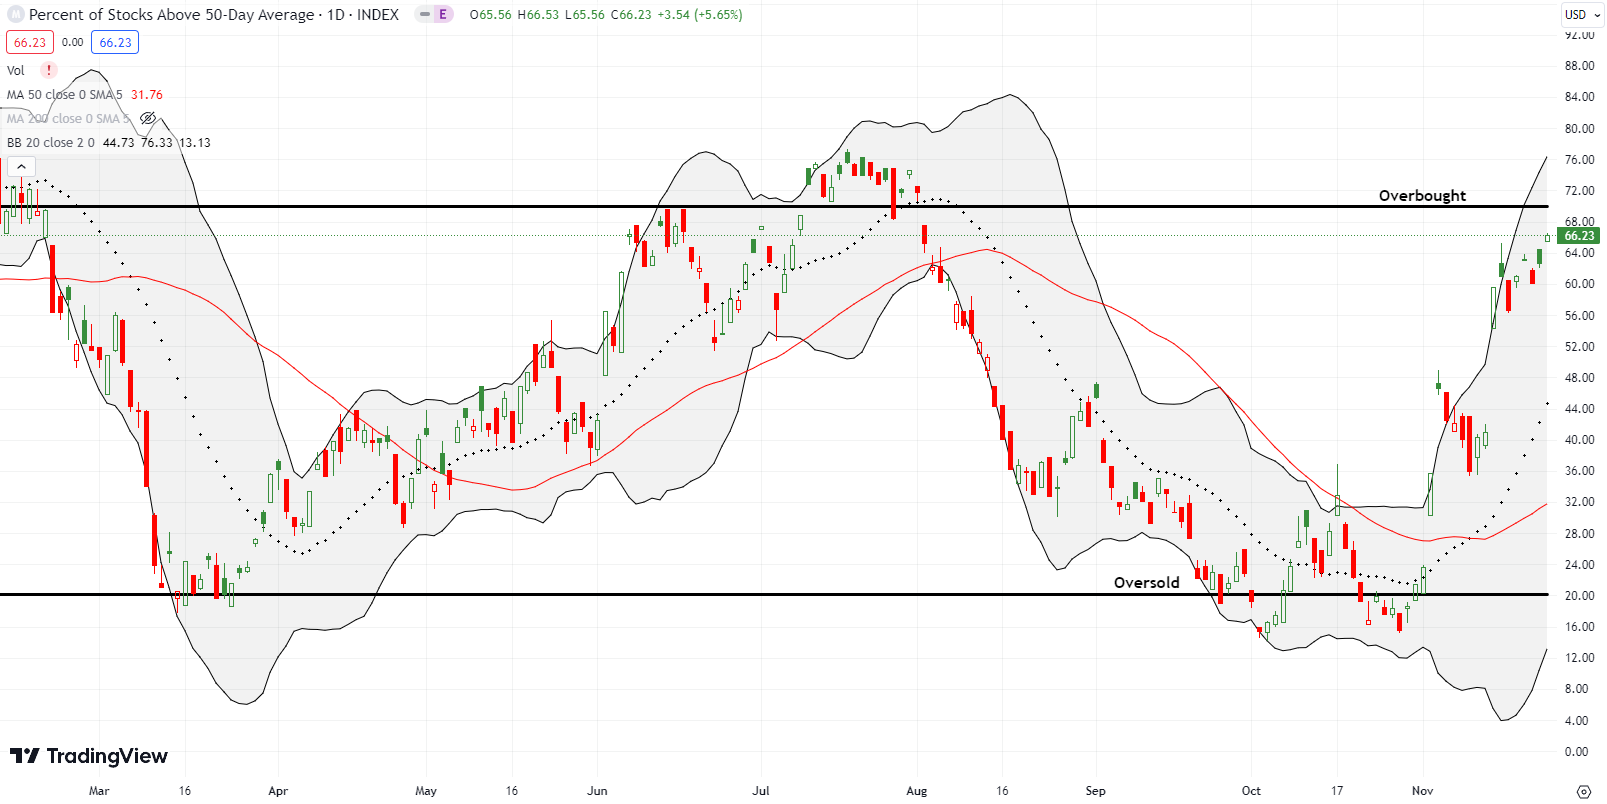
- AT50 (MMFI) = 66.2% of stocks are trading above their respective 50-day moving averages
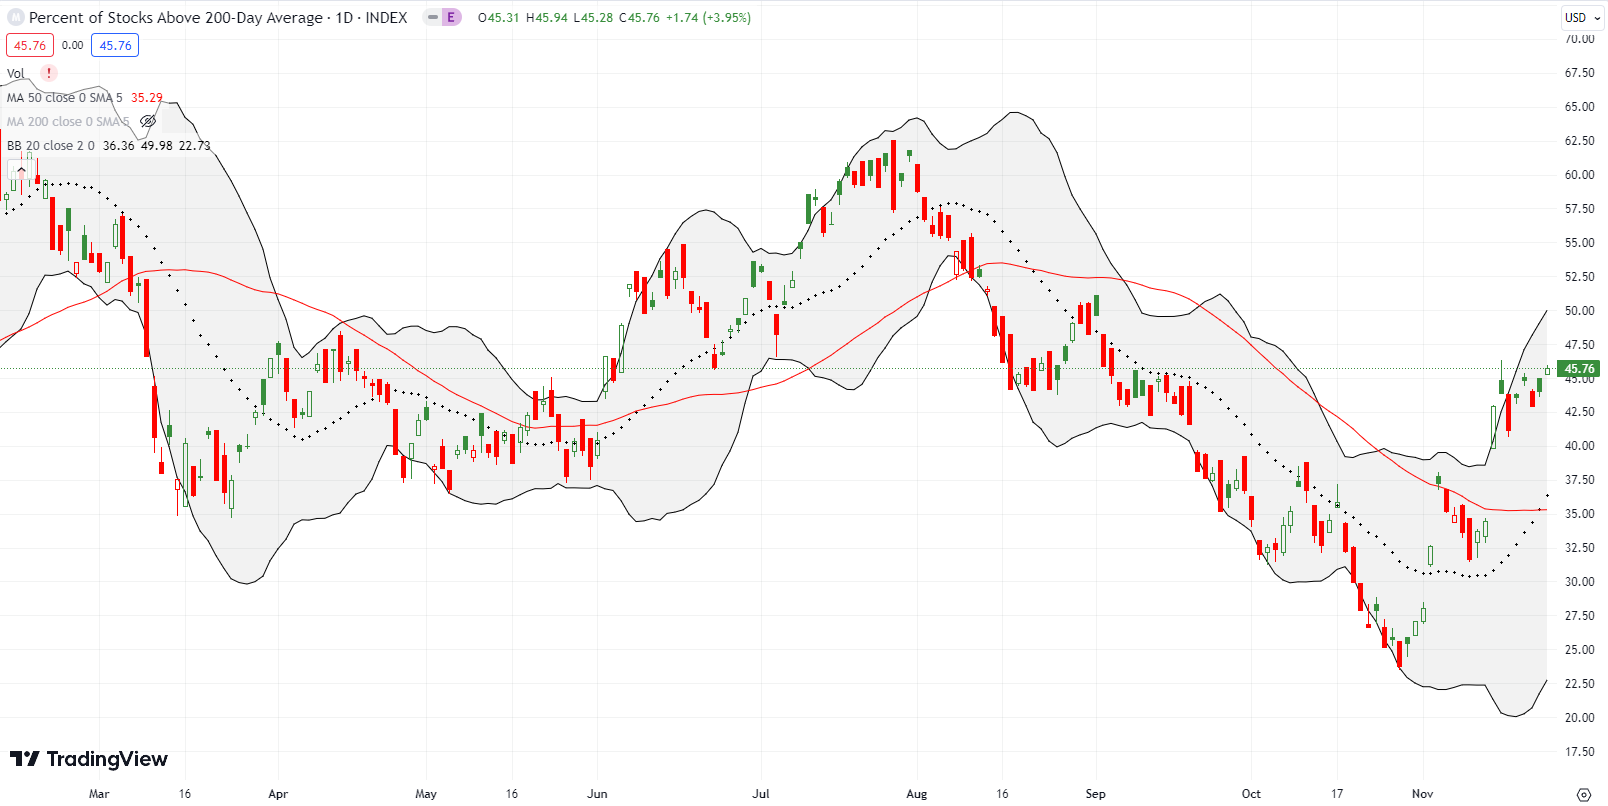
- AT200 (MMTH) = 45.8% of stocks are trading above their respective 200-day moving averages
- Short-term Trading Call: cautiously bullish
AT50 (MMFI), the percentage of stocks trading above their respective 50DMAs, closed the week at 66.2%. My favorite technical indicator stumbled after a strong week but drifted its way higher the rest of the way. The overbought threshold at 70% is now within sight. As a reminder, overbought conditions are NOT by themselves bearish. Read more details in my AT50 trading rules to understand why behavior around the overbought threshold is the defining point. I get bearish if AT50 gets rejected from the overbought threshold or drops below the threshold after a meaningful overbought period.
Given the onset of Black Friday, I focused on the charts of retail-related stocks. There is so much bearishness and skepticism about the holding power of consumers that this field seems ripe for contrarian plays. If retail turns a corner here, then the stock market will get a glide path to overbought trading.
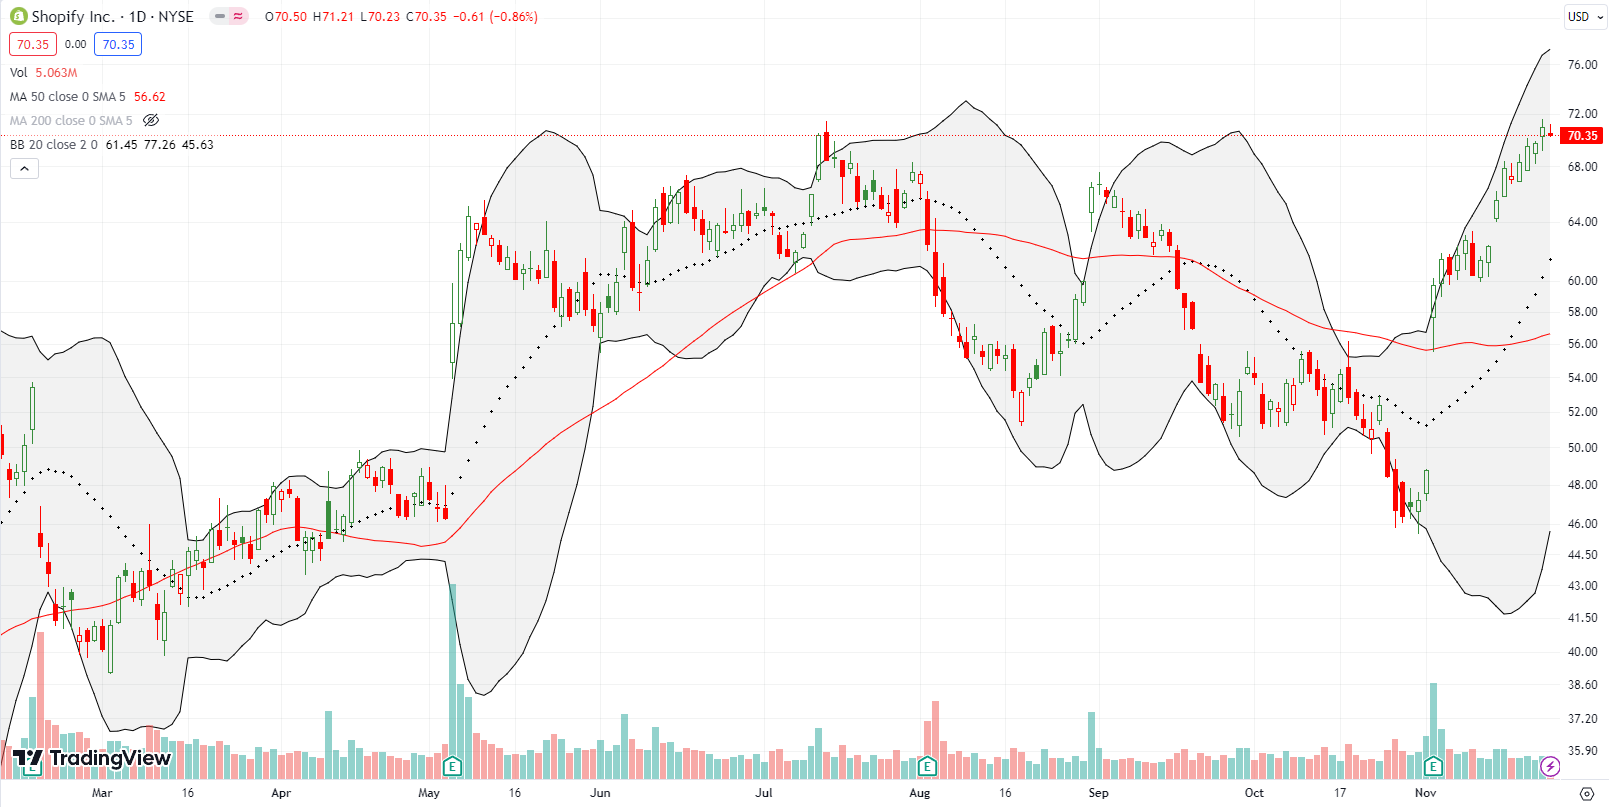
Shopify Inc (SHOP) is not a contrarian play, but it is of great interest trading at its high of the year…not to mention its very name aligns with the retail theme. SHOP has been strong since a 22.4% post-earnings gain generated a bullish 50DMA breakout. All month long SHOP has pushed and nudged higher. SHOP closed the week right at its high for the year, so I am a buyer on the next close higher. Technically, I should have bought SHOP when the stock gapped higher after its first post-earnings consolidation period.
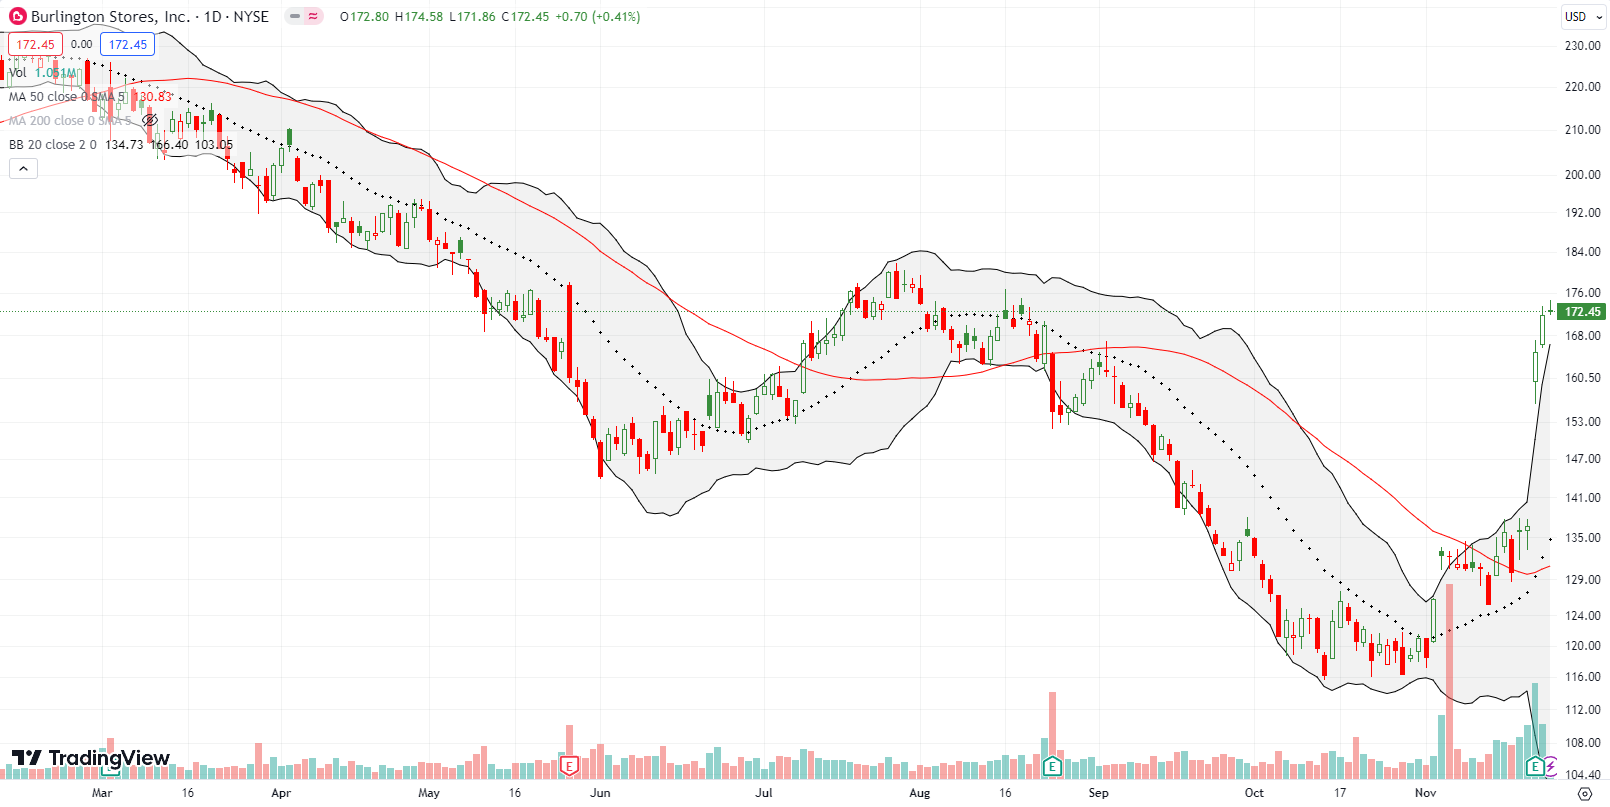
Big box retailer Burlington Stores, Inc (BURL) peaked at an all-time high in August, 2021. BURL went into 2023 with a sharp rebound off major lows. However, sellers took over again after February. Still, BURL went into November earnings with a confirmed 50DMA breakout and an uptrending 20-day moving average (DMA) (the dotted line). A 20.7% post-earnings surge confirmed a change in sentiment on BURL. Buyers have even held BURL in a stretched position above its upper Bollinger Band (BB). I expect an eventual pullback, especially with BURL at resistance from the previous highs. I am a buyer on an “orderly” pullback, maybe to the post-earnings opening price.
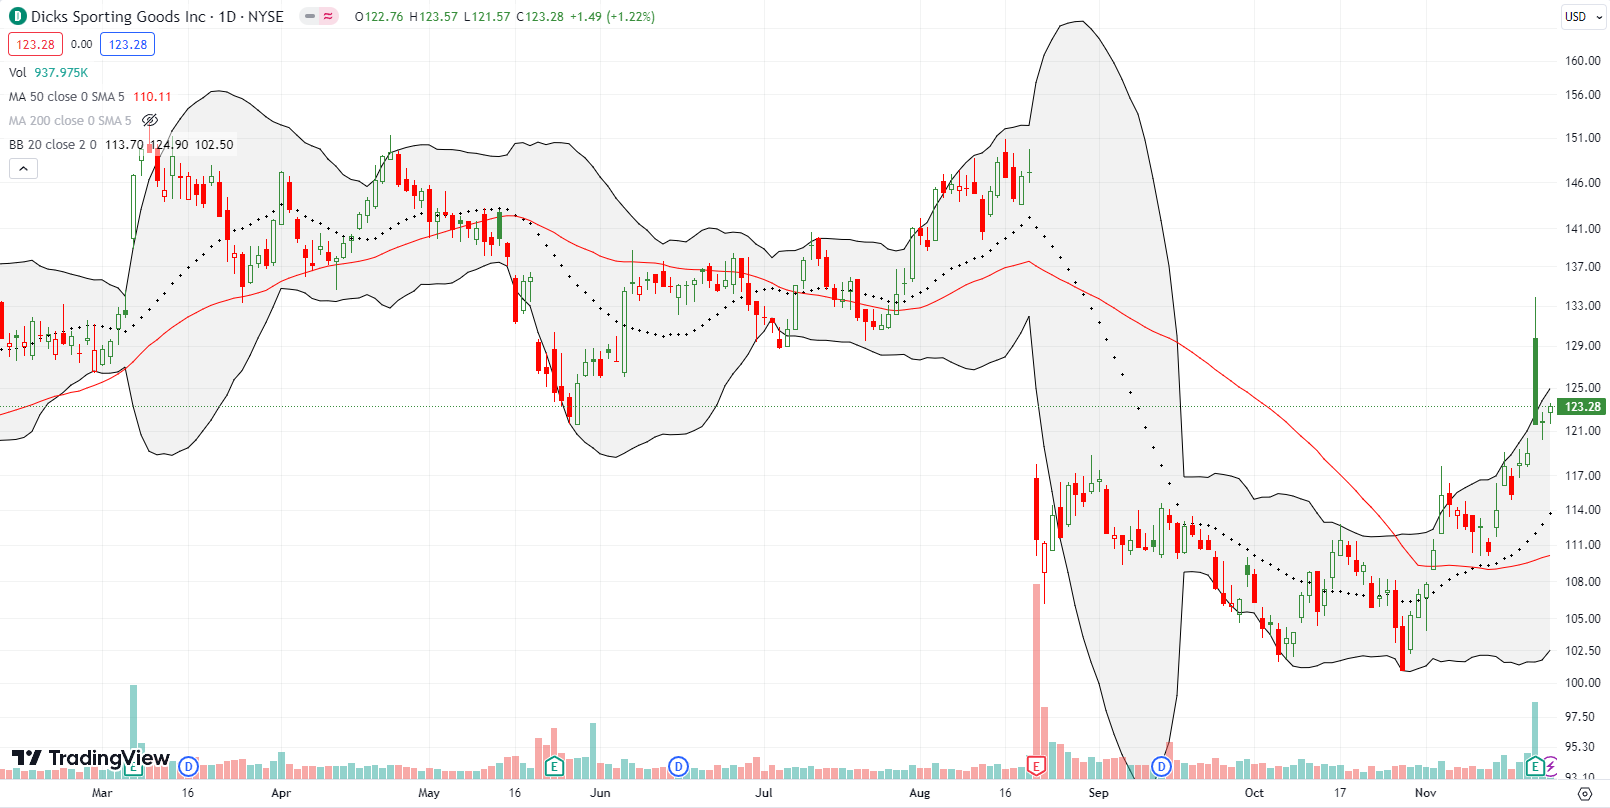
I bought a speculative calendar call spread at the $130 strike going into earnings for Dicks Sporting Goods Inc (DKS). The options looked “cheap.” So I was elated when the stock opened up 9.0% right to the strike. I was then amazed that buyers kept taking DKS higher. Finally, I was startled as sellers drove DKS to a mere 2.2% close on the day. In the middle, I was able to snatch a profit from my position as the short side of the spread decayed rapidly. DKS has now set up a bullish “calm after the storm” candlestick chart pattern. I am a buyer on Monday and should have bought on Friday. DKS could be turning the corner on a mission to reverse August’s post-earnings collapse.
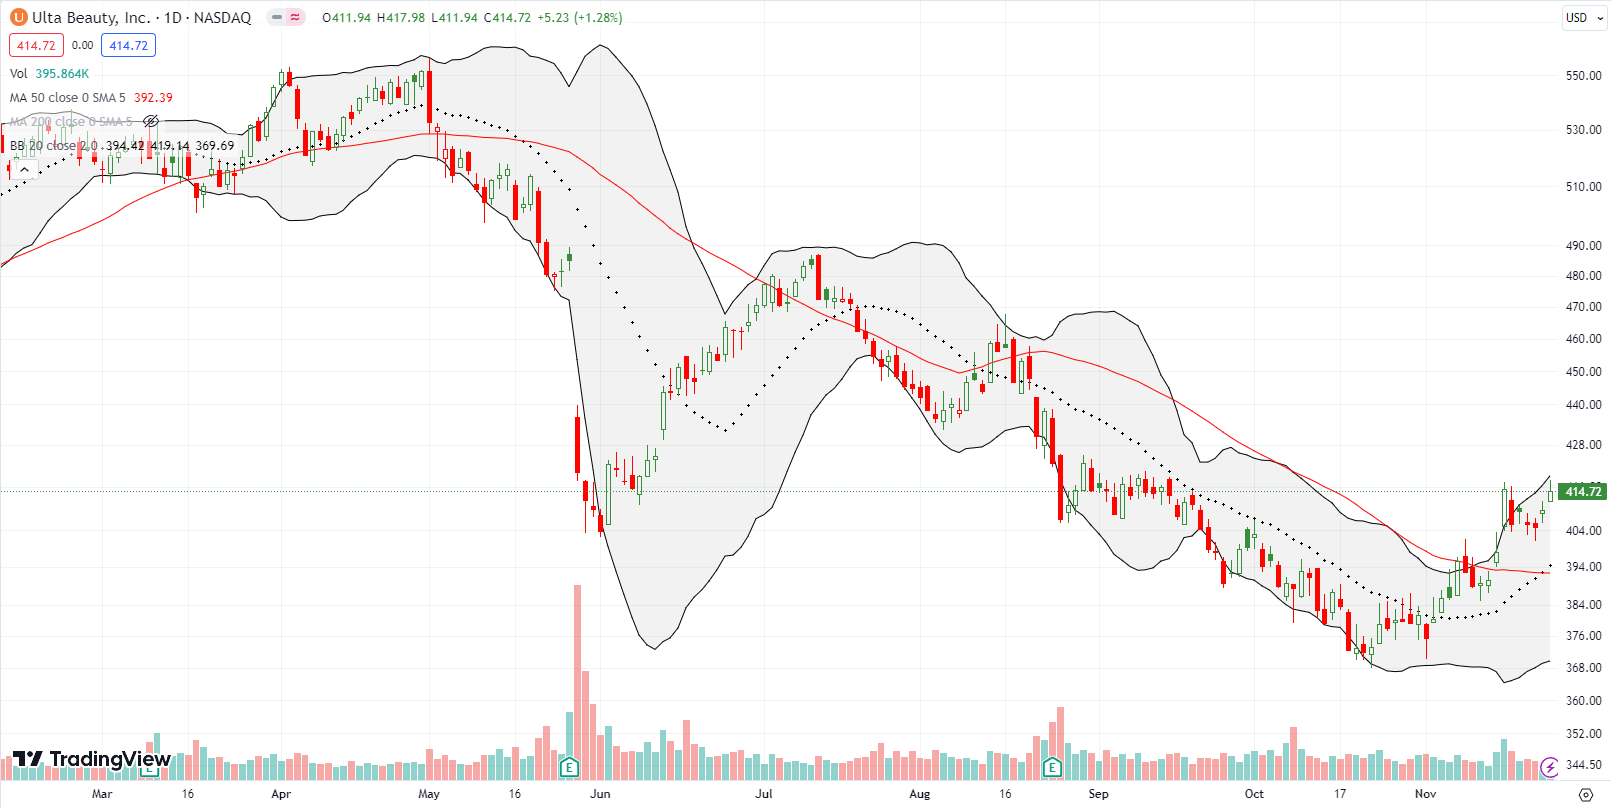
Ulta Beauty, Inc (ULTA) looks like it is turning the corner after selling off most of the year. In mid November ULTA confirmed a 50DMA breakout, but the stock has yet to make further progress. Earnings are coming November 30th, so this juncture is critical for the stock. I will be looking to speculate on a calendar call spread ahead of earnings with the assumption that ULTA is on the rise again.
ULTA has been a favorite of beauty influencers, so I took interest in this story from Marketplace about Queen Nefertiti as the “original” beauty influencer.
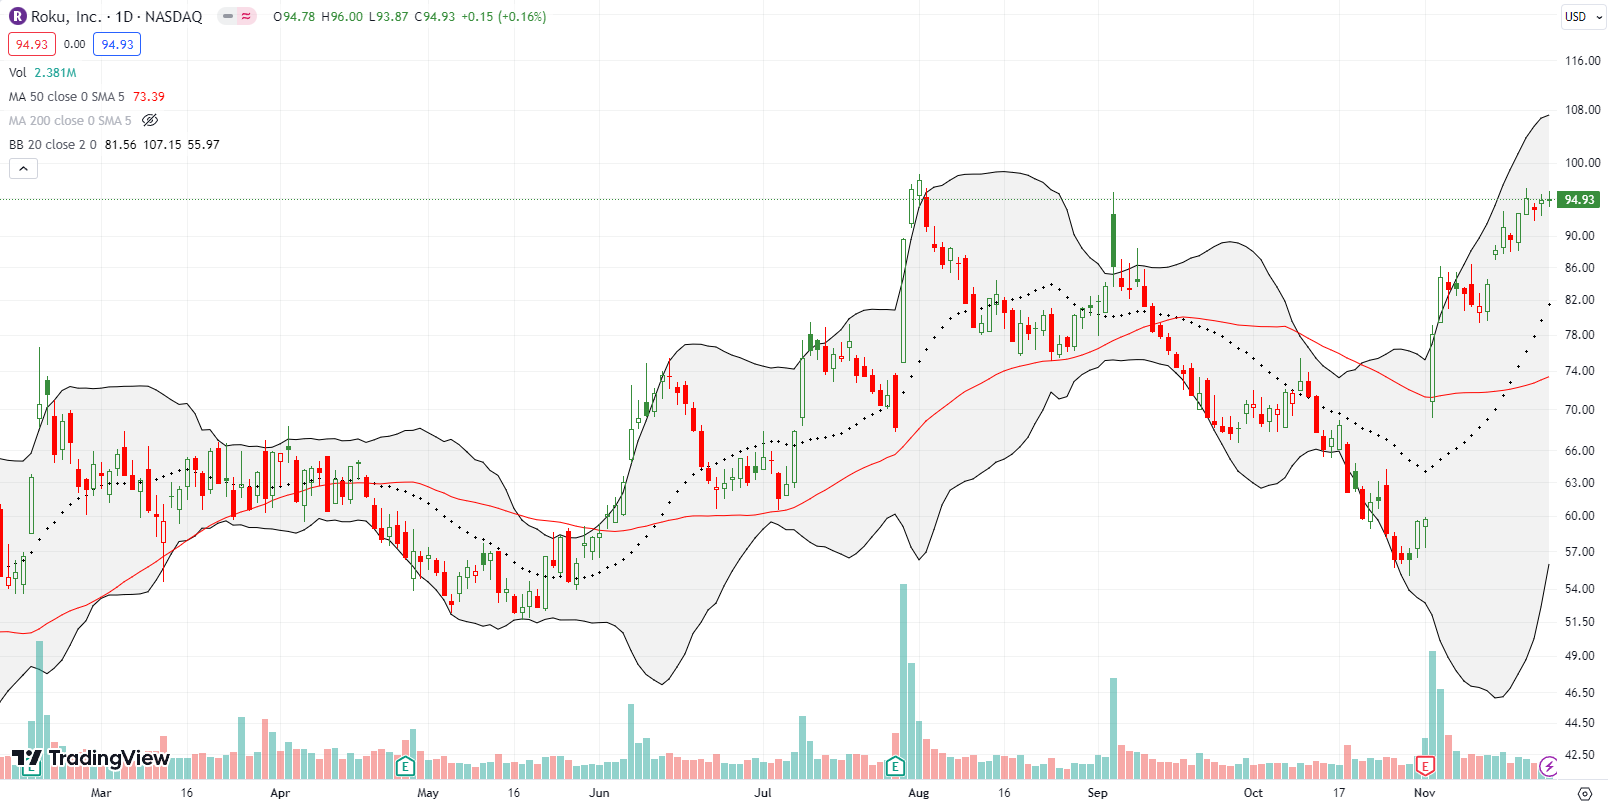
I have long been skeptical of Roku, Inc (ROKU) because of its valuation. The valuation is now much more reasonable‘ and the stock has had some of its signature bursts of excitement. I flagged ROKU for a buy in mid November but somehow missed my entry point after a nice breakout on November 14th. With the stock closing above its September gap and crap, the next entry point is here. ROKU is on the edge of a new high for the year; I will be a buyer at that point. Otherwise, I will look for a buy on a pullback that fills in the last gap up.
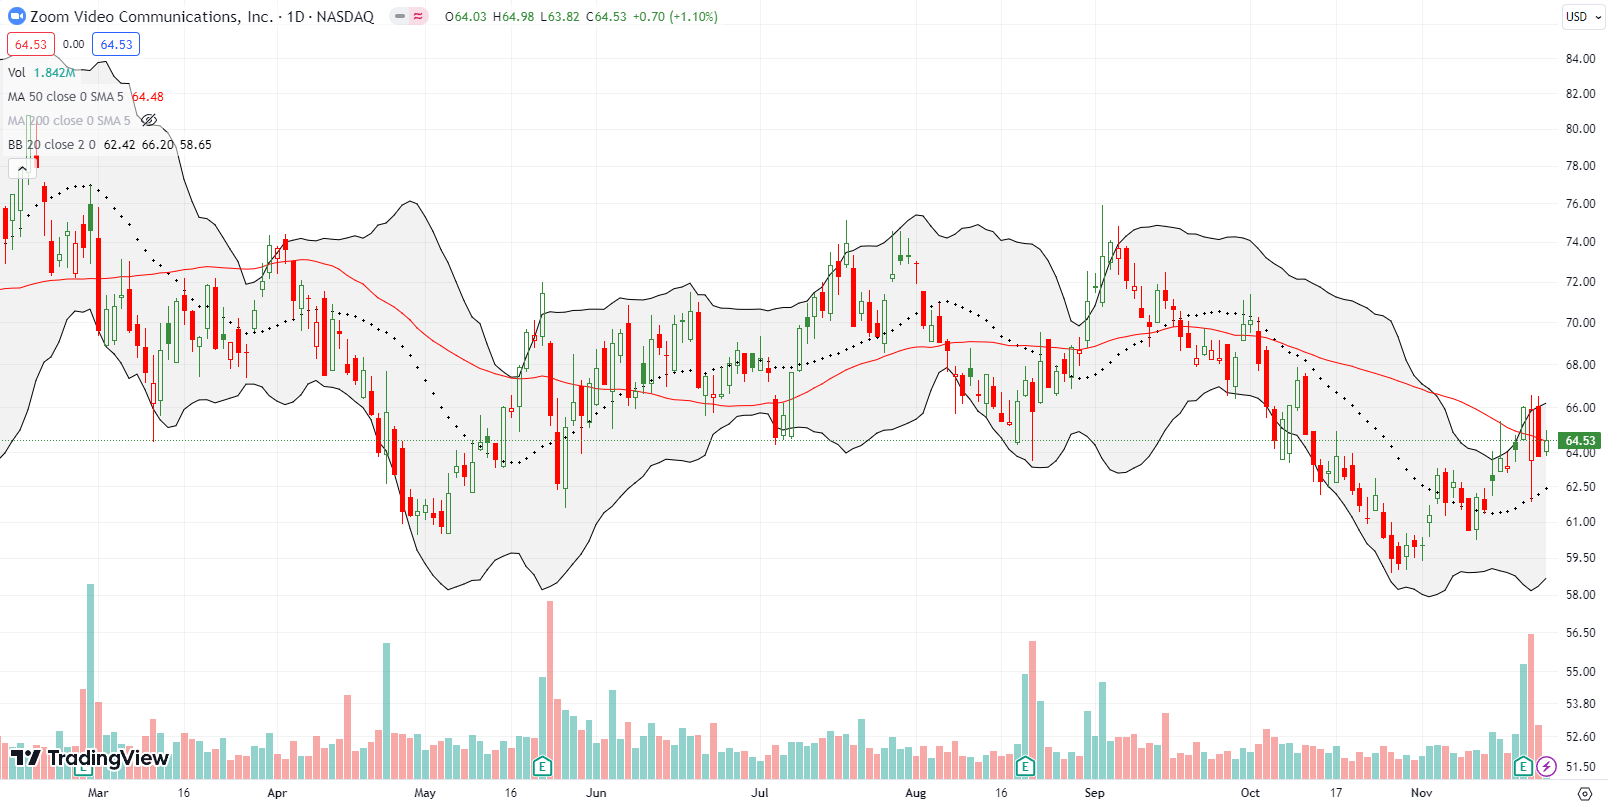
I keep waiting for a comeback for Zoom Video Communications, Inc (ZM) that never quite appears. I bought a diagonal calendar call spread ahead of last week’s earnings. I thought I was good with a 3% gain in after hours to $70. However, ZM gapped down at its open and took away my opportunity for a quick profit. While buyers closed ZM near flat, sellers descended again the next day. With the short side of the spread expired, I am still hopeful that ZM can release its 50DMA pivot and launch higher.
ZM has plenty of competitive challenges. Accordingly, the stock is also priced “cheaply” at 14x forward earnings and 4.4x sales. At some point, I think ZM will make a run on the tailwinds of some good news.
Be careful out there!
Footnotes
Subscribe for free to get email notifications of future posts!
“Above the 50” (AT50) uses the percentage of stocks trading above their respective 50-day moving averages (DMAs) to measure breadth in the stock market. Breadth defines the distribution of participation in a rally or sell-off. As a result, AT50 identifies extremes in market sentiment that are likely to reverse. Above the 50 is my alternative name for “MMFI” which is a symbol TradingView.com and other chart vendors use for this breadth indicator. Learn more about AT50 on my Market Breadth Resource Page. AT200, or MMTH, measures the percentage of stocks trading above their respective 200DMAs.
Active AT50 (MMFI) periods: Day #13 over 20%, Day #11 over 30%, Day #9 over 40%, Day #8 over 50%, Day #5 over 60%, Day #75 under 70%
Source for charts unless otherwise noted: TradingView.com
Full disclosure: long ZM call, ,
FOLLOW Dr. Duru’s commentary on financial markets via StockTwits, Twitter, and even Instagram!
*Charting notes: Stock prices are not adjusted for dividends. Candlestick charts use hollow bodies: open candles indicate a close higher than the open, filled candles indicate an open higher than the close.


