Stock Market Commentary:
The last bullish run in the stock market came to an abrupt end. The day started on a positive note, but trading went awry after a mix of relatively unsurprising economic news releases and Fedspeak. News that the Justice Department would announce an international enforcement action against a cryptocurrency entity seemed to symbolize the market’s mood flip. Cryptocurrencies like Bitcoin (BTC/USD) suddenly and sharply pulled back and seemed to take down all the risk-takers in the financial markets. The parallel topping in prices and subsequent descents were almost uncanny. After the dust settled, overbought trading conditions ended with key breakdowns and reversals.
The Stock Market Indices
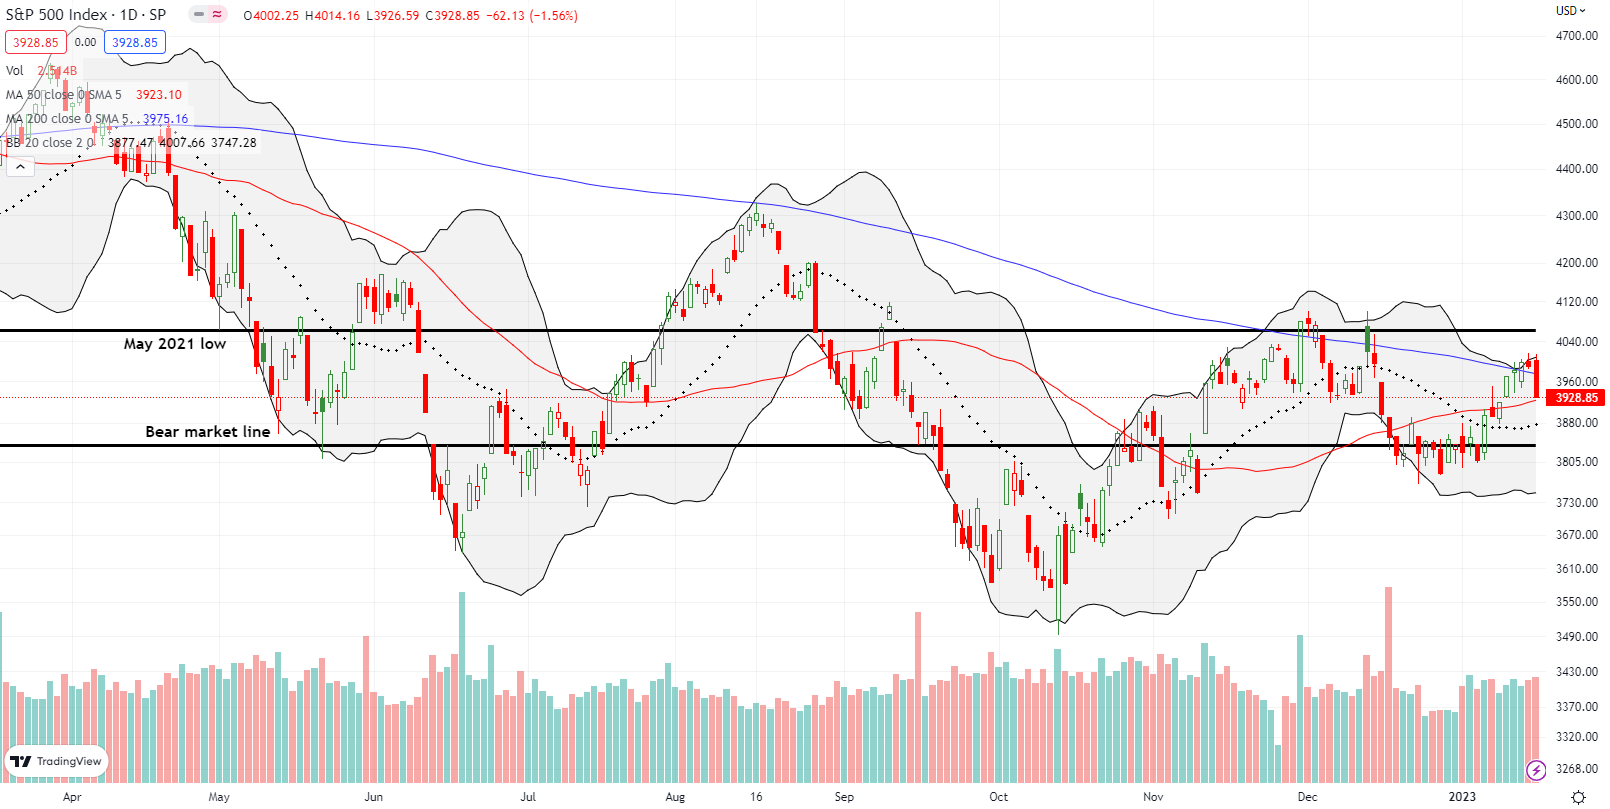
The S&P 500 (SPY) wiped out all its post-CPI gains with today’s 1.6% loss and breakdown below its 200-day moving average (DMA) (blue line below). This bearish move was too little too late to save my CPI trade. Now, buyers face an immediate test at the 50-day moving average (DMA) (red line). Last month’s 50DMA test did not have the benefit of an uptrending 20DMA (dashed line) for additional support. Accordingly, I suspect that the S&P 500 will not retest its bear market line for this pullback. However, if the index DOES make it down that far in the short-term, I will next anticipate a key bearish failure. That consolidation period around the bear market line would fail to hold support and then put the October lows back in play.
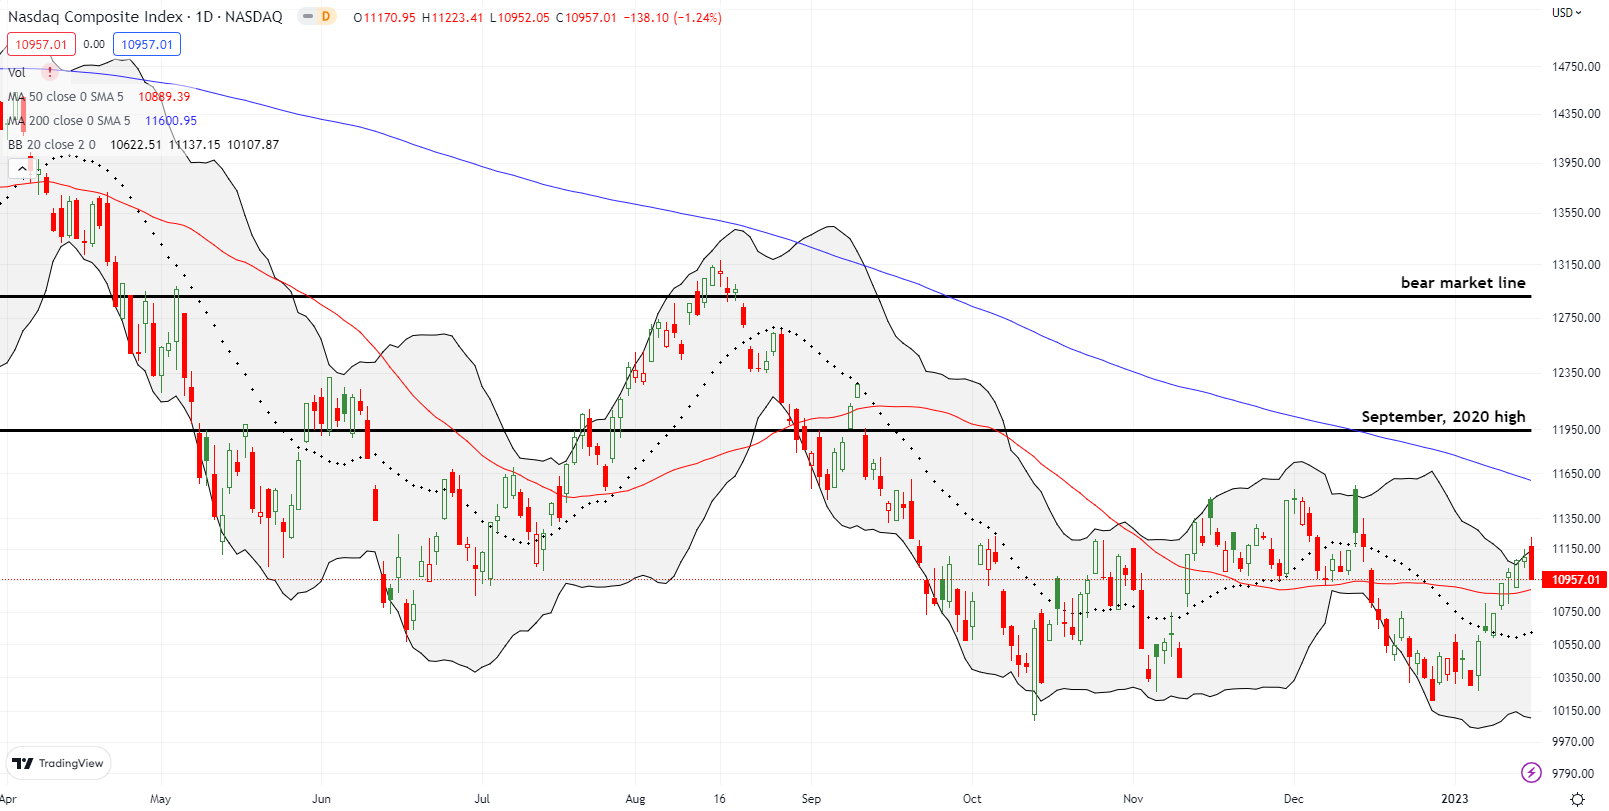
The NASDAQ (COMPQ) is also testing its 50DMA support. A 1.2% drop took the tech-laden index within a hair of support. I am much less confident that the NASDAQ’s 20DMA support can provide sufficient buffer to prevent yet one more test of the October, and now December, lows.
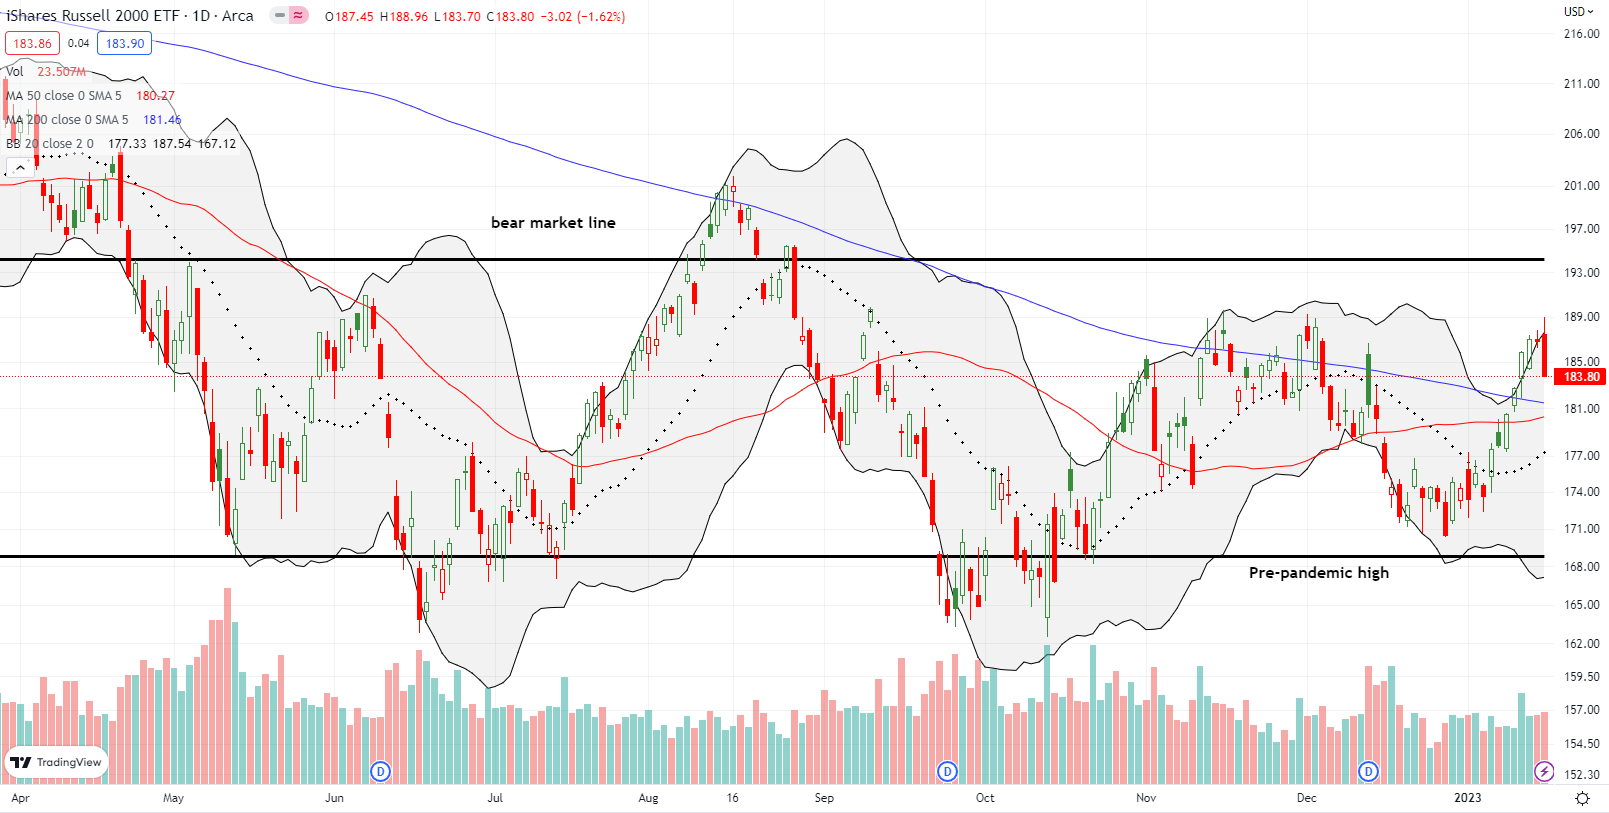
The technical failure for the iShares Russell 2000 ETF (IWM) looks the most distinctive of the major indices. The ETF of small caps rushed right into the resistance of the November and December highs and suffered a sharp rejection. The day’s 1.6% loss put the converging support from all three major moving averages into play.
Stock Market Volatility
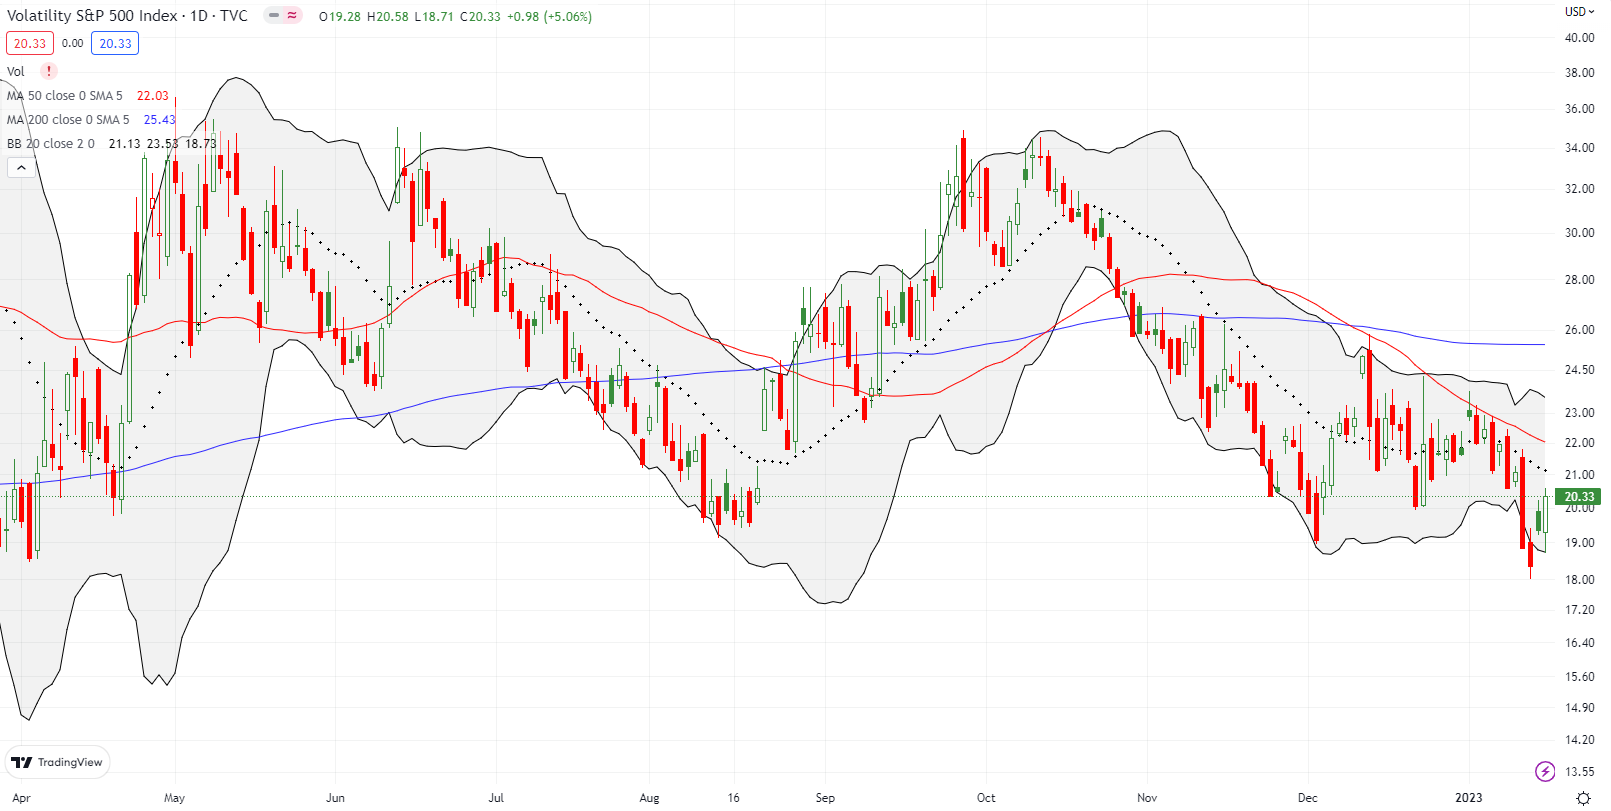
The volatility index (VIX) provided an early warning yesterday with a jump back to the key 20 level. Faders dutifully rejected the VIX at that point. However, the faders failed to appear today. The VIX brought its bullish signal to a quick end. Note that the downtrend from the VIX’s 50DMA remains intact.
The Short-Term Trading Call With Overbought and a Bullish Case
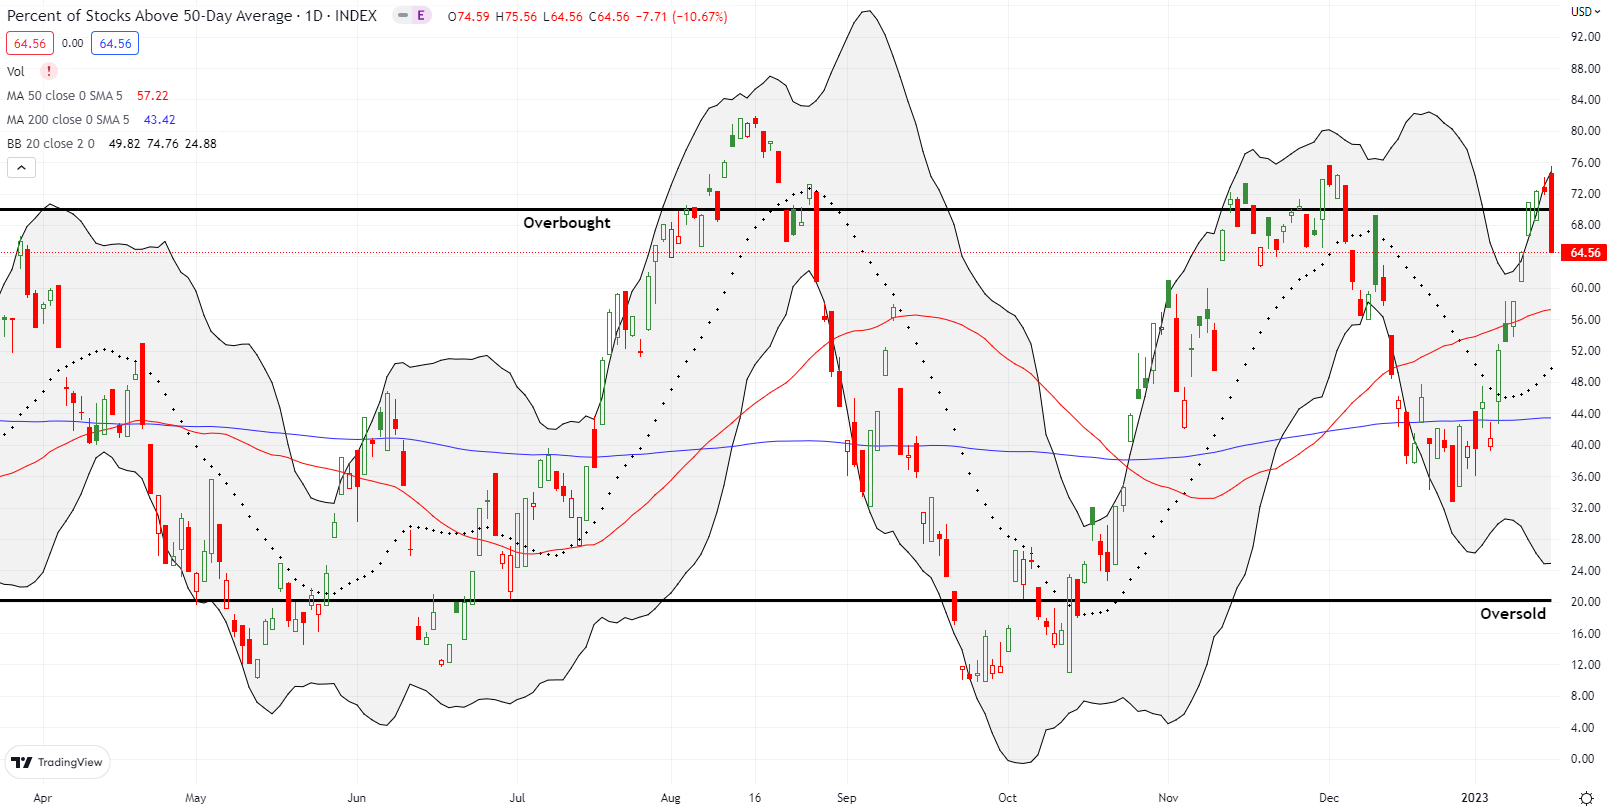
- AT50 (MMFI) = 64.6% of stocks are trading above their respective 50-day moving averages (ended 3 days overbought)
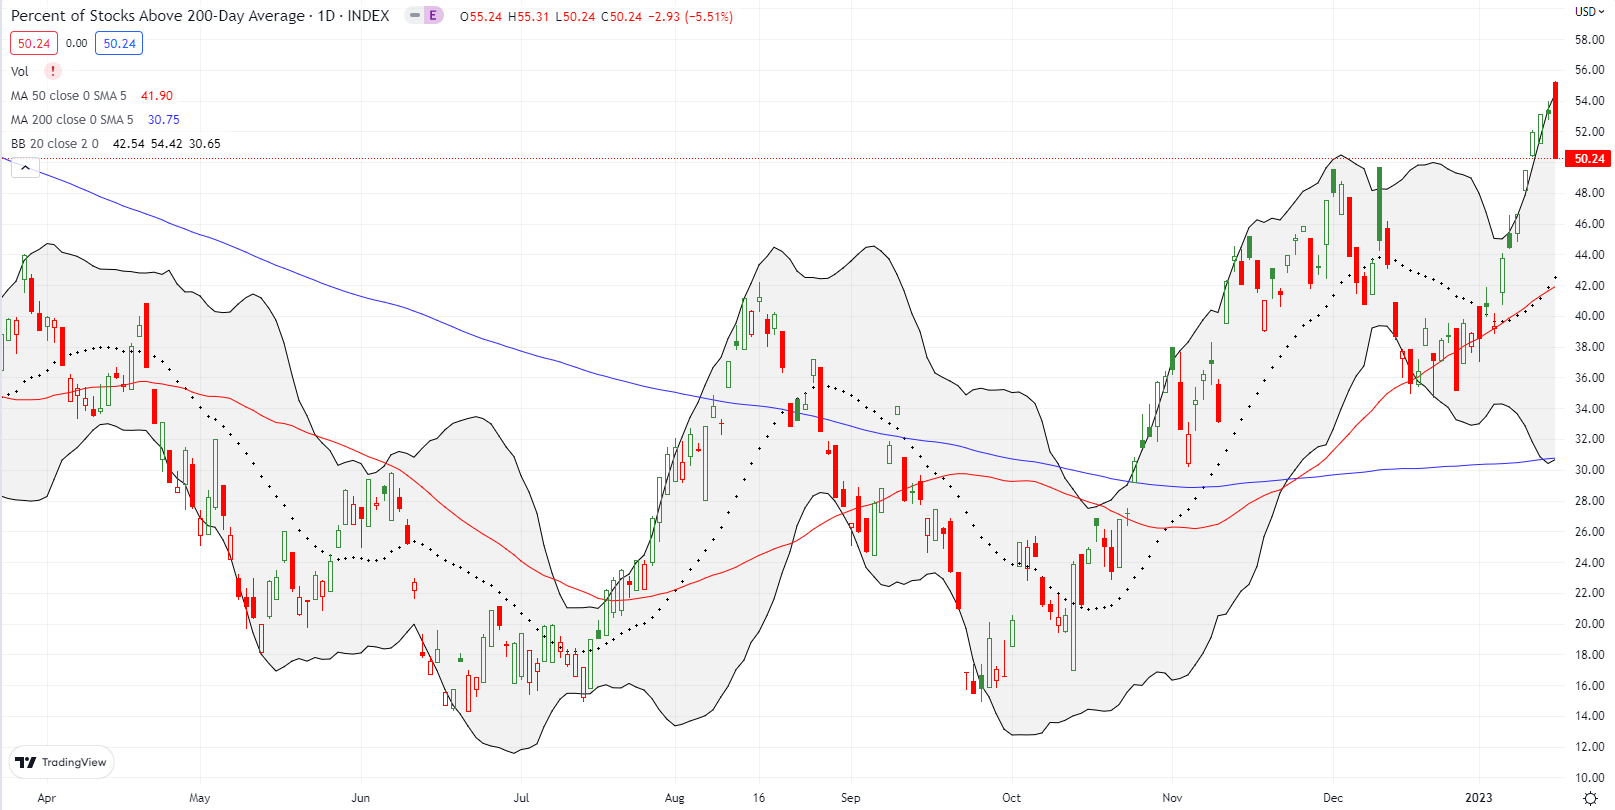
- AT200 (MMTH) = 50.2% of stocks are trading above their respective 200-day moving averages
- Short-term Trading Call: neutral (one down day away from cautiously bearish)
AT50 (MMFI), the percentage of stocks trading above their respective 50DMAs, abruptly ended a 3-day stay in overbought territory. The stock market quickly transitioned from the edge of bullishness to the edge of bearishness. A lower close for AT50 will flip me right back to cautiously bearish. Such a change in the short-term trading call should be supported by a confirmed 200DMA breakdown on the S&P 500 and a 50DMA breakdown on the NASDAQ. With these triggering conditions, I will stay bearish unless the S&P 500 clears its November/December highs.
Panning back from the market shows that the S&P 500 has essentially churned in a wide range since April of last year. Accordingly, I see no reason to get dramatically bearish or bullish until this range gives way. Of course, the path to dramatic bearishness would first involve oversold conditions which would force me to get short-term bullish for a spell.
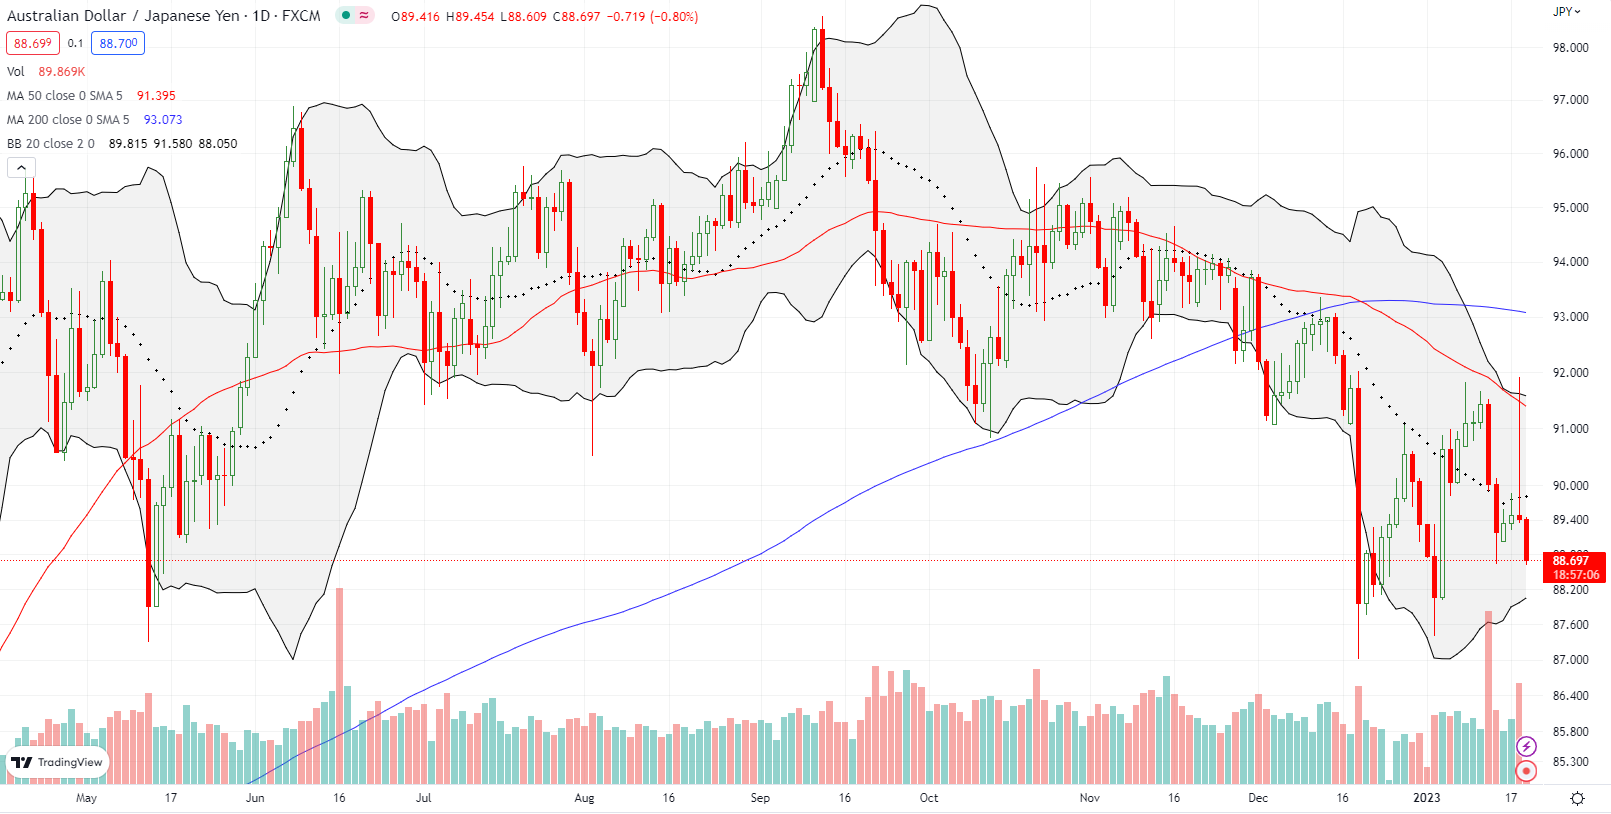
Monetary policy from the Bank of Japan (BoJ) threw the Australian dollar vs the Japanese yen (AUD/JPY) for a loop. The BoJ stood pat on its accommodative policy and sent yen bulls scrambling to sell. That frenzy ended as suddenly as it started as yen pairs like AUD/JPY hit key resistance levels. At the time of writing AUD/JPY is already headed back to recent lows…which in turn warns of more selling pressure in the stock market. The post BoJ surge took out my profit target on my long AUD/JPY position. I rolled right back into a fresh position on this pullback. The extreme choppy behavior in AUD/JPY suggests that the best bets run counter to the most recent big move. I am of course wary of persistent and downtrending 50DMA resistance.
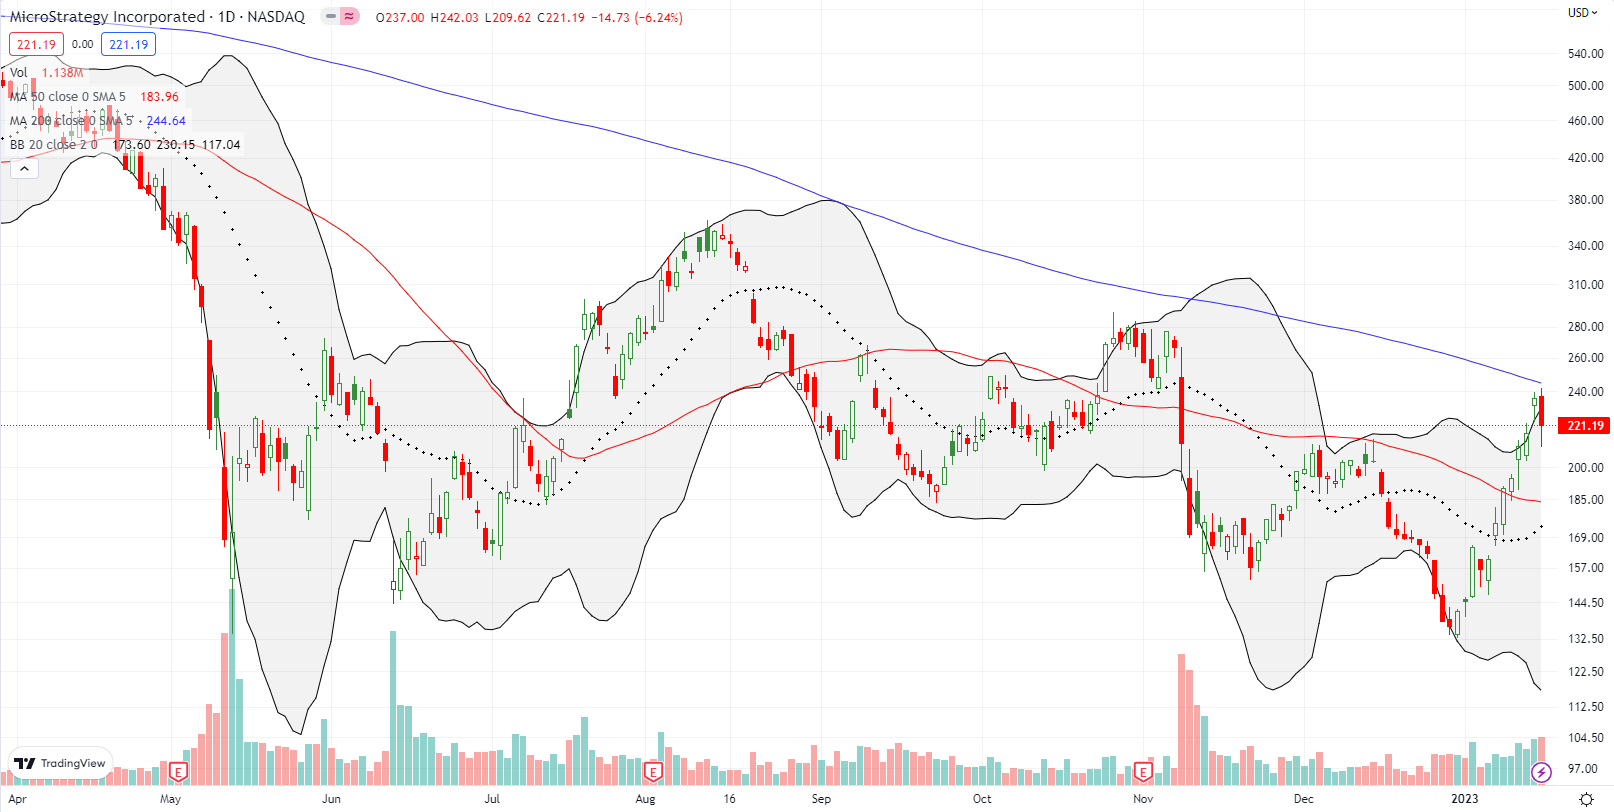
Microstrategy Incorporated (MSTR) was hit by the sell-off in Bitcoin given the company’s coffers are overflowing with Bitcoin. It was as if the DoJ timed its news right at important resistance. Bitcoin failed right after reversing its FTX losses. At the same time, MSTR failed perfectly at downtrending 200DMA resistance. I did not wait for a confirmation move and jumped right into a Feb $180/$165 put spread. MSTR is down 83% from its all-time high set in February, 2021, but…
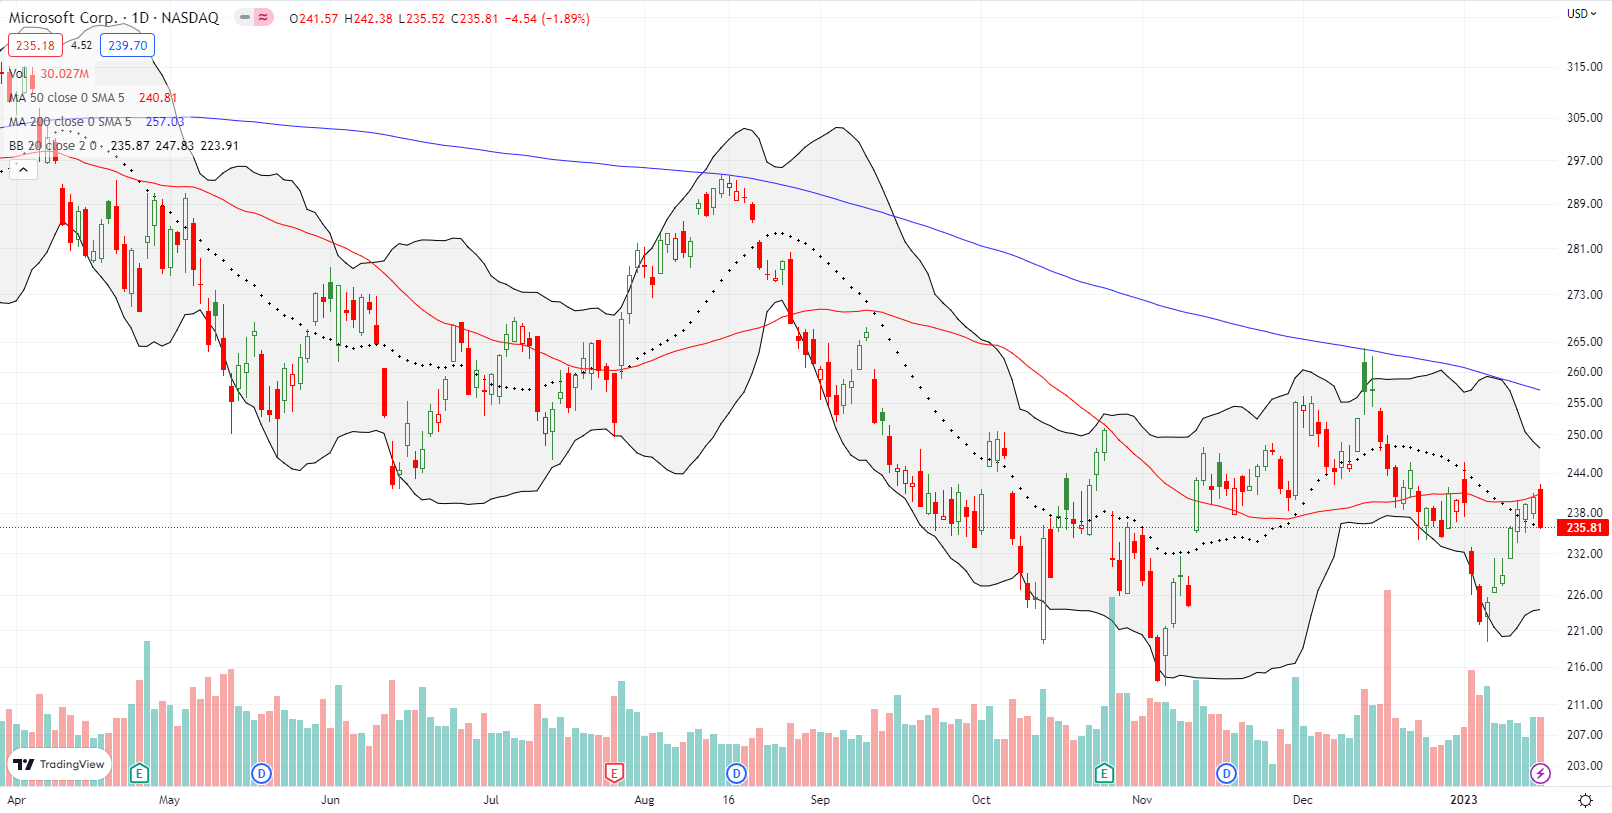
Microsoft Corp (MSFT) added its own ominous technical signal by perfectly failing at 50DMA resistance. This failure coincides with a gap fill from Microsoft’s earnings warning that caused the last 50DMA failure. Earnings next week should be “interesting.”
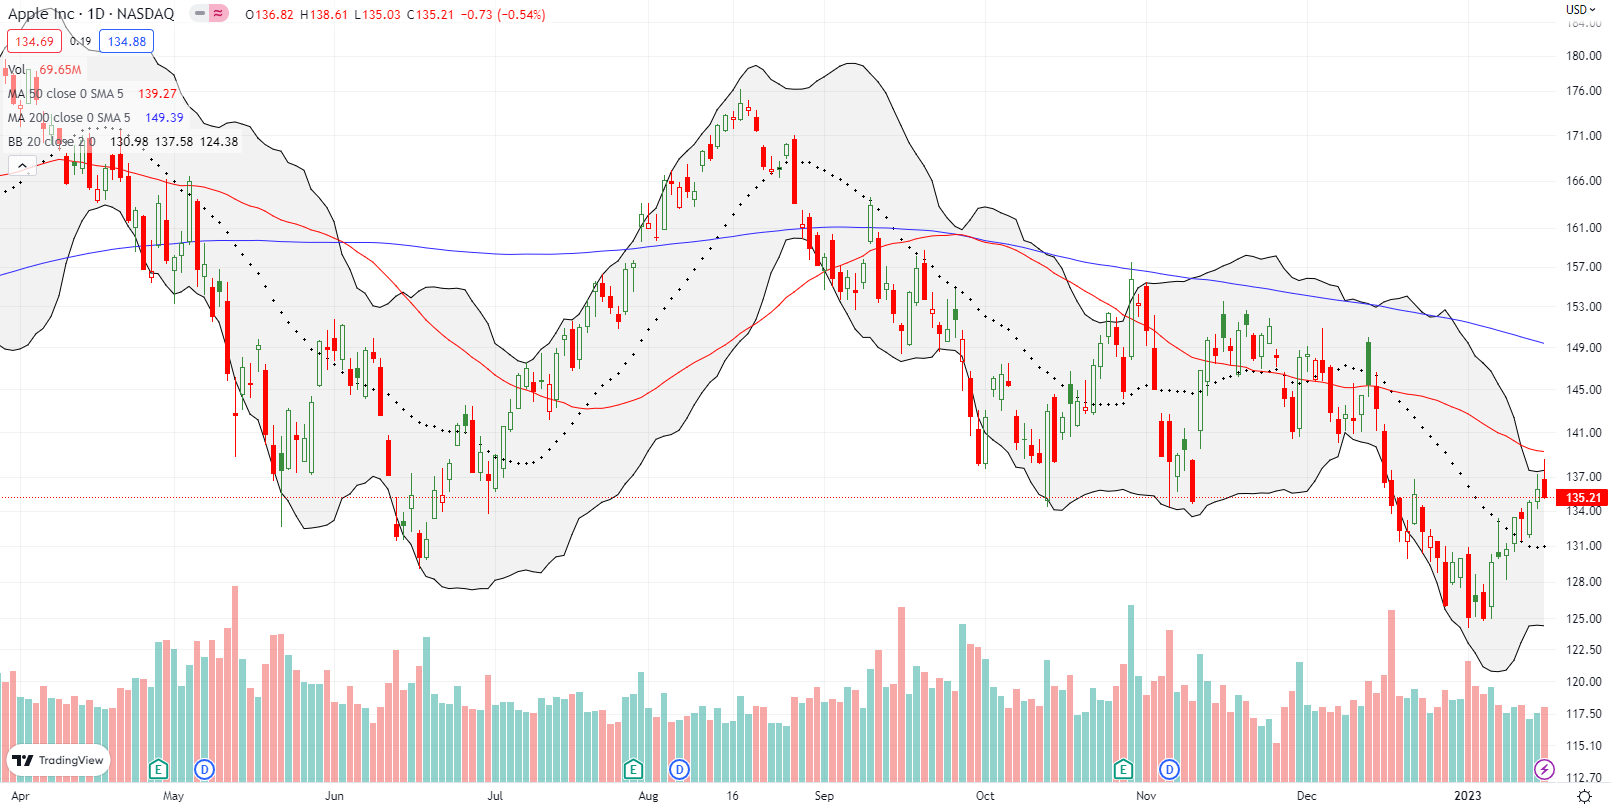
Apple Inc (AAPL) also created a key technical failure. The stock almost reached 50DMA resistance just as faders rushed in. AAPL’s failure underlined MSFT’s failure and combined these heavyweights are learning heavily against the NASDAQ and the S&P 500.
Footnotes
“Above the 50” (AT50) uses the percentage of stocks trading above their respective 50-day moving averages (DMAs) to measure breadth in the stock market. Breadth defines the distribution of participation in a rally or sell-off. As a result, AT50 identifies extremes in market sentiment that are likely to reverse. Above the 50 is my alternative name for “MMFI” which is a symbol TradingView.com and other chart vendors use for this breadth indicator. Learn more about AT50 on my Market Breadth Resource Page. AT200, or MMTH, measures the percentage of stocks trading above their respective 200DMAs.
Active AT50 (MMFI) periods: Day #65 over 20%, Day #61 over 30%, Day #10 over 40%, Day #8 over 50%, Day #5 over 60% (overperiod), Day #1 under 70% (underperiod ending 3 days overbought)
Source for charts unless otherwise noted: TradingView.com
Full disclosure: long QQQ put spread, long MSTR put spread, long AUD/JPY
FOLLOW Dr. Duru’s commentary on financial markets via StockTwits, Twitter, and even Instagram!
*Charting notes: Stock prices are not adjusted for dividends. Candlestick charts use hollow bodies: open candles indicate a close higher than the open, filled candles indicate an open higher than the close.


