Housing Market Intro and Summary
In my last Housing Market Review, I called the housing slowdown a “reality check.” That reality is settling into all corners of the market. With mortgage rates resuming their surge over the past two months, the go-forward picture has dimmed further for the housing market. It seems likely the housing market may go into a kind of hibernation waiting out the rate cycle: sellers unwilling to move and lose low-rate mortgages combined with buyers unwilling to pay prices made higher by higher rates. Home builders will be caught in the middle with a need to move inventory and generate cash flow.
These dynamics promise to throw my seasonal trade on home builders for a loop. With one eye on oversold trading conditions, I am waiting out the rate cycle as late into November as I can.
Housing Stocks
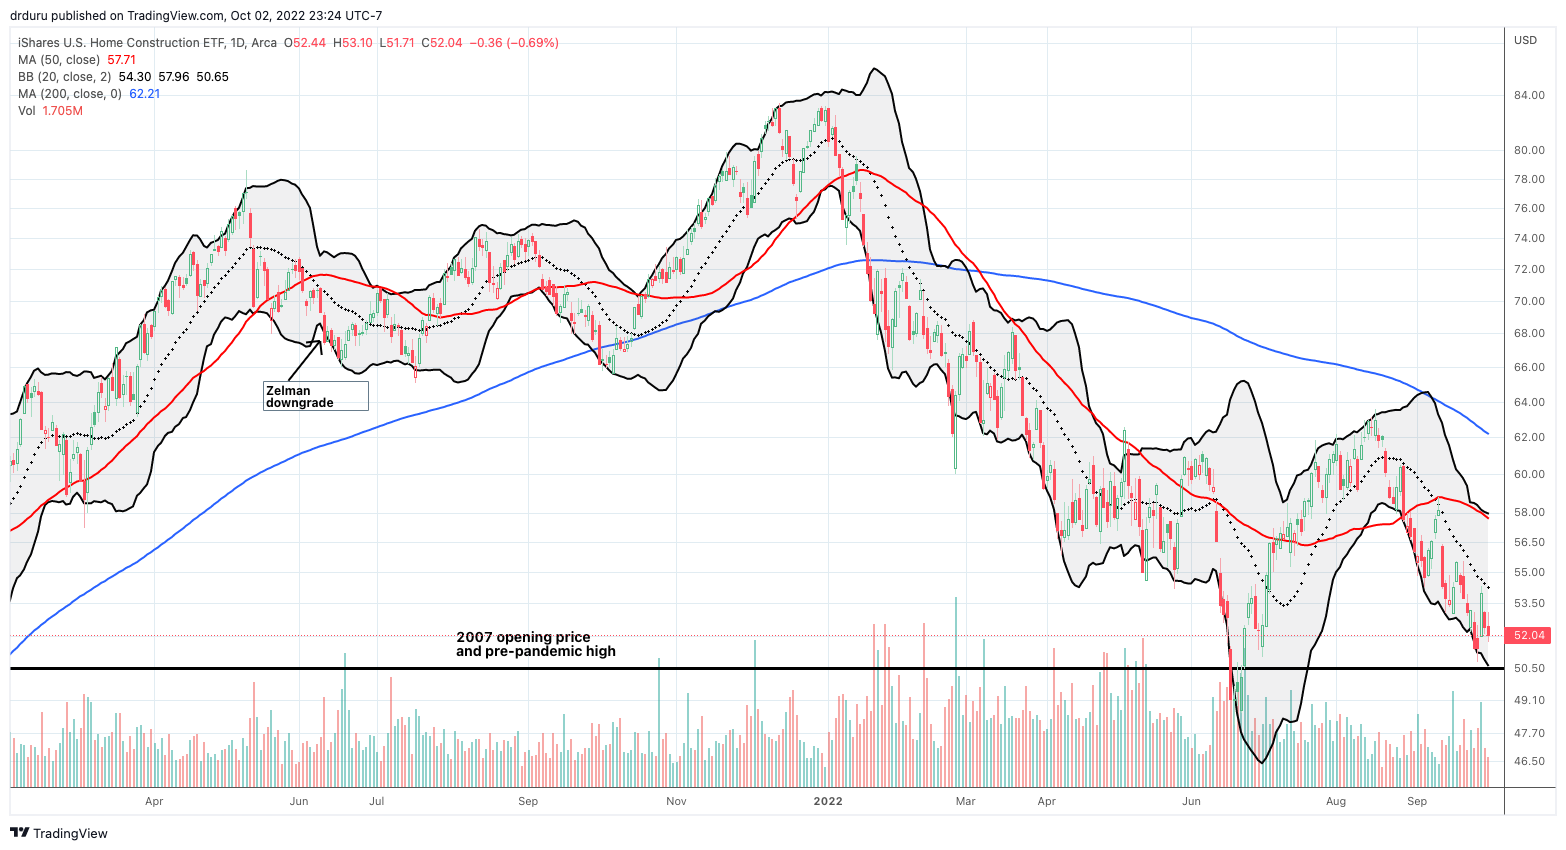
The iShares US Home Construction ETF (ITB) surprised me by breaking out to multi-month highs in August. The bullish move was indeed too good to be true. ITB reversed before even testing its 200-day moving average (DMA) (the blue line below). The subsequent selling followed the 20DMA (the dotted line) downward into a retest of ITB’s pre-pandemic high. Given prospects for the housing market look worse than they looked in June, I am not expecting ITB’s sell-off to bottom out here…at least not without a new reversal in mortgage rates.

Housing Data
New Residential Construction (Single-Family Housing Starts) – August, 2022
The near year-long sequential decline in housing starts took a small respite in August. Starts increased 3.4% month-over-month. Starts decreased 14.6% year-over-year. July’s starts were revised downward from 916,000 to 904,000. While August’s increase looks like a blip on the chart, it slightly increases the odds of holding the floor on starts at 800K and staying within a range during this housing downturn.
![Housing starts Source: US. Bureau of the Census, Privately Owned Housing Starts: 1-Unit Structures [HOUST1F], first retrieved from FRED, Federal Reserve Bank of St. Louis, October 2, 2022.](https://drduru.com/onetwentytwo/wp-content/uploads/2022/10/221002_Housing-Starts.png)
The West was the only region where starts increased year-over-year (surprising given the on-going plunge in sentiment in the West). The Northeast was the only region to suffer a month-over-month decline. Housing starts in the Northeast, Midwest, South, and West each changed -18.5%, -6.2%, -21.9%, and +2.3% respectively year-over-year.
Existing Home Sales – August, 2022
For the July report, the National Association of Realtors (NAR) declared a recession for the housing market. However, while overall sales continue to decline, the squeeze on inventories continues and selling prices for the remaining sales remain high.
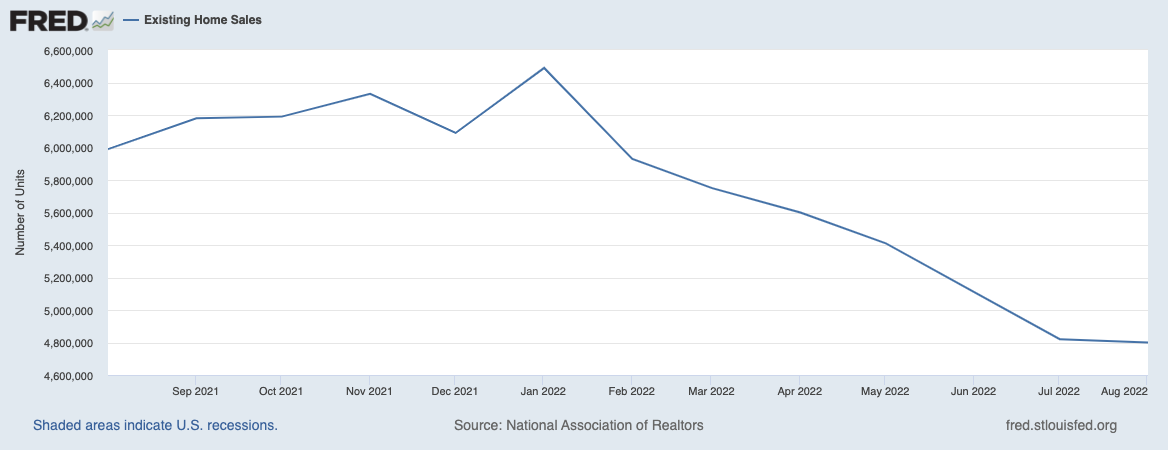
Existing home sales dropped for a seventh month in a row although the pace slowed significantly. The seasonally adjusted annualized sales in August of 4.80M decreased 0.4% month-over-month from the slightly upwardly revised 4.92M in existing sales for July. Year-over-year sales decreased 19.9%. Sales remain below the pre-pandemic existing home sales activity between 5.0M to 5.5M in 2019 and 2018. Sales were last this low in 2014 excluding the pandemic-driven crash.
(For historical data from 1999 to 2014, click here. For historical data from 2014 to 2018, click here) Source for chart: National Association of Realtors, Existing Home Sales© [EXHOSLUSM495S], retrieved from FRED, Federal Reserve Bank of St. Louis, October 2, 2022.

August’s absolute inventory level of 1.28M homes decreased 1.5% from July. This decline ended six straight months of inventory increases. The inventory streak was steep enough to push inventory up year-over-year for the first time in 38 months. Inventory stayed flat year-over-year in July and August. According to the NAR, “unsold inventory sits at a 3.2-month supply at the current sales pace – identical to July and up from 2.6 months in August 2021.” The on-going tightness in inventory contrasts with the notion of a full-blown housing recession. The NAR expects inventories to remain tight for some time to come: “Inventory will remain tight in the coming months and even for the next couple of years…Some homeowners are unwilling to trade up or trade down after locking in historically-low mortgage rates in recent years…”
Despite the drop in inventories, the time it takes for buyers to take a home off the market actually increased. The average 16 days it took to sell a home in August was two above the 14 days in July yet still down from 17 days a year ago. Recall that the 14-day turnover was a record low since measurements began in 2011. Moreover, the 81% of homes that sold within one month is just one percentage point down from July’s share. This rapid turnover continues to demonstrate the strength of market demand among those who can still afford a home.
Still, prices continue to creep sequentially downward. The median price of an existing home decreased 2.4% month-over-month to $389,500 and jumped 7.7% year-over-year. Prices have increased year-over-year for 126 straight months, an on-going record streak.
The sequential decline did not stir incremental interest in first-time home buyers. Their share of sales stayed flat with July’s 29% and the same as this time a year ago. The NAR’s 2017 Profile of Home Buyers and Sellers reported an average of 34% for 2017, 33% for 2018, 33% for 2019, 31% for 2020, and 34% for 2021.
All regions declined significantly in sales year-over-year, especially the West for a third month in row. The regional year-over-year changes were: Northeast -13.7%, Midwest -15.9%, South -19.3%, West -29.0%. The Northeast and the West managed to increase sales slightly month-over-month, 1.6% and 1.1% respectively.
For the eleventh month in a row, the South’s median price soared year-over-year. The South has outpaced the other three regions 12 months in a row. I imagine the rush for more attractive and affordable housing in the South is continuing to apply the stronger price pressures. The regional year-over-year price gains were as follows: Northeast +1.5%, Midwest +6.6%, South +12.4%, West +7.1%.
Single-family home sales decreased 0.9% from July and declined on a yearly basis by 19.2%. The median price of $396,300 was up 7.6% year-over-year.
California Existing Home Sales – August, 2022
With existing home sales increasing in the West from July, California enjoyed a sizable 6.7% leap (while still a whopping 24.4% decline from a year ago). The California Association of Realtors (C.A.R.) attributed the boost to a “brief retreat” in high mortgage rates. This jump demonstrates the lingering strength in underlying housing demand. Moreover, if this attribution is accurate, then buyers were quite fortunate as mortgage rates proceed to soar all over again through September (see section below).
Bidding wars have now cooled down enough to send the the statewide sales-price-to-list-price ratio below 100.0% for the first time since June, 2020, the early months of the pandemic. This ratio was 102.8% a year ago. The median time to sell a home in California dramatically increased from 14 days in July to 19 days in August. The duration was a mere 9 days a year ago.
Increased demand pressured inventory a bit. While listings were up a whopping 57.1% year-over-year (compare to the yearly 64.4% increase in June), the statewide Unsold Inventory Index (UII) decreased to 2.9 months from 3.2 months in July.
C.A.R. reported that “existing, single-family home sales totaled 313,540 in August on a seasonally adjusted annualized rate, up 6.1 percent from July and down 24.4 percent from August 2021.” A change in mix back toward million-dollar plus homes helped drive an annual price increase of 0.7% from June and up 1.4% from a year ago. Normalized by square footage, the median selling price of an existing home in California increased 2.8% year-over-year.
New Residential Sales (Single-Family) – August, 2022
After plunging to levels last seen February, 2016, single-family new home sales delivered a surprising month-over-month surge above the lows of 2021. The strength sent a (temporary) hush across those breathlessly waiting for the housing market to collapse. If the rush of buying was motivated by August’s dip in rates, then September’s surge in rates likely sent new home sales plunging all over again.
August new home sales of 685,000 were up a whopping 28.8% from July’s 532,000 (revised up). Sales were also only down 0.1% year-over-year. This was the best yearly performance since February’s 2.8% gain. The jump above the 550,000 level dragged the market from a deeper slowdown for now.
![new home sales Source: US. Bureau of the Census, New One Family Houses Sold: United States [HSN1F], first retrieved from FRED, Federal Reserve Bank of St. Louis, October 2, 2022](https://drduru.com/onetwentytwo/wp-content/uploads/2022/10/221002_New-Home-Sales.png)
The $500,000 to $749,000 price tier lost a significant share of sales going from 32% to 21%. All other price tiers with measurable sales increased in share. The sizable decline helped take the median sales price off its July, 2022 record high with a 6.3% sequential decline.
The sales surge tightened inventory from 10.9 months of sales in July to 8.1 months in August. Given this tightening is likely temporary, I do not expect builders to suddenly pivot and rush to increase the pace of starts.
The sequential gain in sales was broad-based. No one region drove the surprise increase. The Northeast, Midwest, South, and the West gained 66.7%, 16.7%, 29.4%, and 27.5% respectively. The story was mixed on a year-over-year basis. The West got hit the hardest again. Northeast new home sales fell 21.9% year-over-year. The Midwest ended 10 straight months of significant declines with a 5.0% year-over-year gain. The South returned to out-performance with a 10.4% gain. The West dropped 24.0% and bounced slightly of its 8-year low.
![Regional new one family home sales Source: U.S. Census Bureau and U.S. Department of Housing and Urban Development, New One Family Houses Sold in South Census Region [HSN1FS], Midwest Census Region [HSN1FMW], Northeast Census Region [HSN1FNE], West Census Region [HSN1FW], retrieved from FRED, Federal Reserve Bank of St. Louis, May 1, 2022.](https://fred.stlouisfed.org/graph/fredgraph.png?g=UnM8)
Home Builder Confidence: The Housing Market Index – September, 2022
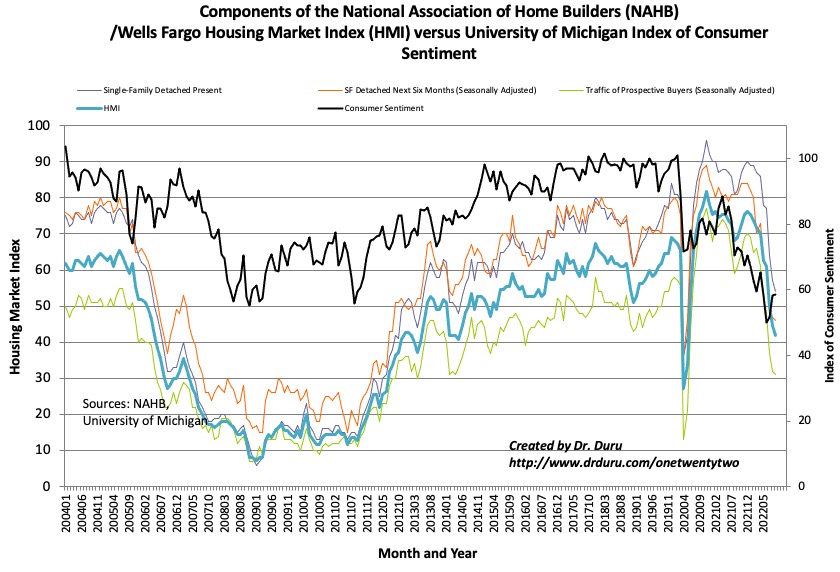
The Housing Market Index (HMI) dropped for the ninth straight month. August’s 49 reading transitioned to September’s 46. The freefall in sentiment continued apace albeit at a slower pace than the last 3 months. Fortunately, consumer confidence is still on the rebound with 2 straight months of improvement followed by September’s flat month-over-month reading. The Traffic of Prospective Buyers (Seasonally Adjusted) did not lead the way down this time; this HMI component is so low that further declines are likely to be relatively small. The Single-Family Detached Present led the way down this time around and validates my expectations that new home sales will resume their declines in September.

Source for data: NAHB and the University of Michigan
The declining market is motivating more and more builders to take pricing actions. The National Association of Home Builders (NAHB) reported that 24% of polled builders reduced home prices, an increase from 19% in August. Moreover, over 50% of surveyed builders used “incentives to bolster sales, including mortgage rate buydowns, free amenities and price reductions.”
The HMI fell stopped falling broadly across regions in September. The Northeast and Midwest remained flat with August’s revised readings of 48 and 42 respectively. The South fell from 55 to 52. The West took the biggest hit going from 42 to 34. I suspect the higher pricing in the West and its accompanying low affordability is creating additional downward pressure on sentiment. Sentiment in the West was last this low in June, 2012, right at the trough of the housing collapse from the financial crisis.
Home closing thoughts
Work-From-Home (WFH) Helped Drive Pandemic Era Demand
Shortly after the pandemic began, anecdotes abounded regarding households rushing to buy homes in cheaper or otherwise more desirable areas to take advantage of the flexibility of working-from-home. At the time, I found it odd that these buyers would make such fixed choices in the face of what could be a temporary remote work situation. Those bets appear to be paying off as WFH becomes a more sustained feature of the American workforce. The Federal Reserve Bank of San Francisco reported surveys indicating 30% of workers are still remote as of August, 2022. This share is up from 5% pre-pandemic.
This same SF Fed report, titled “Remote Work and Housing Demand“, also demonstrated how the shift to remote work helped drive price gains in the U.S. housing market. This clever study used the variations in share of remote work and changes in housing prices across three regions, or core-based statistical areas (CBSAs), to show a convincing correlation between price gains and share of remote work. Even when taking into account migration patterns, the study still revealed strong correlations. To the extent remote work is here to stay, higher home prices and rents will similarly prove sticky. Moreover, these recent buyers will not turn around and put their homes right back on the market (all else being equal).
Spotlight on Mortgage Rates
The promising peaking of mortgage rates in late June is now a mirage. As the Federal Reserve dug its hawkish heels into monetary policy, the 30-year fixed rate mortgage soared from 4.99% in early August to 6.7% last week. The spike in rates is almost as stunning as the surge off the historic lows that began in January. Mortgage rates were last this high in 2007. The home buyers who jumped into the market in August are likely heaving large sighs of relief!
![Sources include: Board of Governors of the Federal Reserve System (US), Market Yield on U.S. Treasury Securities at 30-Year Constant Maturity [DGS30], retrieved from FRED, Federal Reserve Bank of St. Louis and Freddie Mac, 30-Year Fixed Rate Mortgage Average in the United States [MORTGAGE30US], retrieved from FRED, Federal Reserve Bank of St. Louis, May 1, 2022](https://fred.stlouisfed.org/graph/fredgraph.png?g=UnLb)
Be careful out there!
Full disclosure: long ITB shares


Usually October / November is beginning of trading season for housing stocks till April . Do you see that pattern to continue this year ?
Yes. I am betting on the same cycle. I have written about how to trade this cycle as well. Note in this post I noted I am going to wait as long as possible (late November) before launching into the trade.