

Stock Market Commentary:
For those desperately looking for the “Fed pivot”, today’s Federal Reserve statement on monetary policy disappointed with a validation of the breakdown leading into the Fed meeting. Fed Chair Jerome Powell was almost unrelenting from start to finish with his efforts to stay on message: inflation remains too high, and the Fed remains undeterred in driving rates higher to lean against pricing pressures. Last week’s CPI shocker likely underlined the Fed’s determination to keep its hawks in flight. The stock market responded by sending the S&P 500 back into a bear market. Buyers got faked out for 15-20 minutes in the middle of the post-Fed selling.
Powell’s comments on the housing market at the end of the press conference closed the door behind the hawks escorting the bears back into sentiment. Powell warned that shelter inflation will remain high for some time. Given persistent shelter inflation helped the Fed to finally take action against inflation, I interpret this warning to mean the Fed will keep rates higher for longer and will stay more hawkish than many imagine.
These next observations include the insights of a long-time reader. The pandemic-driven rush of liquidity into the economy is being definitively unwound. Just as policy makers had no real playbook for responding to the shutdown of the global economy 2 1/2 years ago, there is no real playbook for fighting today’s confluence of inflationary pressures. That rush of liquidity helped set up the economy for today’s inflation. Accordingly, the run-off of that liquidity is likely to have unanticipated consequences. Thus, the Fed runs the risk of tightening too fast and too far as they race to reverse the mistake of leaving monetary policy overly accommodative for too long. In a world with near frictionless communications, digital money, and digital services, the hyper-stimulus from around the planet created massive economic distortions. I can only assume that what waits for the global economy on the other end of this cycle is yet one more distortion. In other words, I am bracing myself!
The Stock Market Indices
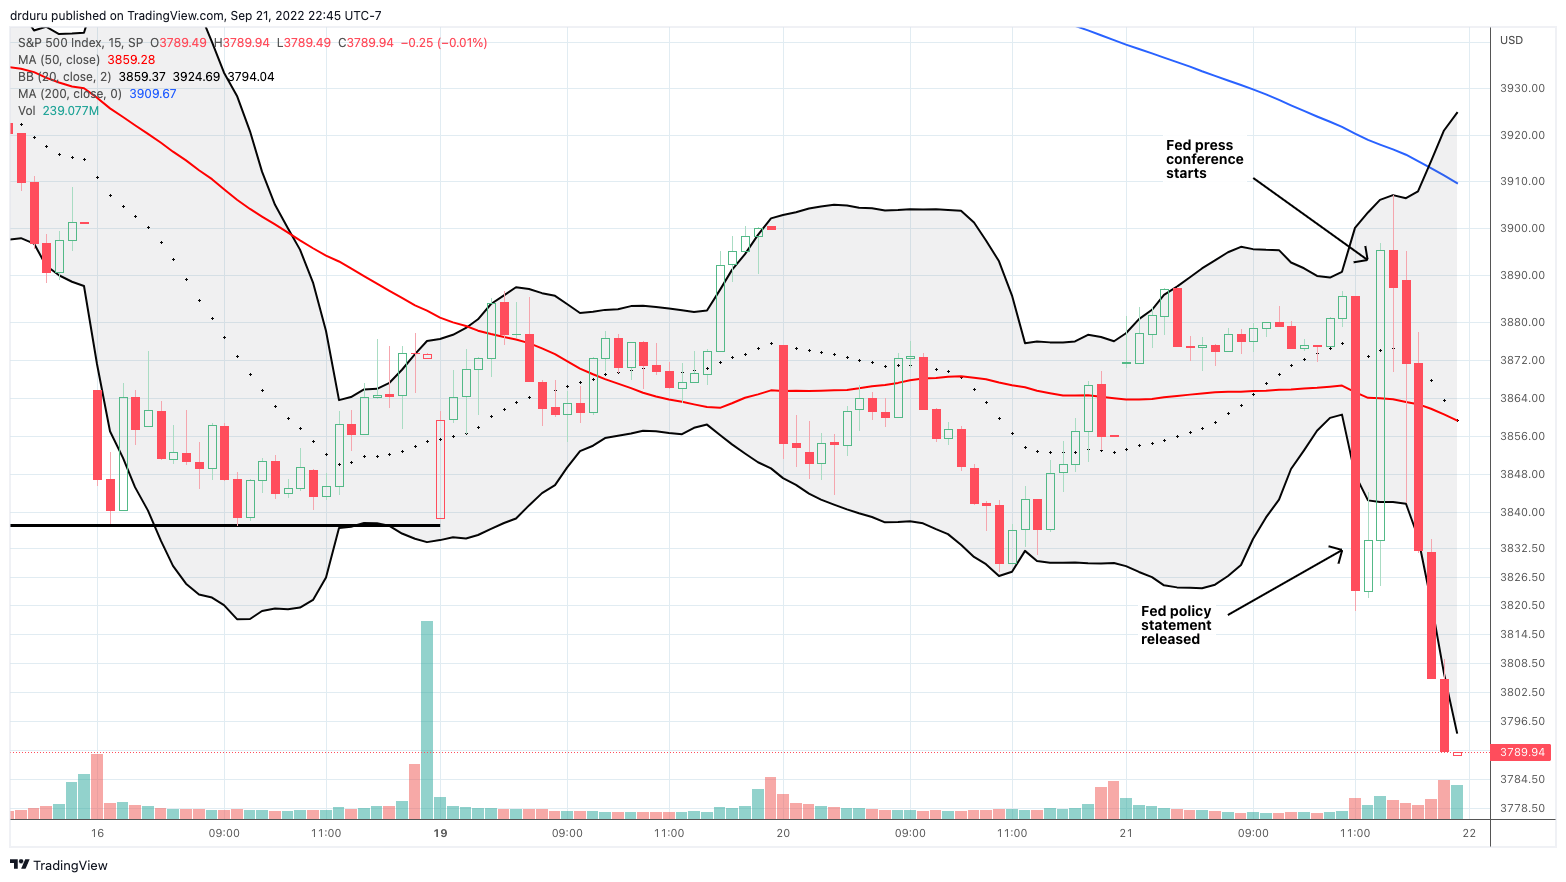
S&P 500 (SPY) buyers put up a fight for three days at support from the bear market line. The Fed’s hawks squashed the fight. After the dust settled on the intraday gyrations, the index closed with a 1.7% loss and a 2-month low. The index is just one lower close away from confirming the breakdown and threatening a test of the June lows. I held all my SPY put positions (my residual call option is essentially worthless now).
")
The NASDAQ (COMPQ) experienced a slightly wilder gyration than the S&P 500 did. At its high of the day, the tech laden index managed to trade above the last three days of churn. The dust settled on a 1.8% loss and 2-month low. The NASDAQ looks set to challenge its June low in due time. I took profits on my QQQ put spread expiring Friday but held all other QQQ put positions (expirations next week and in October).
")
The iShares Russell 2000 ETF (IWM) lost support at the September low. The ETF of small caps lost 1.5% and closed at a 2-month low. IWM looks set to retest its pre-pandemic high on its way to testing the June low.
")
Stock Market Volatility
The volatility index (VIX) “should” have closed much higher. Instead, the VIX only gained 3.1% despite the hawks escorting bears back into market sentiment and significant price breakdowns. At its highs, the VIX hit 30.2. I am quite surprised the faders managed to keep the VIX off that high. So now the VIX remains barely locked into the trading range that has dominated its behavior since late August.
")
The Short-Term Trading Call With A Nervous Breakdown
- AT50 (MMFI) = 23.3% of stocks are trading above their respective 50-day moving averages
- AT200 (MMTH) = 23.4% of stocks are trading above their respective 200-day moving averages
- Short-term Trading Call: neutral
AT50 (MMFI), the percentage of stocks trading above their respective 50DMAs, closed at 23.3%. My favorite technical indicator is just a “day’s range” away from the 20% oversold level. I wish AT50 were further away from that key buy zone because I am in no mood to speculate on longs so fresh off bearish breakdowns. So unlike most adventures into oversold territory, I will be slow to trigger the AT50 trading rules. I was similarly tentative during May’s slide into oversold trading conditions. I did not get comfortable until AT50 first emerged from oversold territory. This time around I want to see a real spike in the VIX deep into oversold territory before I get constructive.
There are several stocks with telling stories – first, of course, is Apple Inc (AAPL). AAPL somehow rallied sharply going into the Fed meeting. The stock hit stiff resistance at its 20-day moving average (DMA) (the dotted line below) before the post-Fed reversal. AAPL is now one of the market’s “last defenses” with a September low still lower than today’s close. A breakdown from there could usher in an extended selling period back to June prices.
")
Despite all the recession fears, a purveyor of expensive coffee has churned higher and higher since its May lows. Starbucks Corporation (SBUX) has enjoyed a ride up its uptrending 50DMA (the red line below) since the late June breakout. Even today’s 2.4% loss left SBUX tucked away in its uptrend. SBUX remains bullish but a breakdown below converging support at the 200DMA, 20DMA, and 50DMA will be quite bearish.
")
For some reason, Piper Jaffrey upgraded Carvana Co (CVNA) last week. The substantial move from neutral to overweight sent CVNA up 15.5% on the day. Sellers happily seized on the opportunity to consume those gains the very next day. CVNA is now once again in post-earnings negative territory. These fades tend to exhaust buyers and increase the odds CVNA will retest, and even break, the lows from the summer. CVNA could be a metaphor for exhausted buyers across the stock market.
")
")
")
")
Be careful out there!
Footnotes
“Above the 50” (AT50) uses the percentage of stocks trading above their respective 50-day moving averages (DMAs) to measure breadth in the stock market. Breadth defines the distribution of participation in a rally or sell-off. As a result, AT50 identifies extremes in market sentiment that are likely to reverse. Above the 50 is my alternative name for “MMFI” which is a symbol TradingView.com and other chart vendors use for this breadth indicator. Learn more about AT50 on my Market Breadth Resource Page. AT200, or MMTH, measures the percentage of stocks trading above their respective 200DMAs.
Active AT50 (MMFI) periods: Day #56 over 20% (overperiod), Day #2 under 30% (underperiod), Day #7 under 40%, Day #9 under 50%, Day #17 under 60%, Day #18 under 70%
Source for charts unless otherwise noted: TradingView.com
Full disclosure: long QQQ put vertical and calendar spreads, long SPY call, calendar put spread and short put spread
FOLLOW Dr. Duru’s commentary on financial markets via StockTwits, Twitter, and even Instagram!
*Charting notes: Stock prices are not adjusted for dividends. Candlestick charts use hollow bodies: open candles indicate a close higher than the open, filled candles indicate an open higher than the close.
Last big bounce right at the bear market line for the DJI/NYSE composite. If gets below that look out below ….
Be afraid… =gulp=