Stock Market Commentary:
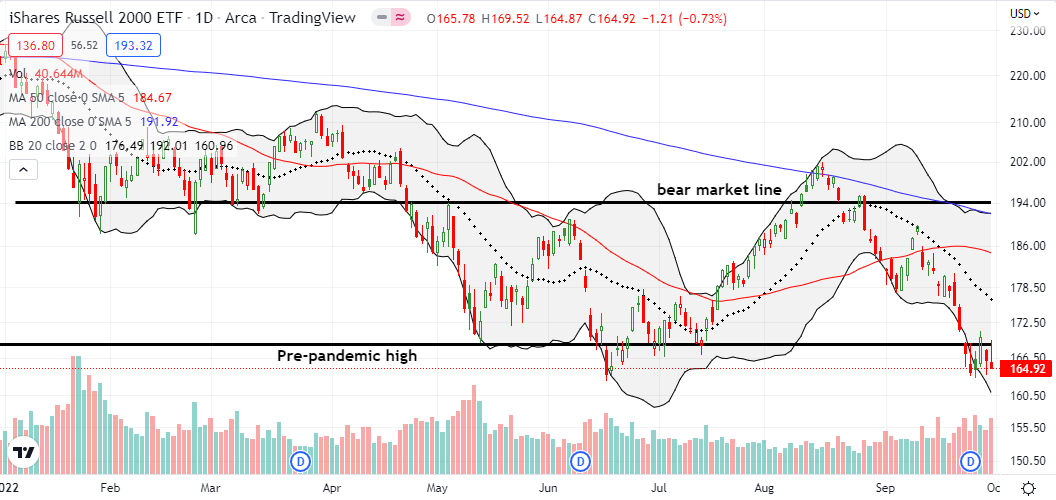
September was about as somber as it gets for financial markets. The S&P 500 lost 9.3% for the month which falls well below both the median and average (negative) historical performance for the index. With the June lows breached, the pandemic-era gains for the S&P 500 and the NASDAQ are now at risk. The S&P 500 is clinging to a 5.7% gain above its pre-pandemic high. The NASDAQ holds a remaining 8.2% gain above its pre-pandemic high. The iShares Russell 2000 ETF finished reversing its pandemic-era gains at its May lows and is below the pre-pandemic lows yet again. In other words, the Federal Reserve giveth, and the Federal Reserve taketh away. The U.S. central bank, in parallel with other major central banks, is rapidly draining the liquidity and the enthusiasm that they eagerly stoked in response to the pandemic-driven economic crisis.
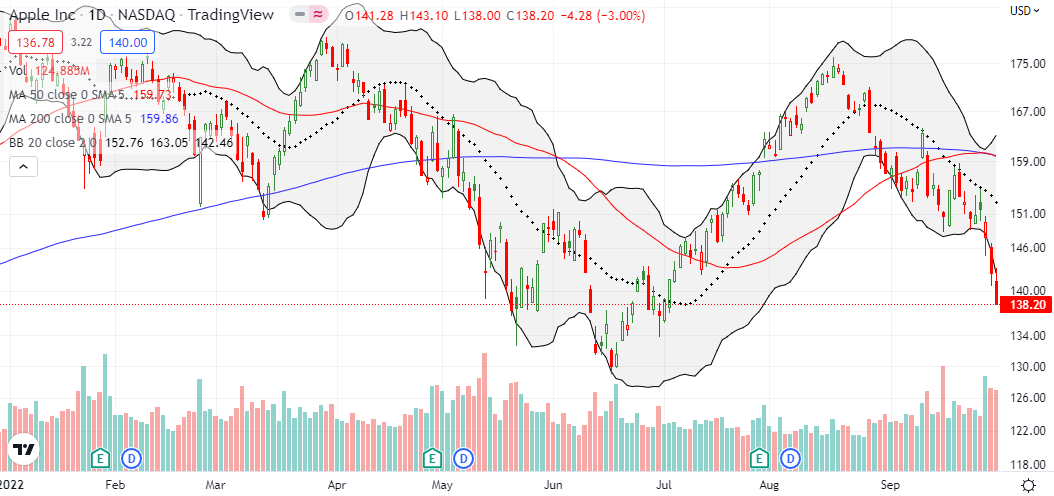
Apple Inc (AAPL) is 7.4% of SPY. America’s favorite stock is 14.0% of QQQ. This #1 ranking in these major indices makes AAPL’s fate an important part of the market’s struggle to land a bottom deep here in oversold territory. Rumors about production halts and two major analyst downgrades slammed AAPL to the tune of an 8.1% loss for the week. While the market escaped AAPL’s woes on Wednesday with a 1.9% rally on the S&P 500, the subsequent selling in AAPL proved too much to bear. AAPL is finally at risk for a test of its June lows…which means the major indices could go even lower before finding a bottom in the near-term.
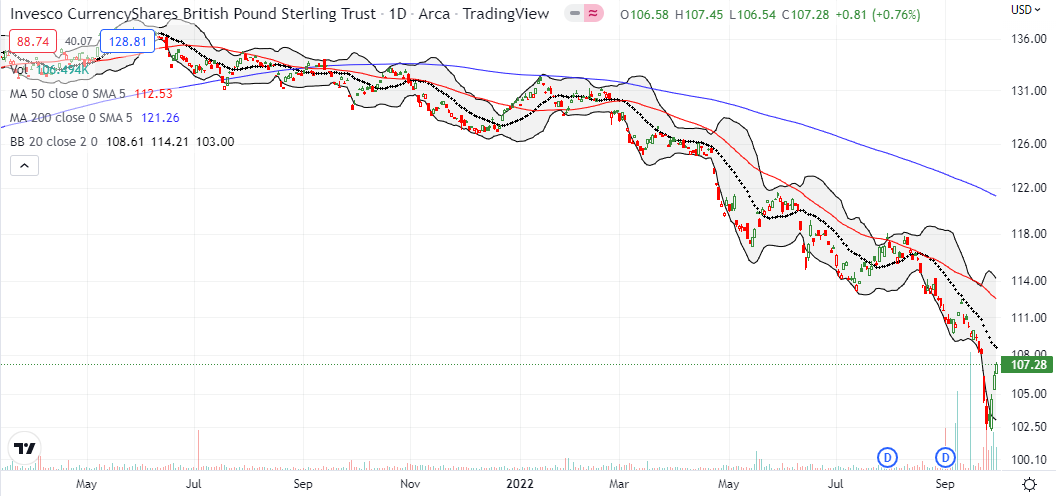
In a sign of the times, the British pound (GBP/USD) delivered a classic display of a snapback from a trading extreme. The Invesco CurrencyShares British Pound Sterling Trust (FXB) started the week with a steep 2-day plunge. The collapse spooked the Bank of England (BoE) enough to force them to temporarily pause monetary tightening to buy British bonds (gilts). The intervention reversed the market’s mood and helped reverse most of FXB’s loss for the week. Still, the British pound remains at risk as the overall downtrend is as strong as ever.
The Stock Market Indices
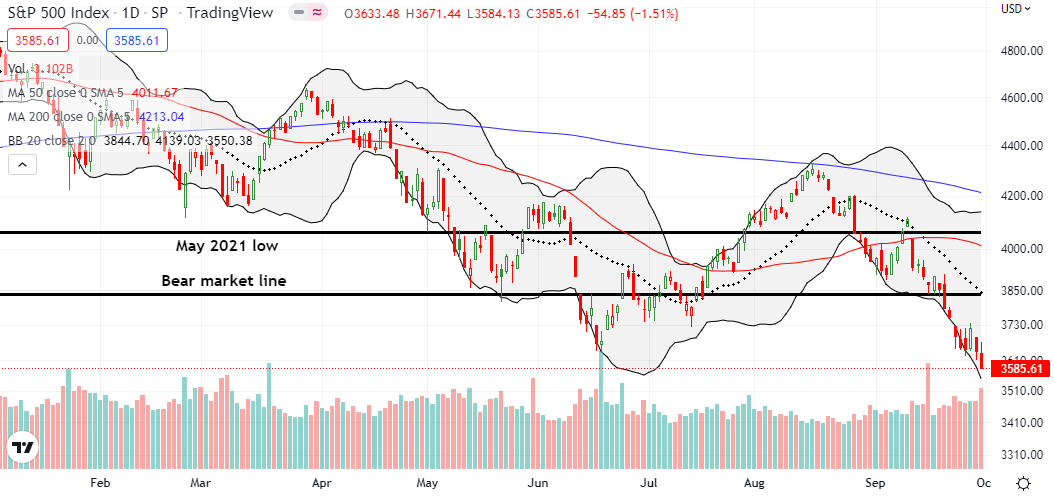
For one day, I thought an oversold bounce was underway. On Wednesday, the S&P 500 (SPY) bounced 2.0% in sympathy with the Bank of England’s intervention in the UK’s bond market. The move seemed to rekindle (desperate) hopes that the Fed would similarly soon back down from its hawkishness. Of course, the economic situations are very different between the two countries, but even the slightest spark can ignite a strong rally during oversold periods. The Fed was quick to dispel these hopes, and the selling promptly resumed. The June lows have moved from promising support to potential resistance.
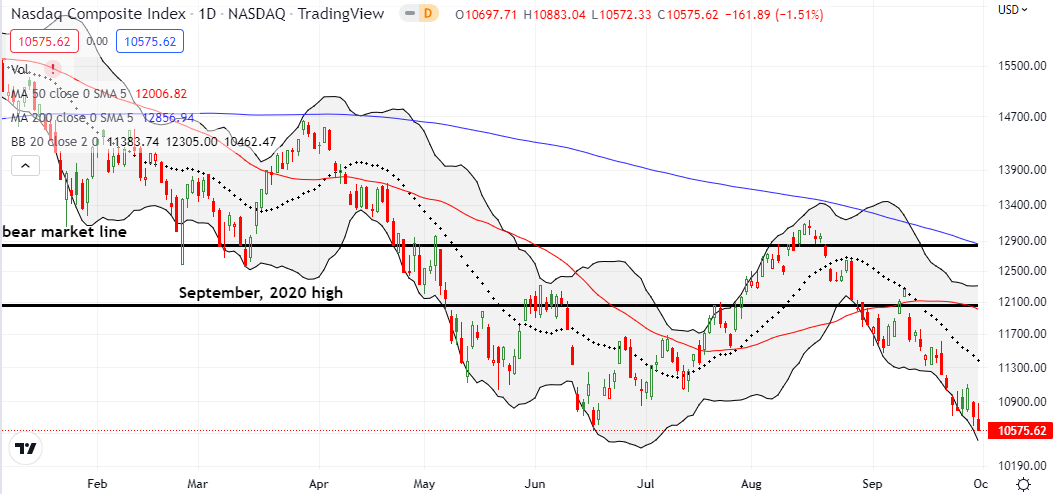
The NASDAQ’s (COMPQ) dance with its June low ended with Friday’s 1.5% loss. The 26-month low puts the pre-pandemic high at risk of a test. As I stated earlier, an on-going plunge for AAPL increases the odds that the NASDAQ (and the S&P 500) will finish reversing all its pandemic era gains. Note that at one point, the NASDAQ rallied back to flat with Thursday’s close before fading to its close. This kind of trading action exhausts buyers and increases the odds of further selling in the coming week.
The iShares Russell 2000 ETF (IWM) out-performed the S&P 500 and the NASDAQ relative to the June lows. IWM churned all week just below its pre-pandemic high in its extended effort to hold the June lows as support. I managed to flip an IWM call option into the rally on Wednesday. Next, I bought another one on Friday’s fade from the pre-pandemic high.
Stock Market Volatility
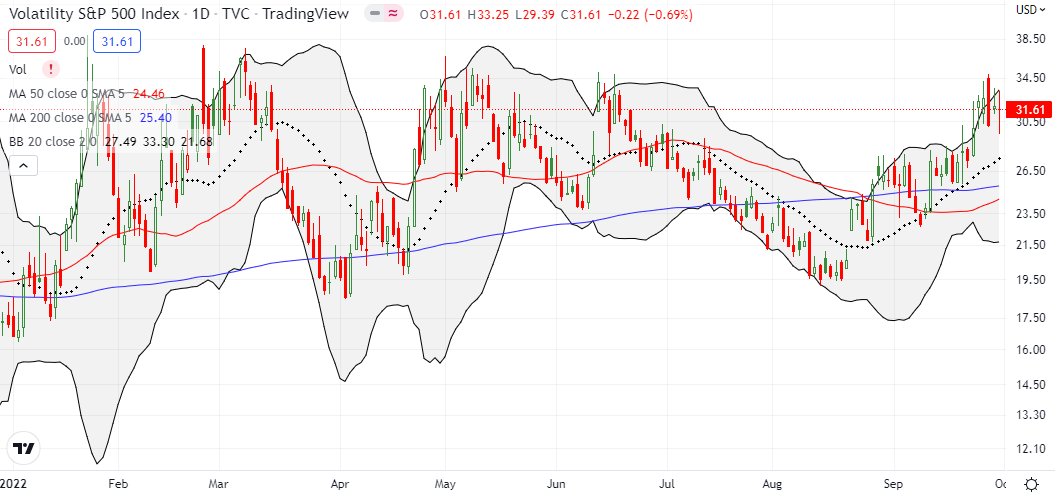
The volatility index (VIX) somehow netted no progress from Monday’s close. On Tuesday, the VIX managed to close at new highs for the week which motivated my purchase of the IWM call option. Wednesday’s rally produced a major fade on the VIX. Despite the resumption of selling, the VIX failed to notch a new closing high for the week. The VIX even lost ground slightly on Friday. I find it hard to expect a bottom in this oversold period without a VIX spike in the middle of the selling.
The Short-Term Trading Call With A Stretch
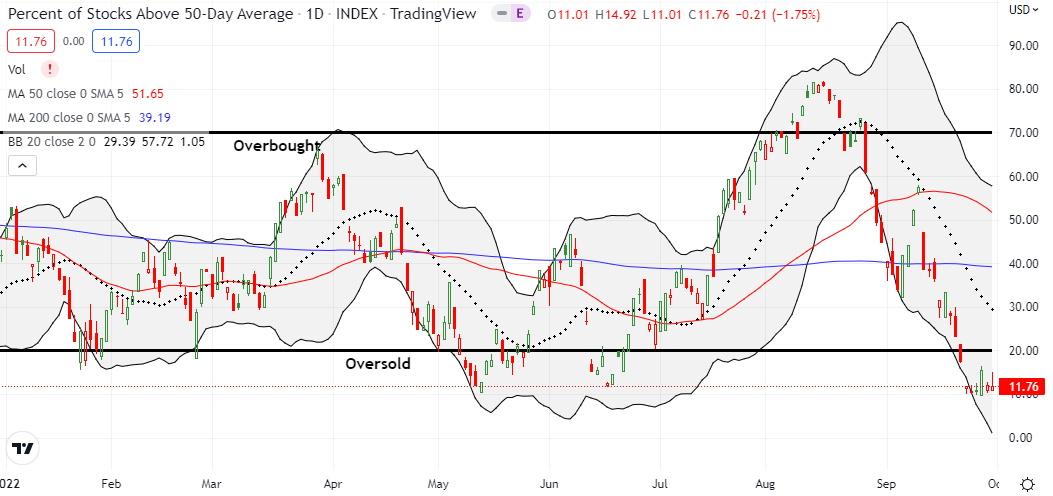
- AT50 (MMFI) = 11.8% of stocks are trading above their respective 50-day moving averages (oversold day #7)
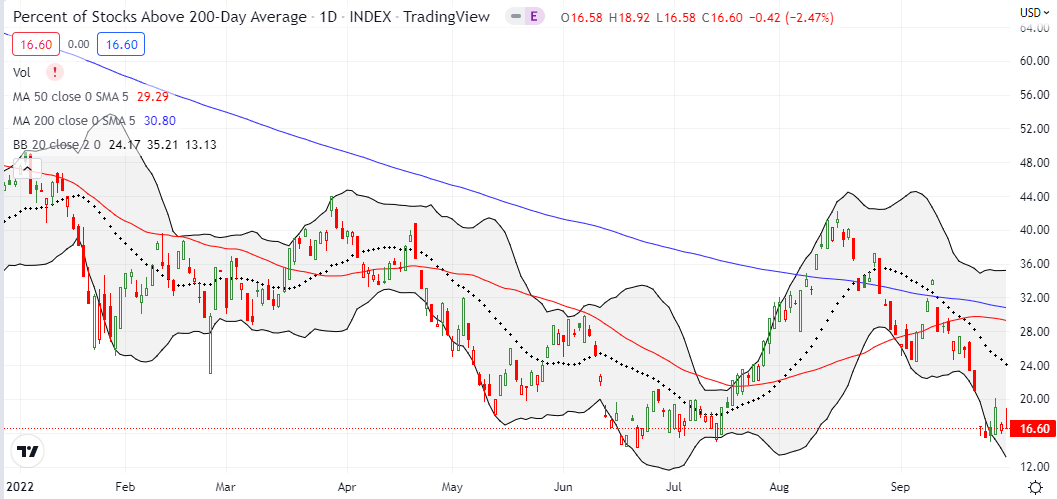
- AT200 (MMTH) = 16.6% of stocks are trading above their respective 200-day moving averages
- Short-term Trading Call: cautiously bullish
AT50 (MMFI), the percentage of stocks trading above their respective 50DMAs, closed flat with the previous week. AT200 performed similarly. In the middle, AT50 churned in place except for Wednesday’s brief pop. As a reminder, the longer an oversold period lasts, the more bearish the implications. For example, the first May oversold period lasted 6 days. The first bounce out of oversold conditions was brief. Moreover, AT50 returned to oversold conditions the next month. June’s 6-day oversold period finally exhausted sellers enough to make way for a sustained bear market rally. All else being equal, I expect similar buyer weakness and hesitancy to emerge from this extended oversold period.
Even with the market at risk for further selling, I am keeping the short-term trading call at cautiously bullish per the AT50 trading rules. However, the VIX’s tepid behavior complicates expectations for the oversold period. I cannot get aggressive to the long side without selling accompanying a VIX surge (note, it is possible big money traders have already loaded up on all the put protection they want). I have a core of SPY options expiring in October which I hope are profitable upon the end oversold trading conditions. Besides that positioning, I am targeting select buys. The IWM call flips are an example which get more attractive above the pre-pandemic high. I took profits on my XME call last week and held the XLI call option. I am looking for a fresh VIX surge to trigger more aggressive trading.
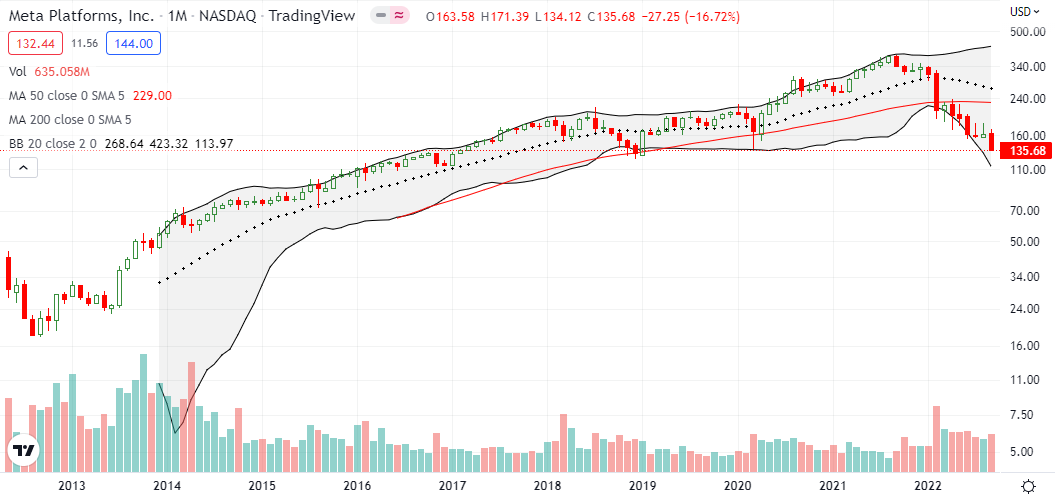
Looking further out in time, I see charts like Meta Platforms Inc (META) as a warning of a secular change in the trading winds. Last October, I declared META a short when it trades below its 200DMA. The stock went on to pivot around its 200DMA until its final breakdown in January. That technical failure preceded META’s epic post-earnings collapse the following month. While I failed to follow-through on my trading call when it could have won big, the setup further underlined the importance of respecting the technicals. Accordingly, the monthly chart below flashes the likelihood of sustained poor performance. The easy years of coasting along META’s uptrend are over…at least for the time being.
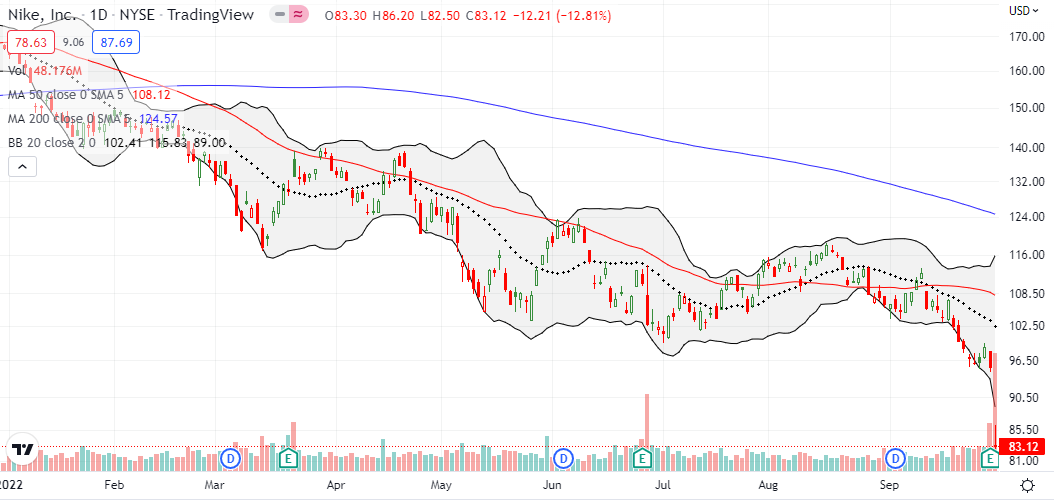
Nike (NKE) suffered a 12.8% post-earnings collapse. NKE has trended down along with the market. NKE’s “logical conclusion” is another one of those reminders of why downtrends command fear and respect. When the market cannot sustain a lift as in the case of NKE, investors are likely concluding that the business is at risk in some way. Sometimes the logical conclusion creates a bad news wash-out. In some cases, like META, the big swoosh is the confirmation of a lasting change. The post-earnings follow-through can be a key tell.
Be careful out there!
Footnotes
“Above the 50” (AT50) uses the percentage of stocks trading above their respective 50-day moving averages (DMAs) to measure breadth in the stock market. Breadth defines the distribution of participation in a rally or sell-off. As a result, AT50 identifies extremes in market sentiment that are likely to reverse. Above the 50 is my alternative name for “MMFI” which is a symbol TradingView.com and other chart vendors use for this breadth indicator. Learn more about AT50 on my Market Breadth Resource Page. AT200, or MMTH, measures the percentage of stocks trading above their respective 200DMAs.
Active AT50 (MMFI) periods: Day #7 under 20% (oversold), Day #9 under 30%, Day #14 under 40%, Day #16 under 50%, Day #24 under 60%, Day #25 under 70%
Source for charts unless otherwise noted: TradingView.com
Full disclosure: long QQQ put vertical and calendar spreads, short SPY put spread, short the British pound
FOLLOW Dr. Duru’s commentary on financial markets via StockTwits, Twitter, and even Instagram!
*Charting notes: Stock prices are not adjusted for dividends. Candlestick charts use hollow bodies: open candles indicate a close higher than the open, filled candles indicate an open higher than the close.


Remember that the pre-pandemic highs should not be considered reliable support; they were artificially induced by Fed stimulus!
Specifically, after nearly a decade of ZIRP, the Fed had finally begun normalizing the Fed Funds rate in December, 2015, raising the target rate from 0.25% to 0.50% for a year, then with regular 0.25% raises starting in December 2016. By January 2019 the target rate had been raised to 2.5%… but in response to the repo market lock-up and consequent equity market crash that happened in late Dec 2019, the Fed stopped raising at that point. Then, perceived by some as a capitulation to Trump’s incessant harangues, in August the Fed began quarter-point *cuts*, resulting in a 1.75% FFR by November.
The equities markets responded by rallying: $SPX went from 2900 before the first cut to 3400 just before the pandemic was recognized as a global disaster, resulting in restoration of ZIRP.
My read of the $SPX chart is that there is genuine support just about 3000. Duru?
The subsequent rate cuts were a “mid-cycle adjustment”. 😉
I never think of support as reliable. It’s only reliable after the fact when the bounce happens to confirm it.
3000 makes sense as the next support level below the pre-pandemic high only because it is a psychologically important number. Before that, there is potential support around 3233 since the S&P 500 bounced off that level twice across September and October, 2020.
Also note around that time, the pre-pandemic high acted as a pivot and demonstrated its psychological importance early on. The first breakout was in August, 2020 and created a sharp spike higher. Sellers faded the move but then were unable to breach 3200.
Friday’s close was also significant as the index is balancing it’s 200 week moving average in addition. I would be neither surprised in days or weeks ahead by washout selling now, OR that close as in island bottom and mega short squeeze to August highs. We’ll find out!!!
I’ve seen several twitter references to the 200-week moving average. So EVERYONE is on alert, especially the trading bots! 😉