Stock Market Commentary:
Sellers followed through with yesterday’s post-Fed selling. With losses across the board, market breadth dropped into oversold trading conditions. Yet, as I explained could be the case, the stock market looks uninteresting. Because the major indices are fresh off important breakdowns, substantial downside risk remains. Because the volatility index actually closed down on the day, negative sentiment in the market does not appear extreme. Since the AT50 trading rules trigger off extreme market conditions, I am doing something I think is unprecedented for me when trading around an oversold period. More on that news when I explain the short-term trading call.
The Stock Market Indices
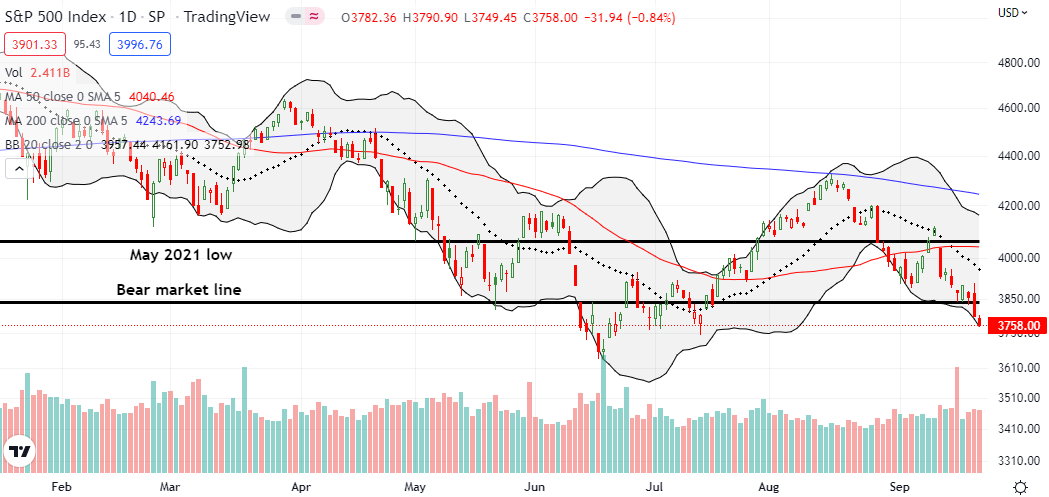
S&P 500 (SPY) lost 0.8% and closed at its third lowest point of the year. With a new bear market period confirmed, the index looks on track for testing the June lows. The trend and trajectory makes the S&P 500 look uninteresting from the long side. I took profits on a calendar put spread which left the rest of my bearish positions sitting in various QQQ put spreads.
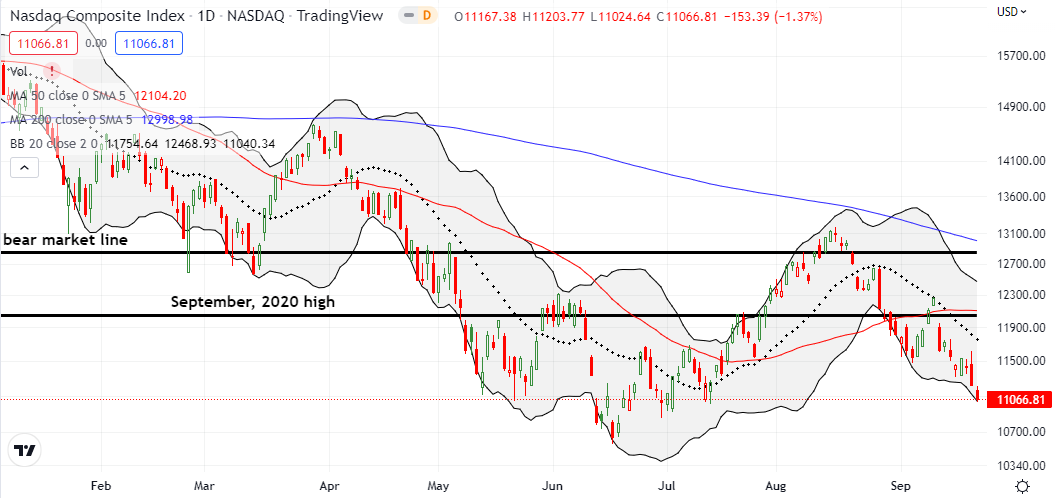
The NASDAQ (COMPQ) last closed at these prices in late June. The day’s 1.4% loss placed the tech-laden index on top of its lower Bollinger Band (BB). This milestone signifies the resumption of the slide that was interrupted by the market’s premature celebration and false breakout earlier in the month. The NASDAQ remains on track to test its June lows and thus looks uninteresting from the long side.
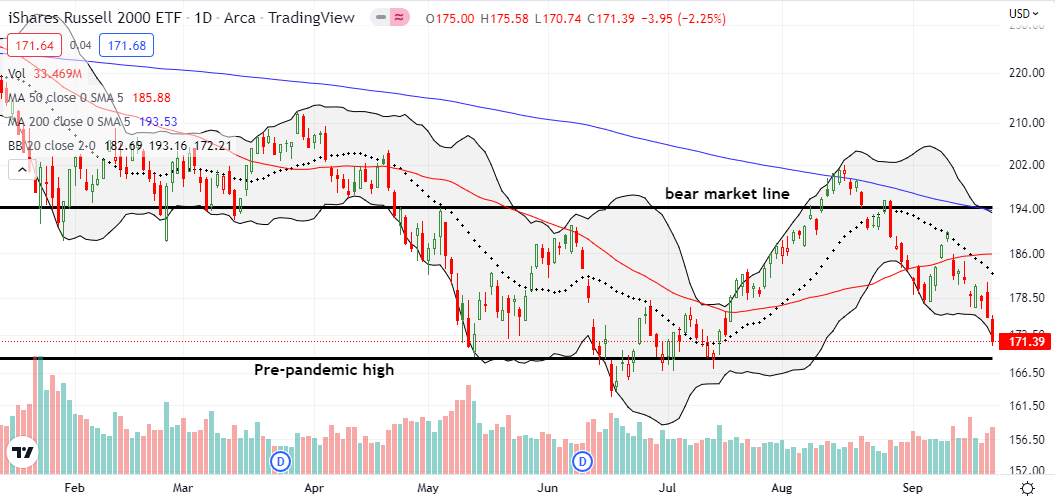
The iShares Russell 2000 ETF (IWM) is on track to retest its pre-pandemic high. The 2.3% loss on the day was the worst across the three major indices and planted IWM at a fresh 2-month low. Perhaps IWM will look interesting for a speculative bet on a rebound off the pre-pandemic high as support.
Stock Market Volatility
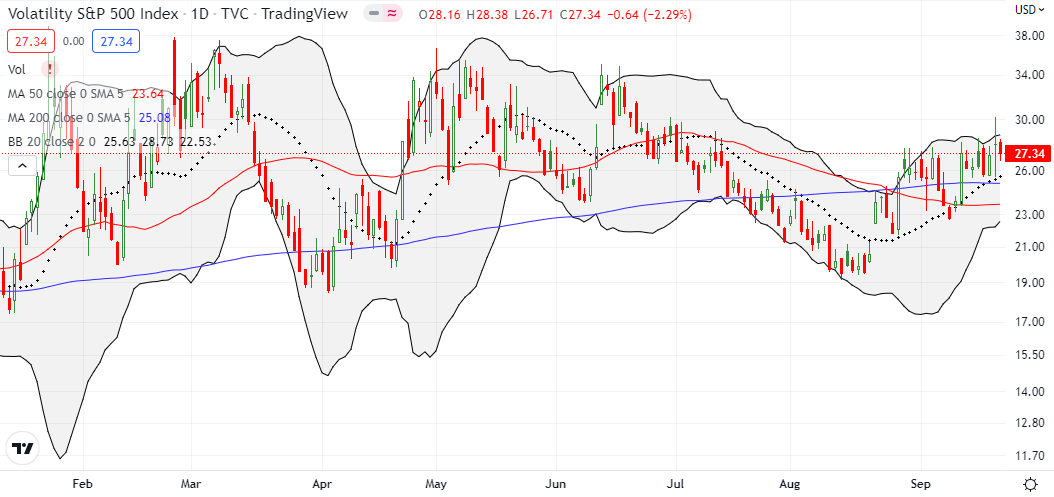
The volatility index (VIX) continues to confound. Despite the extended selling in the stock market, the VIX actually LOST 2.3%. As a result, the VIX remains locked in a 1-month trading range. This behavior makes speculating on a bounce from oversold conditions uninteresting.
The Short-Term Trading Call While Oversold and Uninteresting
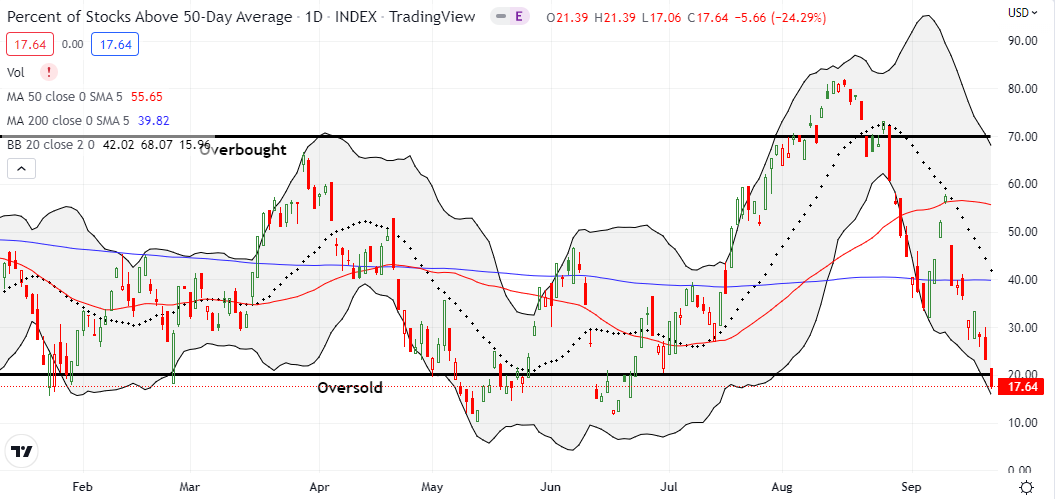
- AT50 (MMFI) = 17.6% of stocks are trading above their respective 50-day moving averages (oversold day #1)
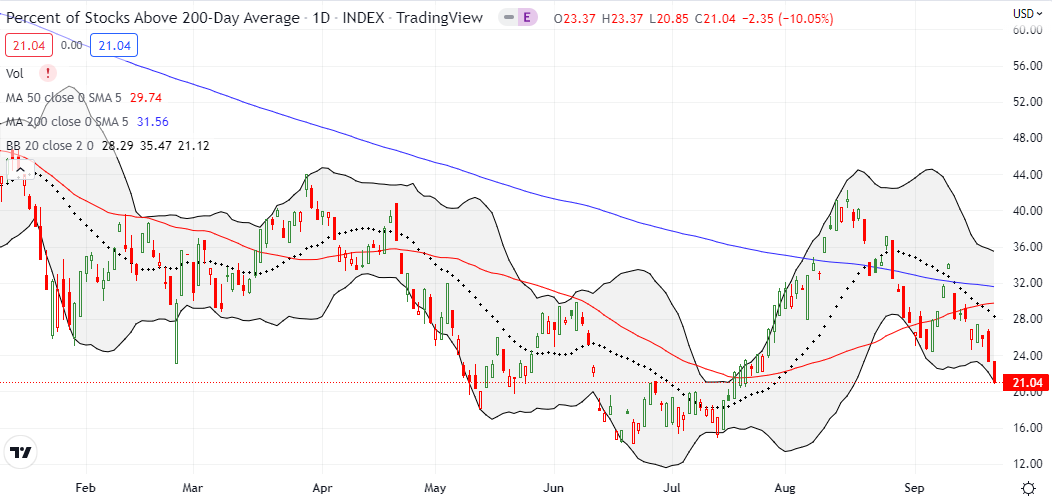
- AT200 (MMTH) = 21.0% of stocks are trading above their respective 200-day moving averages
- Short-term Trading Call: neutral
AT50 (MMFI), the percentage of stocks trading above their respective 50DMAs, closed at 17.6% and ended the day in oversold territory. While the AT50 trading rules recommend covering most or all shorts and getting bullish, I am doing neither. This decision is unprecedented for me as I prefer the aggressive option for speculating on a rebound out of oversold conditions. Instead, I am choosing the conservative route by waiting for my favorite technical indicator to exit oversold conditions AND waiting for the S&P 500 to end its latest bear market. Accordingly I am staying neutral on the stock market. I will flip the script and get aggressively bullish if the VIX surges during this oversold period.
Brian Kelly offered a fascinating explanation for the market’s weakness by pointing at the Japanese yen (FXY). The Bank of Japan held rates negative yet again but decided to try having its cake and eating it too with a currency intervention to stop the bleeding in the yen. Kelly claimed the BoJ had to sell U.S. treasuries to generate dollar sales against the yen. The subsequent spike in Treasury yields pressured stocks. While the story fits the trading action, the Bank of Japan actually has plenty of dollars on tap to sell. Bloomberg reported that the Bank of Japan has over $110B stashed in the Federal Reserve’s Foreign and International Monetary Authorities repo pool. Still, the on-going prospects of a major central bank intervening in currency markets adds yet one more distortion to financial markets which are trying to adjust the Fed’s rapid unwind of its last policy distortion.
Be careful out there!
Footnotes
“Above the 50” (AT50) uses the percentage of stocks trading above their respective 50-day moving averages (DMAs) to measure breadth in the stock market. Breadth defines the distribution of participation in a rally or sell-off. As a result, AT50 identifies extremes in market sentiment that are likely to reverse. Above the 50 is my alternative name for “MMFI” which is a symbol TradingView.com and other chart vendors use for this breadth indicator. Learn more about AT50 on my Market Breadth Resource Page. AT200, or MMTH, measures the percentage of stocks trading above their respective 200DMAs.
Active AT50 (MMFI) periods: Day #1 under 20% (underperiod ending 56 days over 20%), Day #3 under 30%, Day #8 under 40%, Day #10 under 50%, Day #18 under 60%, Day #19 under 70%
Source for charts unless otherwise noted: TradingView.com
Full disclosure: long QQQ put vertical and calendar spreads, short SPY put spread
FOLLOW Dr. Duru’s commentary on financial markets via StockTwits, Twitter, and even Instagram!
*Charting notes: Stock prices are not adjusted for dividends. Candlestick charts use hollow bodies: open candles indicate a close higher than the open, filled candles indicate an open higher than the close.


September’s well-earned reputation as the most dangerous months for the stock market is also lurking in the background here.
One question: does the BoJ’s intervention distort, or play into, the JPY/AUD measure of risk aversion?
Oh yeah. I forgot to do my annual reminder of the most dangerous months. It seemed to easy this time around but here we are. For reference for other readers: https://drduru.com/onetwentytwo/2021/09/11/how-to-trade-during-the-stock-markets-most-dangerous-months/
The AUD/JPY currency trading signal has been busted for quite some time. Other macro factors are dominating. First it was the BoJ’s persistent easy money policy. Now, the distortion of currency intervention could ironically make the signal work again as yen strength plays havoc on stocks. The decline of AUD/JPY will just be about the yen’s strength though and not about Aussie weakness.
I should have added that I need to study the recent SPY vs AUD/JPY relationship to be able to answer your question more precisely. For example, during the brief rally in September, AUD/JPY also reallied.