

Stock Market Commentary:
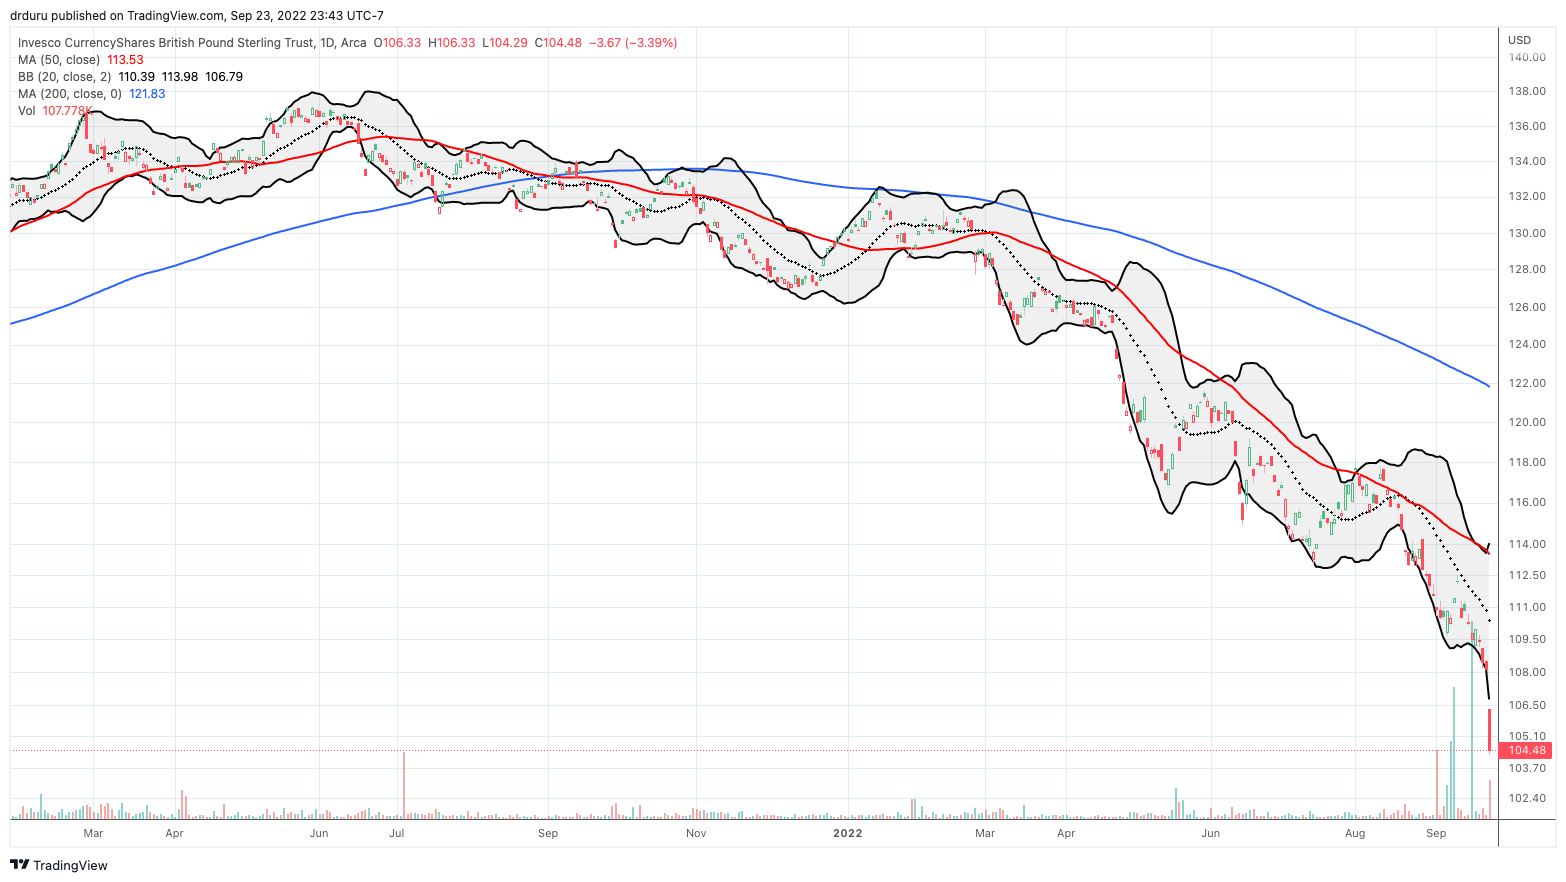
Extreme trading behavior finally appeared right after I insisted the stock market looked uninteresting despite dropping into oversold conditions. Oversold conditions did a stretch toward the year’s lows and created enough concern to finally send the volatility index soaring. Looming over the trading action all day was a collapse in the British pound (FXB) to levels last seen in 1985 (against the U.S. dollar). The new government in the United Kingdom decided to drench its economy in stimulus with tax cuts and increases in government spending. These moves will not only balloon the UK’s already large government debt, but also they directly contradict the anti-inflationary monetary tightening by the Bank of England (BoE). The resulting punishment of the British pound comes just a day after the Bank of Japan (BoJ) intervened to try to stabilize the Japanese yen. A sense of chaos is roiling currency markets and cascading through financial markets. Yet, the extremes that grow from chaos also stretch to the next opportunity.
The Stock Market Indices
At its intraday low, the S&P 500 (SPY) dropped exactly to the June closing low. Buyers took over from there and provided some manufactured relief. The index still lost 1.7% for the day. I followed the bots and technical traders with SPY vertical and calendar call spreads.
")
The NASDAQ (COMPQ) also bounced off its intraday low, but the move was not as poetic as the S&P 500’s rebound. Perhaps a test of the tech laden index’s June low is around the corner. In the meantime, I shed more QQQ put positions. I have one last October put spread.
")
The iShares Russell 2000 ETF (IWM) got close but not quite close enough to the year’s low. However, the 2.4% loss caused more technical damage for IWM as it gapped below its pre-pandemic high. Given IWM traded all day below its lower Bollinger Band (BB), the ETF of small caps looks quite stretched and extreme.
")
Stock Market Volatility
The volatility index (VIX) finally broke out of its recent trading range. A surge in the VIX stretched it all the way to 32. Yet, the faders could not help themselves. They managed to knock the VIX well off its highs. The 9.4% gain closed the VIX at a 3-month high…the June highs remain tantalizingly out of reach.
")
The Short-Term Trading Call With A Stretch
- AT50 (MMFI) = 11.8% of stocks are trading above their respective 50-day moving averages (oversold day #2)
- AT200 (MMTH) = 16.8% of stocks are trading above their respective 200-day moving averages
- Short-term Trading Call: cautiously bullish
AT50 (MMFI), the percentage of stocks trading above their respective 50DMAs, plunged from 17.6% to 11.8%. Combined with the surge in the VIX, trading conditions instantly became extreme enough for me to finally switch the short-term trading call out of neutral. While I would normally get aggressive with an outright bullish short-term trading call, I think the chaos spreading across the bond and currency markets warrants on-going caution. Accordingly, I tentatively followed the AT50 trading rules with a vertical and calendar spread in SPY. I also bought call options in Industrial Select Sector SPDR Fund (XLI) and the SPDR S&P Metals and Mining ETF (XME). XME tested its June low while XLI stretched just past its June low.
The churn in the stock market continues to create rapid shifts in market sentiment. When I wrote about my disinterest in the market, I thought languid conditions would persist with the VIX continuing to confound. Instead, Friday’s extremes kicked me into oversold trading action. From here, further extremes get me incrementally more aggressive on bets to the upside per the AT50 trading rules. My upside expectations are currently tightly capped by the S&P 500’s bear market line.
")
")
Be careful out there!
Footnotes
“Above the 50” (AT50) uses the percentage of stocks trading above their respective 50-day moving averages (DMAs) to measure breadth in the stock market. Breadth defines the distribution of participation in a rally or sell-off. As a result, AT50 identifies extremes in market sentiment that are likely to reverse. Above the 50 is my alternative name for “MMFI” which is a symbol TradingView.com and other chart vendors use for this breadth indicator. Learn more about AT50 on my Market Breadth Resource Page. AT200, or MMTH, measures the percentage of stocks trading above their respective 200DMAs.
Active AT50 (MMFI) periods: Day #2 under 20% (oversold), Day #4 under 30%, Day #9 under 40%, Day #11 under 50%, Day #19 under 60%, Day #20 under 70%
Source for charts unless otherwise noted: TradingView.com
Full disclosure: long QQQ put vertical and calendar spreads, short SPY put spread
FOLLOW Dr. Duru’s commentary on financial markets via StockTwits, Twitter, and even Instagram!
*Charting notes: Stock prices are not adjusted for dividends. Candlestick charts use hollow bodies: open candles indicate a close higher than the open, filled candles indicate an open higher than the close.