Stock Market Commentary:
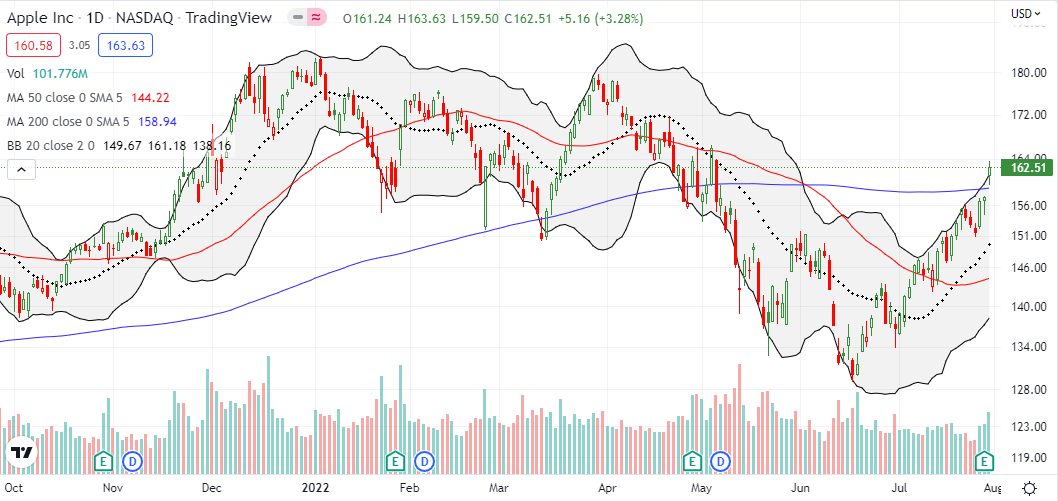
Once again, Apple Inc (AAPL) became a poster child of market sentiment. When AAPL pulled away from resistance at its 50-day moving average (DMA) (the red line below), the move looked like a tease with bear market conditions still in force. Two weeks later, AAPL emerged vindicated as a 3.3% post-earnings gain punched the stock above 200DMA resistance. AAPL’s victory is now the clearest sign that market sentiment has emerged from the heavy burden of bear market blues. Suddenly, the happy tunes of “what recession?” seem to echo across the stock market.
Apple management provided a telling answer to an analyst question about the impact of recession or inflation fears on Apple’s demand (from the Seeking Alpha transcript of Apple’s Q3 earnings call):
“When you look at the product categories, on iPhone, there was no obvious evidence of macroeconomic impact during the June quarter besides FX, obviously. Mac and iPad were so gated by supply that we didn’t have enough product to test the demand. And Wearables, Home and Accessories, as you mentioned and as Luca mentioned, we did see some impact there that we would attribute to a macroeconomic environment.
When you then look at Services, there were some Services that were impacted, for example, like digital advertising was clearly impacted by the macroeconomic environment. And so it’s a mixed bag in terms of what we believe that we saw. Overall, we are very happy with the results. And when you think about the number of challenges in the quarter, we feel really good about the growth that we put up for the quarter.”
The Stock Market Indices
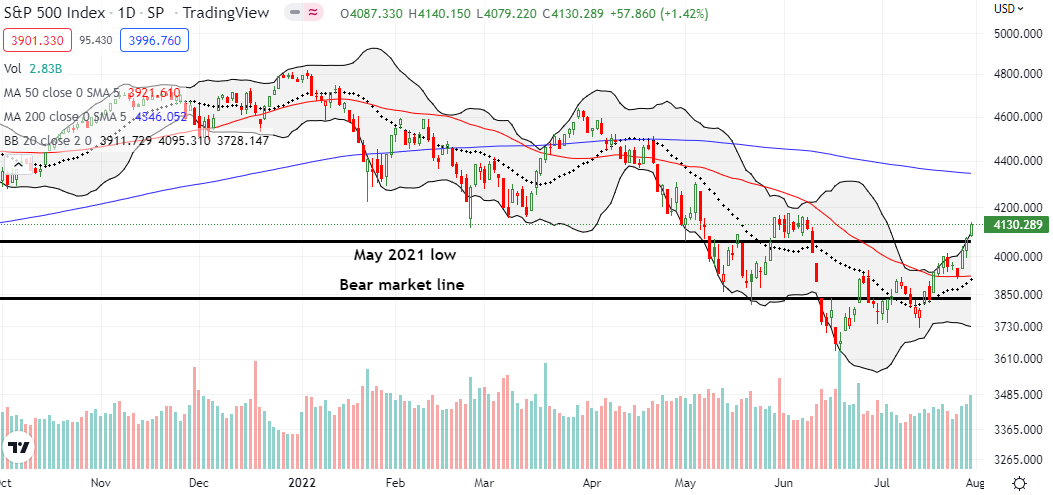
The S&P 500 (SPY) looked in synch with AAPL’s “what recession” call. The index stretched above its upper Bollinger Band (BB) and resistance from the May, 2021 low with a 1.4% gain. While the S&P 500 must still contend with its June highs, an eventual test of overhead 200DMA resistance looks very real. Because of the critical test of overbought conditions (see below), the S&P 500 is only a potential buy-the-dip at or near converging support from its 50 and 20DMAs (sentence corrected). Note that the S&P 500’s 9.1% gain for July exactly reversed its entire loss from the month of June.
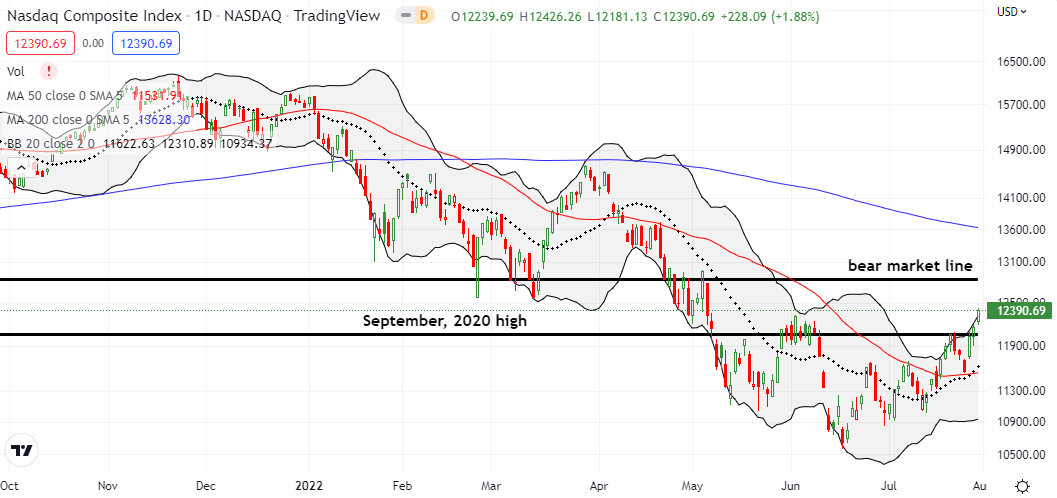
The NASDAQ (COMPQ) did the S&P 500 one better with a close ABOVE its June highs. Moreover, the tech laden index confirmed a breakout above its September, 2020 high. An important test of the bear is in play on this “what recession” theme. Note that the NASDAQ’s 12.4% gain for July positioned it with a 2.6% gain since the last close in May. So much for sell in May and go away?
The week’s strong push, triggered my initial profit target on my QQQ calendar call spread. I was hoping to go into the coming week with the long side intact.
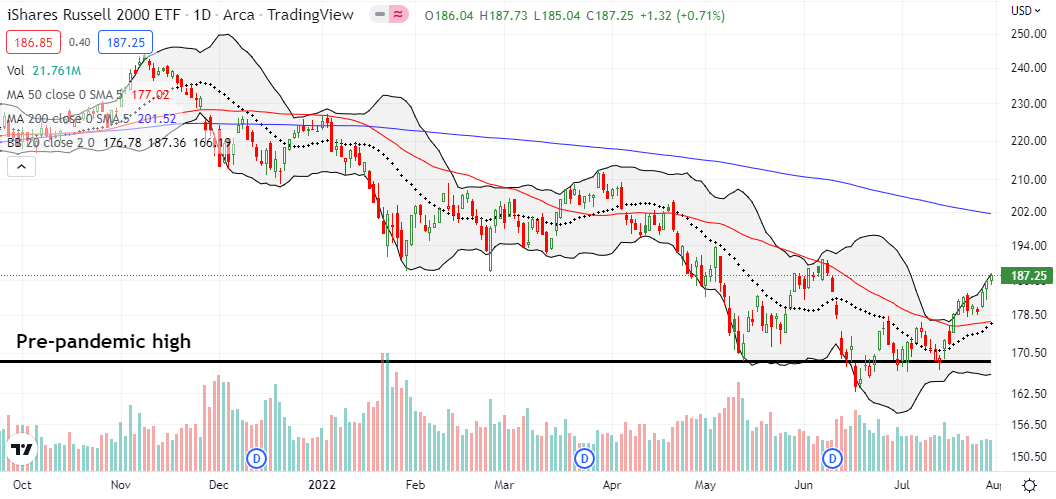
The iShares Russell 2000 ETF (IWM) is creeping its way toward a test of its June highs. I was hoping to get repositioned on a dip but settled for wedging myself into an $189/$194 August call spread. The top of the spread is positioned just above the June high.
Stock Market Volatility
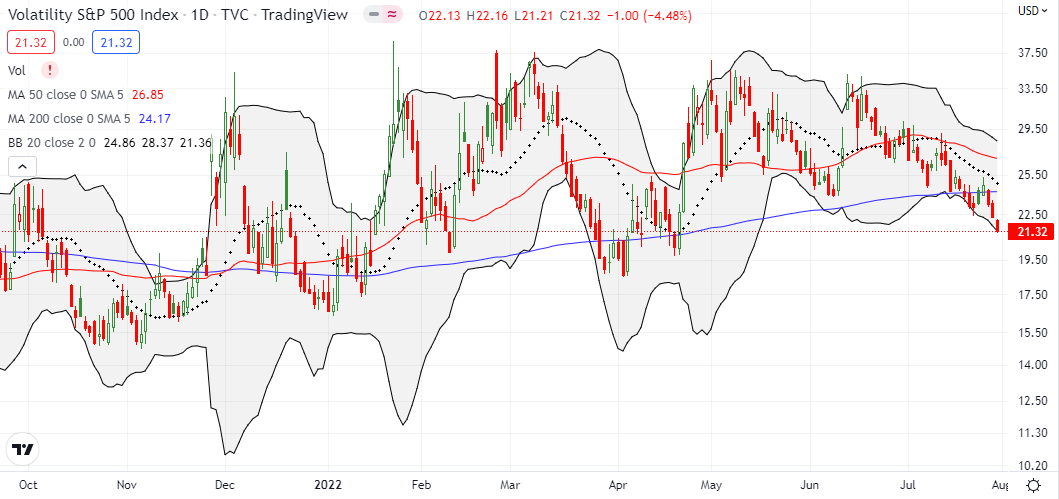
The volatility index (VIX) sank to a new low for July. Since peaking in June, the VIX has consistently slipped lower and lower. The coming test of the 20 threshold defining “elevated” volatility will be a key test of this new “what recession” theme for the market.
The Short-Term Trading Call With A Launch
- AT50 (MMFI) = 68.1% of stocks are trading above their respective 50-day moving averages
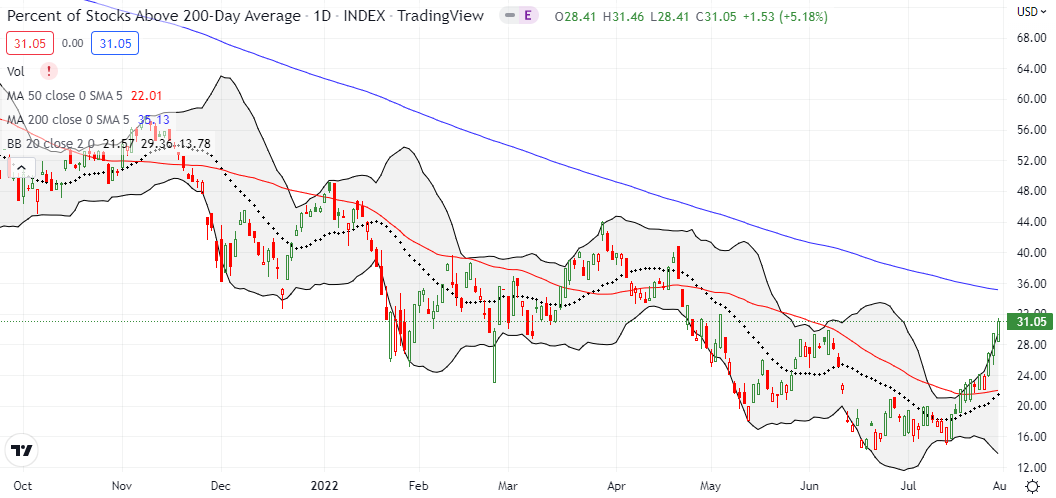
- AT200 (MMTH) = 31.1% of stocks are trading above their respective 200-day moving averages
- Short-term Trading Call: neutral
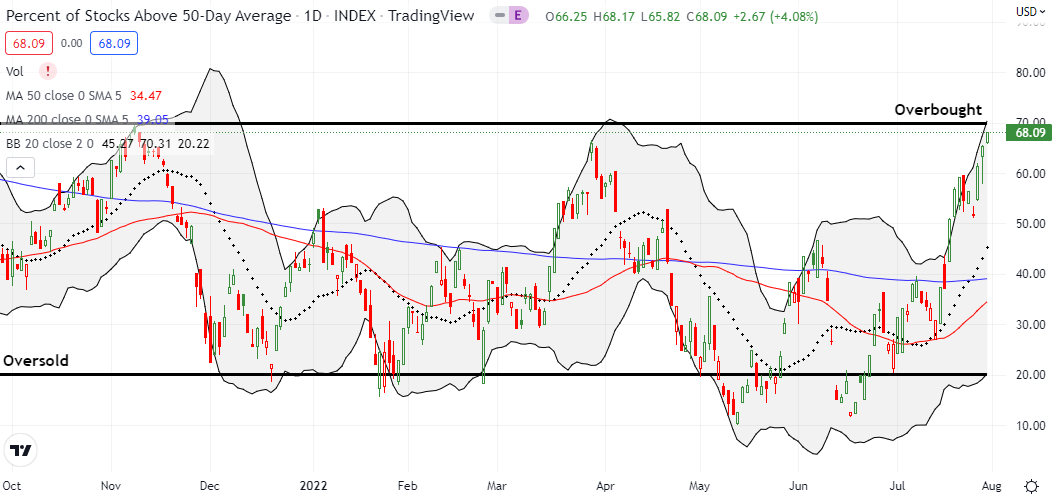
AT50 (MMFI), the percentage of stocks trading above their respective 50DMAs, zipped higher the last three days. My favorite technical indicator closed at 68.1%, right below the overbought threshold at 70%. This is AT50’s highest close of the year. This stretch sets up the market’s first key test of the “what recession” theme. As a reminder, overbought trading conditions by themselves are NOT sufficient to trigger a bearish signal. In fact, an extended stay in overbought conditions is bullish given the amount of buying power the market must sustain to maintain overbought trading conditions. A bearish signal comes on one of two conditions: 1) a failure at resistance from the overbought threshold, or 2) a close below 70% after an overbought period. Condition #1 occurred last November and in March.
Technicals still favor the bulls as the market managed to avoided the dreaded post-Fed fade. Traders and investors barely blinked as Powell made it clear the Fed would power ahead with tightening policy even in the face of “softening” economic conditions. The stock market also powered through the expected negative print from the report on Q2 GDP. I continue to leave the trading call at neutral to avoid churning from bullish and back to neutral or even bearish in the coming days. The moment I downgraded from cautiously bullish to neutral was a true fakeout!
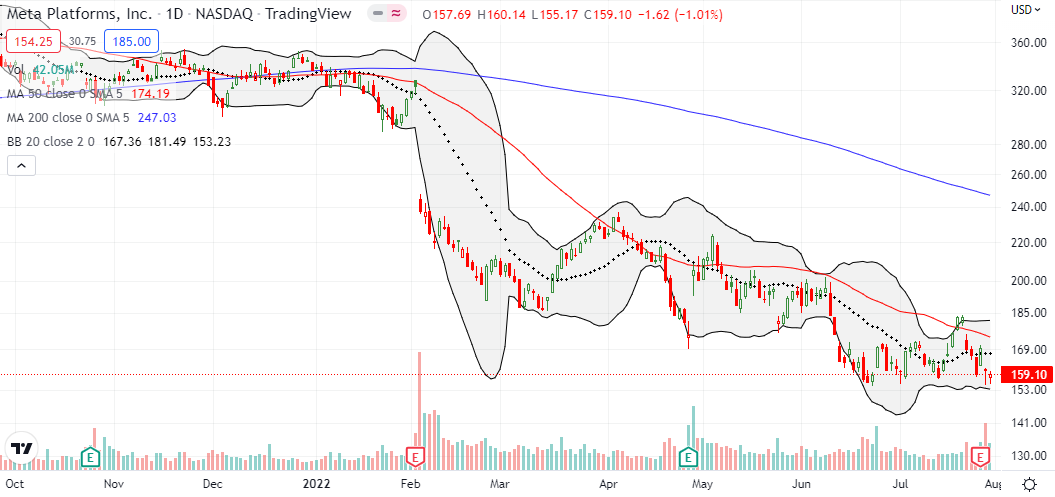
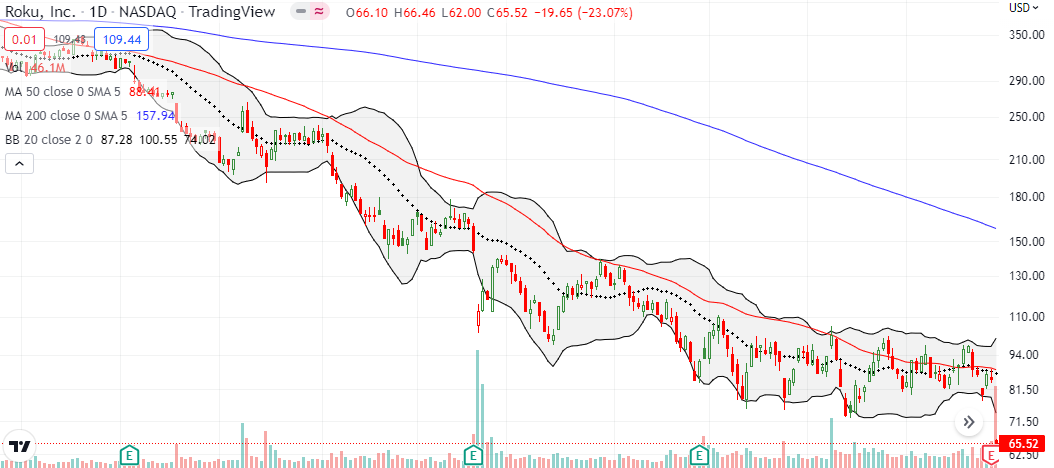
At least two stocks stood out to me in contrast with the celebratory month of trading: Meta Platforms (META) and Roku, Inc (ROKU). These stocks are stark reminders of the rubble getting left behind. The charts say it all: some kind of recession is still very real for these advertising-dependent companies.
Be careful out there!
Footnotes
“Above the 50” (AT50) uses the percentage of stocks trading above their respective 50-day moving averages (DMAs) to measure breadth in the stock market. Breadth defines the distribution of participation in a rally or sell-off. As a result, AT50 identifies extremes in market sentiment that are likely to reverse. Above the 50 is my alternative name for “MMFI” which is a symbol TradingView.com and other chart vendors use for this breadth indicator. Learn more about AT50 on my Market Breadth Resource Page. AT200, or MMTH, measures the percentage of stocks trading above their respective 200DMAs.
Active AT50 (MMFI) periods: Day #22 over 20%, Day #16 over 30%, Day #9 over 40%, Day #9 over 50%, Day #3 over 60%, Day #353 under 70%
Source for charts unless otherwise noted: TradingView.com
Full disclosure: long QQQ put, long IWM call spread
FOLLOW Dr. Duru’s commentary on financial markets via StockTwits, Twitter, and even Instagram!
*Charting notes: Stock prices are not adjusted for dividends. Candlestick charts use hollow bodies: open candles indicate a close higher than the open, filled candles indicate an open higher than the close.


