Stock Market Commentary
The stock market failed its test of the summer of discontent. The bear market stayed true to its name and held firm at important resistance levels. This is a time to shift into neutral in deference to the unenthusiastic buying power and the overwhelming technicals. With earnings season underway and the continuing fallout from on-going recession fears, I see every reason to stand down and wait for clearer trade signals.
The Stock Market Indices
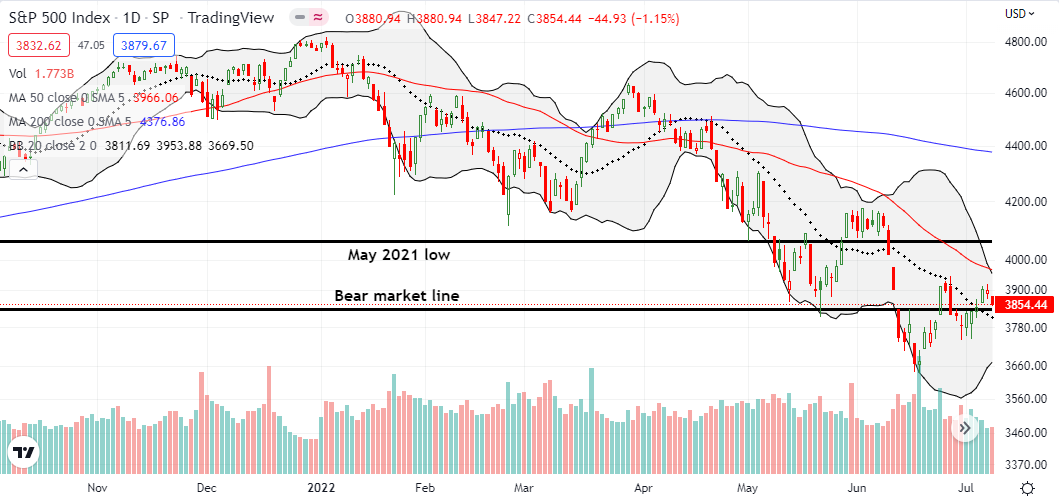
The S&P 500 (SPY) lost 1.2% as it fell back toward its bear market line. Buyers lost enthusiasm for hurtling the last peak and failed to make a push to downtrending 50DMA resistance. At least the index is not (yet?) back in bear market territory.
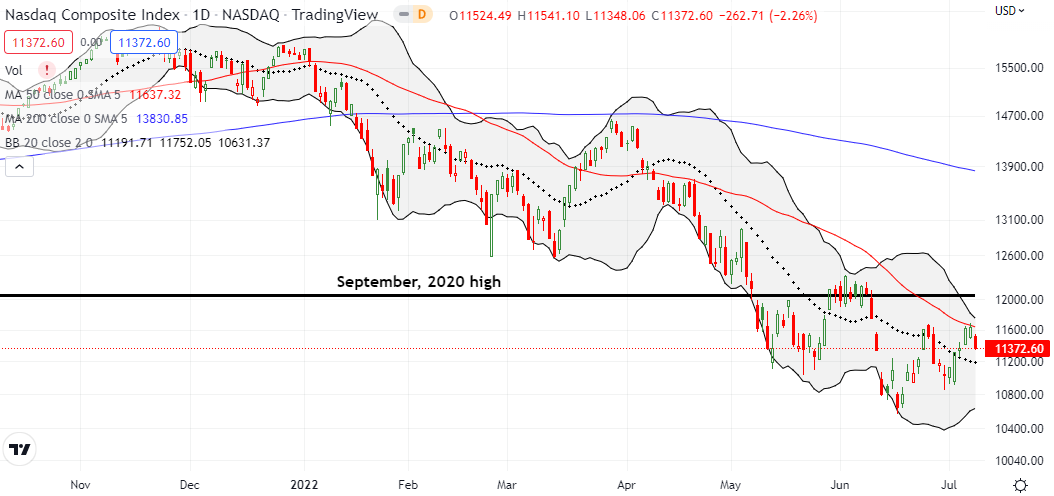
The NASDAQ (COMPQ) failed more significantly than the S&P 500. The tech-laden index lost 2.3% and confirmed resistance at its downtrending 50DMA. This failure also confirmed resistance at the last peak. Perhaps the NASDAQ can hold a pivot around its 20DMA (the dotted line) for the time being.
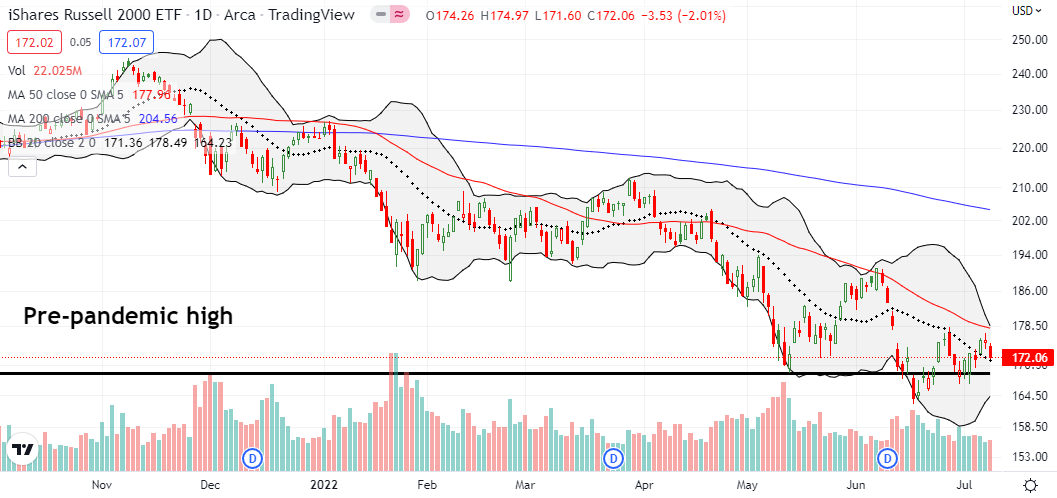
Like the NASDAQ, the iShares Russell 2000 ETF (IWM) confirmed resistance at its prior peak. Additionally, IWM failed to challenge its downtrending 50DMA resistance. The ETF of small caps fell just short. Still, I bought a speculative July $175 call expiring next Friday as a play on a potential rebound from converging support at the 20DMA and pre-pandemic high. If anything good happens in the next week, I should be able to benefit.
Stock Market Volatility
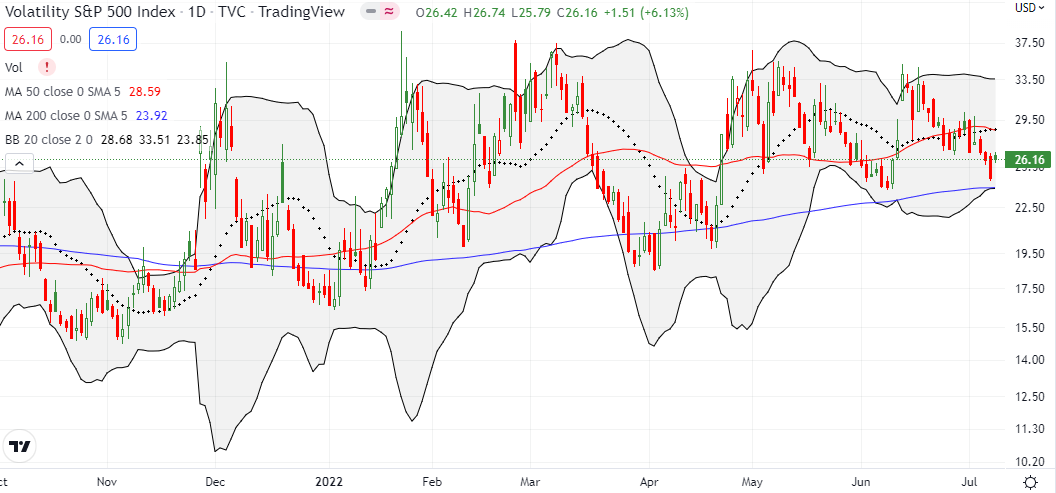
The summer of discontent gapped the volatility index (VIX) higher for a 6.1% gain. Faders even stood back for much of the trade. Suddenly, I have flipped from hoping for a breakdown below the June low to bracing myself for a resumption of the VIX’s uptrend from higher lows.
The Short-Term Trading Call With A Shift Into Neutral
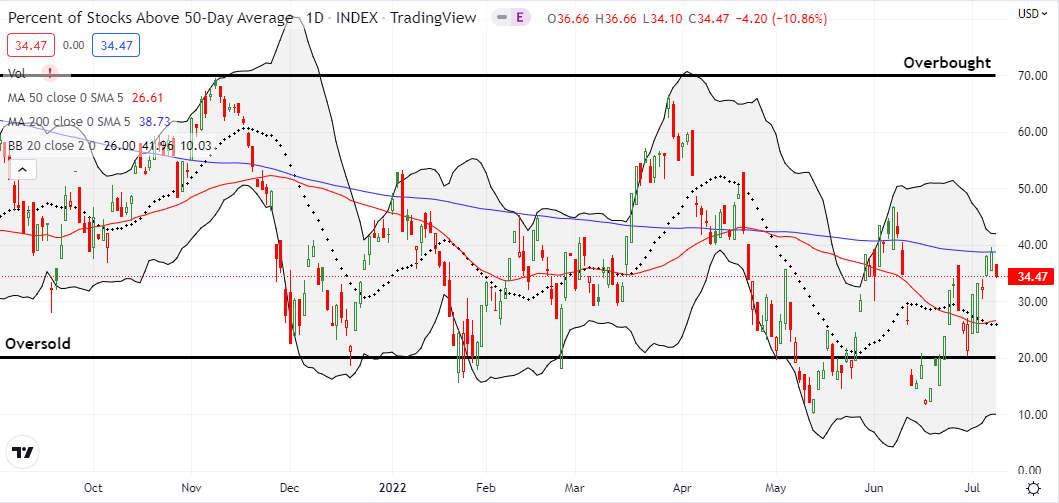
- AT50 (MMFI) = 38.7% of stocks are trading above their respective 50-day moving averages
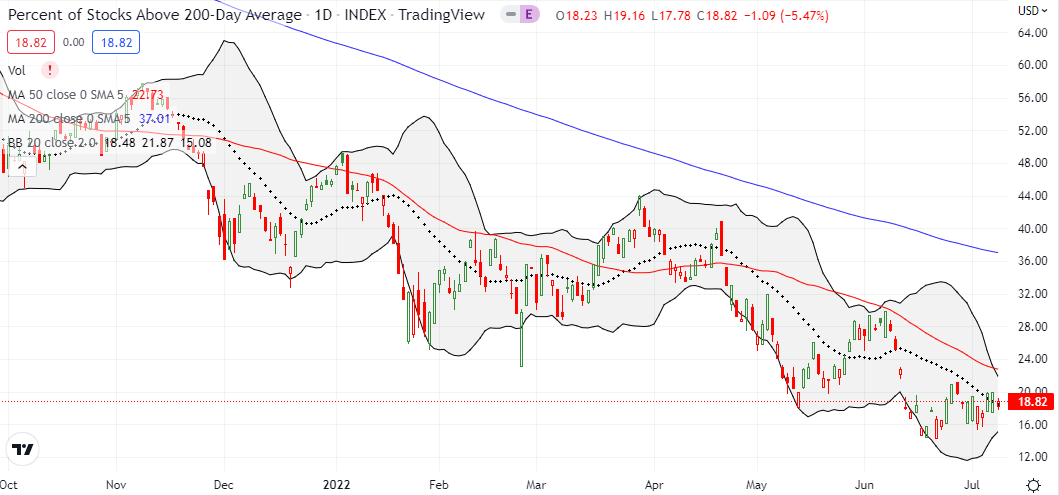
- AT200 (MMTH) = 19.9% of stocks are trading above their respective 200-day moving averages
- Short-term Trading Call: neutral
AT50 (MMFI), the percentage of stocks trading above their respective 50DMAs, confirmed the failure of the big test of the summer of discontent. My favorite technical indicator fell 4 percentage points and looks like it will not break through the June high anytime soon. Sometimes I have been slow (and reluctant) to flip the short-term trading call on such a change in fortunes. Given the bear market trading, I am more inclined to change and shift into neutral. I see fresh downside risks ahead, but I never start a bearish call with AT50 in the 30s. I plan to stay neutral until/unless AT50 drops back to oversold or overbought conditions.
Be careful out there!
Footnotes
“Above the 50” (AT50) uses the percentage of stocks trading above their respective 50-day moving averages (DMAs) to measure breadth in the stock market. Breadth defines the distribution of participation in a rally or sell-off. As a result, AT50 identifies extremes in market sentiment that are likely to reverse. Above the 50 is my alternative name for “MMFI” which is a symbol TradingView.com and other chart vendors use for this breadth indicator. Learn more about AT50 on my Market Breadth Resource Page. AT200, or MMTH, measures the percentage of stocks trading above their respective 200DMAs.
Active AT50 (MMFI) periods: Day #12 over 20%, Day #6 over 30% (overperiod), Day #22 under 40%, Day #66 under 50%, Day #71 under 60%, Day #342 under 70%
Source for charts unless otherwise noted: TradingView.com
Full disclosure: long QQQ put spread, long SPY call spread, long IWM call
FOLLOW Dr. Duru’s commentary on financial markets via StockTwits, Twitter, and even Instagram!
*Charting notes: Stock prices are not adjusted for dividends. Candlestick charts use hollow bodies: open candles indicate a close higher than the open, filled candles indicate an open higher than the close.

