Stock Market Statistics
AT40 = 75.0% of stocks are trading above their respective 40-day moving averages (DMAs) (first oversold day)
AT200 = 18.4% of stocks are trading above their respective 200DMAs
VIX = 29.3
Short-term Trading Call: neutral
Stock Market Commentary
Buyers followed through on the building momentum from the previous two trading days which drew a line the sand for buyers. Buying was broad-based and pushed the stock market right back into contention for an extended overbought rally that would break right through the topping pattern from a week ago.
The Stock Market Indices
The S&P 500 (SPY) soared 3.2% to put a challenge of 200DMA resistance right back into play. A 200DMA breakout should be very bullish. Note how the S&P 500 has churned since its 50DMA breakout last month. I expect the 2019 close to present the next line of resistance after a 200DMA breakout.
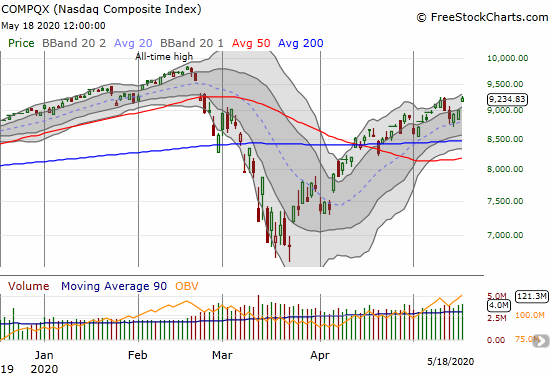
The NASDAQ (COMPQX) actually underperformed the S&P 500 but remains in an even more bullish position. The NASDAQ now looks poised to make a run at its all-time high…and beyond.
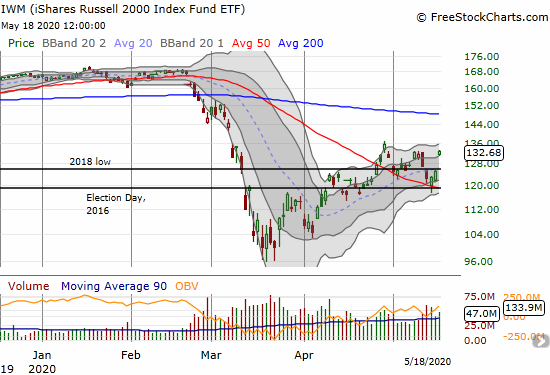
The iShares Russell 2000 Index Fund ETF (IWM) came alive as it rocketed off a confirmation of 50DMA support. IWM was perhaps my biggest miss of the day given the clear bounce from converged support at the 50DMA and the close on Election Day, 2016. The rebound in IWM is also one of the clearest signs that the bulls are itching for a major refresh on the rally from the March lows.
Volatility
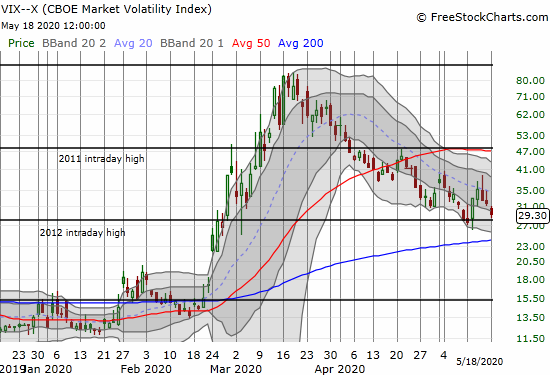
While the major indices made new (marginal) highs, the volatility index did not quite retest recent lows. Still, today’s decline reconfirms the downtrend in place since the March peak. It is getting harder and harder to believe that not long ago the VIX seemed headed straight to 100.
Overbought

AT40 (T2108), the percentage of stocks trading above their respective 40DMAs, crossed into overbought territory for the third time in less than a month (above 70%). While the last dip from overbought conditions was bearish, the stubborn persistence of buyers in creating overbought conditions increases the odds, in my opinion, of an extended overbought rally. All the market needs is confirmation from a 200DMA breakout from the S&P 500.
The Short-Term Trading Call
There is still no change in the short-term trading call. Even if an extended rally unfolds, I will stick to neutral until the S&P 500 confirms a 200DMA breakout. At that point, I will consider going to cautiously bullish depending on other conditions. This “caution” is the mirror image of my refusal to flip to bearish until sellers could punch a hole through 50DMA support…they failed.
Tony Dwyer from Canaccord made another appearance on CNCB’s Fast Money. I am fascinated to see someone so steeped in the fundamentals gradually shift his market read based on price action and technicals. Dwyer made a third change in his read of the market during this crash and recovery. Dwyer first insisted that market psychology demanded a retest of the March lows. When those lows seemed secure without the required retest, he created a higher floor for testing. With the market moving right along without the next test and with the bulls banging on the gates, Dwyer is calling for a “frustration phase” where the market just goes nowhere. Once again, the Fast Money crew failed to cross-reference his previous calls so that people like me could better understand this process.
Stock Chart Reviews – Below the 50DMA
United States Oil Fund (USO)
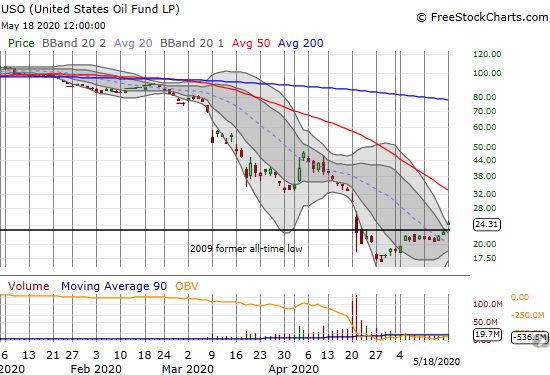
I keep waiting and waiting for oil to bottom. I have made a few untimely bets on previous presumed bottoms. With a small base in place and a breakout above a key technical level, United States Oil Fund (USO) finally looks ready for a real bottom. I am looking to play for a test of declining 50DMA resistance.
Stock Chart Reviews – Above the 50DMA
D.R. Horton (DHI)
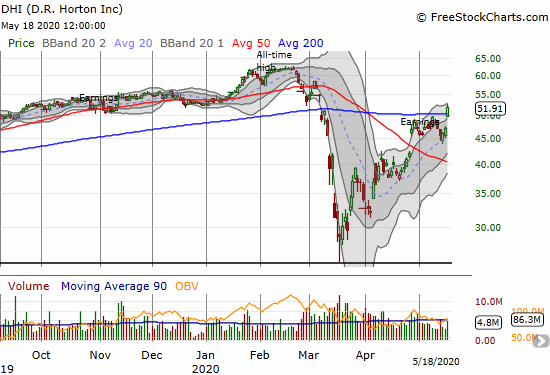
Home builders are taking me by surprise. They had a HUGE day today. D.R. Horton (DHI) was one of three builders I follow with key breakouts. I already want to write a follow-up to my last Housing Market Review! I cannot wait for the next read on home builder sentiment. I will be looking for a big jump to confirm all the increasingly positive sentiment I have been reading in every single earnings report since late March.
Lennar (LEN)
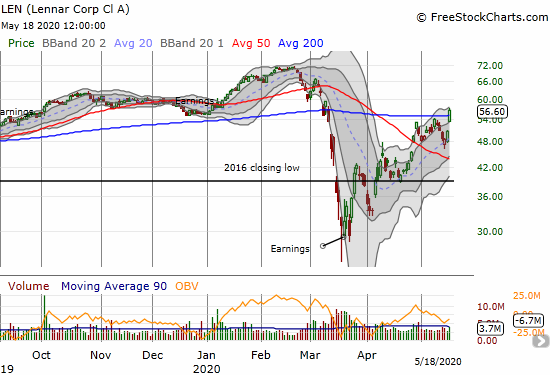
Home builder Lennar (LEN) also had a key 200DMA breakout just waiting for confirmation from a higher close.
Slack Technologies (WORK)
Integrated digital messaging service Slack Technologies (WORK) invalidated its recent breakout with a 7.4% decline. On a day where the market was looking forward to a return to “normalcy”, the stocks that represent the new digital economy took a backseat. I want to use all such moments as potential buying opportunities,. The new digital economy is coming, growing, and pretty much inevitable for the more robust world we need in the future.
Stock Chart Reviews – Bullish Breakout
Palo Alto Networks (PANW)
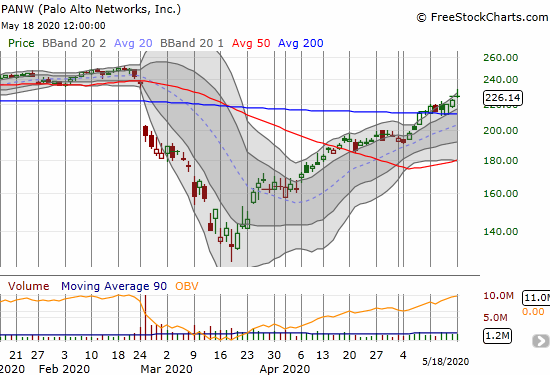
Despite a day of bullish breakouts, cybersecurity software company Palo Alto Networks (PANW) only managed a relatively modest 1.5% gain. I featured PANW for today’s breakout special because PANW already confirmed its breakout last week. Now the stock is riding a steady uptrend. As with all such breakouts, the bullish move gets invalidated by a close under the 200DMA. I moved into a weekly call spread at the $240 strike as a first swing at riding the trend in short-term. I will look at buying shares starting next week if the breakout continues to hold.
— – —
FOLLOW Dr. Duru’s commentary on financial markets via email, StockTwits, Twitter, and even Instagram!
“Above the 40” uses the percentage of stocks trading above their respective 40-day moving averages (DMAs) to assess the technical health of the stock market and to identify extremes in market sentiment that are likely to reverse. Abbreviated as AT40, Above the 40 is an alternative label for “T2108” which was created by Worden. Learn more about T2108 on my T2108 Resource Page. AT200, or T2107, measures the percentage of stocks trading above their respective 200DMAs.
Active AT40 (T2108) periods: Day #25 over 20%, Day #19 over 30%, Day #17 over 40%, Day #16 over 50%, Day #3 under 60%, Day #1 over 70% (1st overbought day ending 4 days under 70%)
Daily AT40 (T2108)

Black line: AT40 (T2108) (% measured on the right)
Red line: Overbought threshold (70%); Blue line: Oversold threshold (20%)
Weekly AT40 (T2108)

*All charts created using FreeStockCharts unless otherwise stated
The T2108 charts above are my LATEST updates independent of the date of this given AT40 post. For my latest AT40 post click here.
Be careful out there!
Full disclosure: long SSO shares, long WORK and short calls, long QQQ calendar call spreads, long PANW calendar call spread
*Charting notes: FreeStockCharts stock prices are not adjusted for dividends. TradingView.com charts for currencies use Tokyo time as the start of the forex trading day. FreeStockCharts currency charts are based on Eastern U.S. time to define the trading day.


